Download to read offline


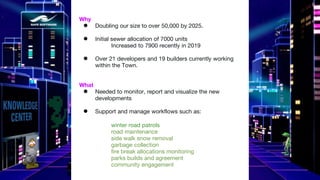


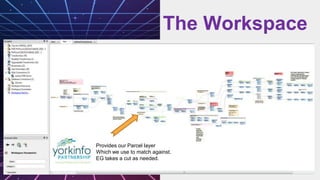
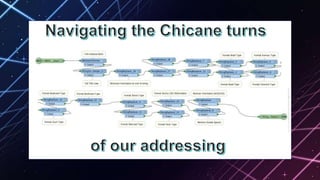

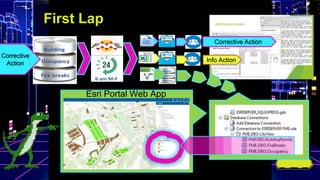
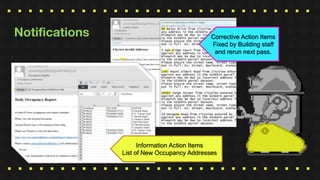
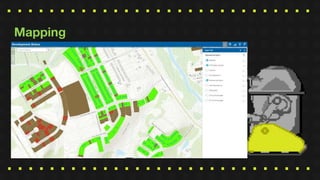
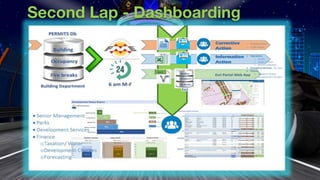
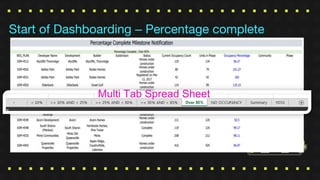
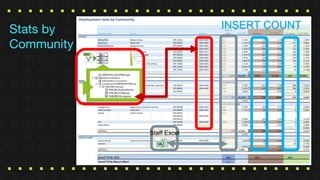
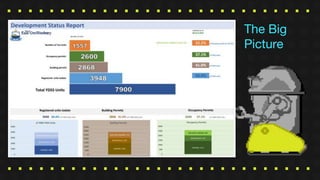


The presentation outlines a growth management and development dashboard aimed at supporting the town's expansion to over 50,000 residents by 2025. It details the need for tracking new developments and managing workflows related to various municipal services, emphasizing the integration of technology, including ESRI software, to improve monitoring and reporting. The presentation highlights ongoing projects, development progress, and the recognition received for excellence in geographic information system (GIS) practices.


