This document provides a strategic business analysis of Delta Airlines. It includes an executive summary that outlines Delta's strengths in customer satisfaction, diversification, and vertical integration through subsidiaries. However, it also notes risks from overdependence on domestic markets and pension obligations. The document then analyzes Delta's financial history and status from 2012-2014 through various financial ratios compared to competitors. It finds that while Delta shows strong performance, macroeconomic factors and pension liabilities could hinder future growth. The analysis concludes Delta should be considered a hold at this time.

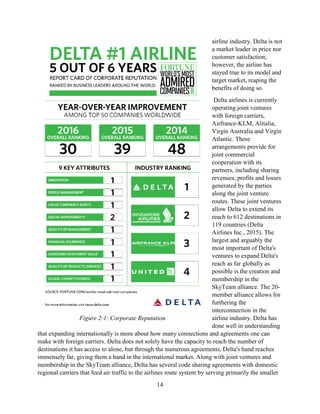
![59
References
About Aeroxchange. (n.d.). Retrieved April 12, 2016, from
http://corp.aeroxchange.com/index.php/about-us
Aeroxchange: Aviation Supply Chain Solutions. (2009, April 9). Retrieved April 12, 2016, from
https://www.aeroxchange.com/aexportal/aex/Delta052009.jsp
Aircraft Fleet. (n.d.). Retrieved April 10, 2016, from
http://www.delta.com/content/www/en_US/about-delta/corporate-information/aircraft-
fleet.html
Airplane Crash Statistics – Statistic Brain. (2016, February 18) (n.d.). Retrieved from
http://www.statisticbrain.com/airplane-crash-statistics
Analysis, A. A. (2016, April 10). Complete Delta Air Lines Analysis. Retrieved April 10, 2016,
from http://www.audriesaircraftanalysis.com/complete-delta-airlines-analysis/
Ausic, P. (n.d.). Delta Buys Used 777 for $7.7 Million, Sinks Boeing Shares. Retrieved April 12,
2016, from http://247wallst.com/aerospace-defense/2015/12/18/delta-buys-used-777-for-
7-7-million-sinks-boeing-shares/
Ball, L. (2015, October 14). Delta’s cargo division continues decline | Air Cargo World.
Retrieved from http://aircargoworld.com/deltas-cargo-division-continues-decline/
Bloomberg. (2016) Bloomberg Professional. [Online]. Available at: Subscription Service
(Accessed: 12 April 2016)
Bryant, A. (1997, March 20). Delta to Buy Only Boeing Jets for 20 Years. Retrieved April 12,
2016, from http://www.nytimes.com/1997/03/21/business/delta-to-buy-only-boeing-jets-
for-20-years.html
Carey, K. E. (2012, June 22). Sale of Trainer refinery complete; Workers back on job Monday
morning. Retrieved April 12, 2016, from
http://www.delcotimes.com/article/DC/20120622/NEWS/306229976
Cederholm, T. (2014, June 17). Welcome to Market Realist. Retrieved April 12, 2016, from
http://marketrealist.com/2014/06/investing-delta-airlines-must-know-company-overview/
Comoreanu, A. (2016, January 20). 2016’s Best Frequent Flyer Program. Retrieved from
http://www.cardhub.com/edu/best-frequent-flyer-program/
Corporate Stats and Facts. (n.d.). Retrieved April 12, 2016, from
http://news.delta.com/corporate-stats-and-facts](https://image.slidesharecdn.com/a2dc310f-c448-4901-ac51-4c23c418ae97-170203195506/85/Strategic-Business-Analysis-59-320.jpg)