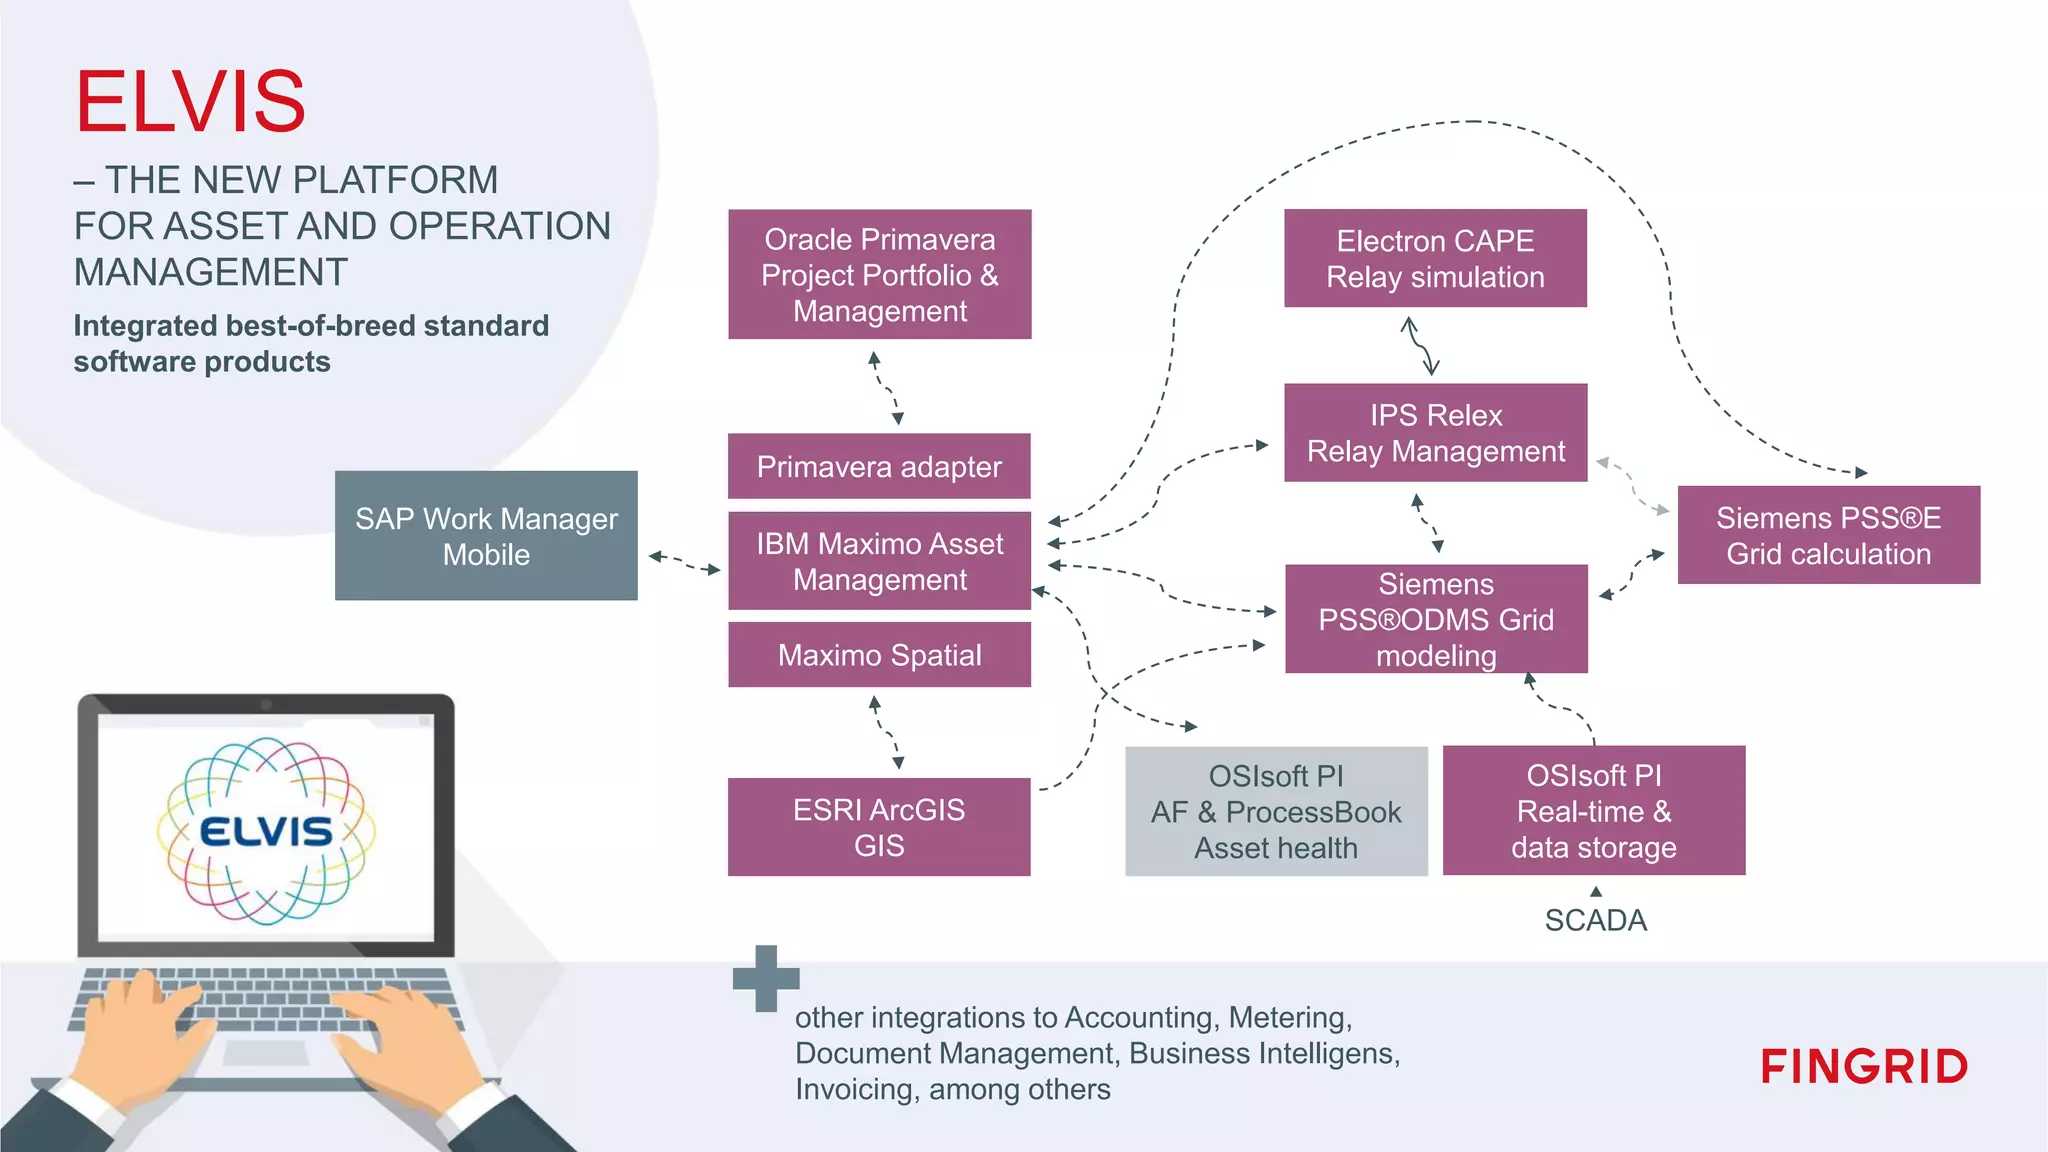
In 2008, Fingrid launched a project, the aim of which was to build a new information system that supported asset and operation management and was based on product-based solutions. This new data system that supports asset and operation management goes by the name of ELVIS (an acronym for ELectricity Verkko Information System).
2. Alerts
Count Time Substation Description
1 03.09.16 HJ Fault
1 03.09.16 AF Lower limit
1 03.09.16 AF Status change
3 03.09.16 YK Alarm
2 03.09.16 DF Alarm
.. .. .. ..
Situation awareness
13.9.2016Antti Harjula2
OR
3. Bridging the gap between
planning, operations and
asset management
• Integration of grid model between very
different processes and software
• Integrated grid calculations helping with
decision making
13.9.2016Antti Harjula3
4. SAP Work Manager
Mobile
Oracle Primavera
Project Portfolio &
Management
Primavera adapter
Maximo Spatial
IBM Maximo Asset
Management
ESRI ArcGIS
GIS
Electron CAPE
Relay simulation
IPS Relex
Relay Management
Siemens
PSS®ODMS Grid
modeling
Siemens PSS®E
Grid calculation
OSIsoft PI
AF & ProcessBook
Asset health
OSIsoft PI
Real-time &
data storage
other integrations to Accounting, Metering,
Document Management, Business Intelligens,
Invoicing, among others
SCADA
ELVIS
– THE NEW PLATFORM
FOR ASSET AND OPERATION
MANAGEMENT
Integrated best-of-breed standard
software products
6. Critical Points of Integration
Maximo ArcGIS ODMS
Unversioned
hierarchical
model of logical
locations and
physical assets
Versioned
geospatial
representation of
grid elements,
master of grid
connectivity
Versioned grid
model of grid
connectivity and
electrical
characteristics
13.9.2016Antti Harjula6
7. SAP
Work Management
Mobile
Oracle Primavera
Project Portfolio &
Management
Primavera adapter
Maximo Spatial
IBM Maximo Asset
Management
ESRI ArcGIS
GIS
Electron CAPE
Relay simulation
IPS Relex
Relay Management
Siemens PSS®ODMS
Grid modeling
Siemens PSS®E
Grid calculation
OSIsoft PI AF &
ProcessBook
Asset health
OSIsoft PI AF &
Real-time &
data storage
SCADA
ELVIS
– THE NEW PLATFORM
FOR ASSET AND OPERATION
MANAGEMENT
Integrated best-of-breed standard
software products
CIM Footprint
Maping
required
CIM
(adaption)
CIM
(adaption)
CIM
CIM
CIM
CIM + n/a
Grid model to
ENTSO-ECIM
n/a
n/a
n/a
n/a
n/a CIM
CIM16 is widely adapted, where applicable. At the same
time, the nature of the individual component were
respected.
13. Simulation grid model maintenance in Fingrid
Enterprise grid model management
(ODMS CIM database)
- present grid
- projects and scenarios
- load-, generation-, and voltage profiles
- rating profiles
- links to measurementsGeographical
information system
and asset topology
(ArcGIS)
Asset information and
hierarchy, project
schedules, outages
(Maximo)
Protection planning
(CAPE/IPS)
Long term system
planning
(PSSE)
Operations planning
(ODMS/PSSE)Measurement and
status information, grid
model, EMS
(EMS and PI)
Energy
measurements from
connection points
(LTJ)
Grid topology and values from
other TSO:s & NSO:s
System analysis
(PSSE/CAPE/ Maximo)
Fault location
calculation
(PSSE/Maximo)
Operations
(XA)
13.9.2016Antti Harjula13
Protection planning
(CAPE/IPS)
Long term system
planning
(PSSE)
Operations planning
(ODMS/PSSE)
System analysis
(PSSE/CAPE/ Maximo)
Fault location
calculation
(PSSE/Maximo)
Operations
(EMS)
19. Summary
• Integration of software designed for very different processes is beneficial and possible
• Grid calculations integration improves risk management, situation awareness and asset
utilization
13.9.2016Antti Harjula19
Name and what I have done in the project
Achieved, feedback and synergy in development on the same interfaces,
challenges it's possible to fully integrate IT processes of asset management, long term planning, operational planning, protection
This might seem very specific to Electricity TSO world, but there are plenty of learning points for other industries as well:
big data, placing everything on location, master data, standards
You are probably well saturated with information and looking forward to dinner, but before that I want you to focus on one important topic that probably.
- situation awarness and making decisions
For example in Control center tha normal view to the situation in the grid is a schematic diagram with flows and alerts in separate table format with diffent colour coding.
Heat map
Not only the vsualization, but the most important thing which is that
- decisions are made based on the correct (common information) independent on if we are talking about safety, reliability or money
Not talking about how we do planning, but
Grid model, CIM based integration
long term planning, asset maintenance, operational planning, protection
grid services = schematics that show the connecting customers
grid operator in the control centre = scada view with real time measurements and all the primary equipment
long term planning = schematics with just one bus representing a voltage level at substation
protection = the current transformers and secondary equipment connected
why to integrate:
less mistakes in manual copy
motivation
benefits in drilling in to information and background, knowledge of where the information is used. That it is IMPORTANT to keep things up to date.
The GIS Powergrid model is a CIM adaption, but must still first and foremost serve as a GIS network model. By contrast, ODMS is a pure CIM-based system.
Thus, mapping of the connectivity model is a necessity. Particular complex details include:
Mapping of switches from a point feature into a two-terminal device.
The necessity of creating abstract elements (Terminals and some ConnectivityNodes) out of a more crude model.
Planning GIS and ODMS
Maintenance Maximo and GIS
Operations Maximo and ODMS
ODMS functions as the bridge between the node/breaker operational model and the bus/branch planning model.
The mapping is bi-directional. The backwards mapping is used to represent calculation results in ArcGIS and Maximo.
henri and antti
It's possible to do manually, but with integration you know that the results that you use for decision making are based on the master data.
Examples of integrated calculations in ELVIS
before done in excel and results were
Analysis based on
Asset data and measurements (Maximo)
CIM grid model (ODMS)
Relay Actions on fault (trip time) at each tower (CAPE)
Results available on map at each tower (Maximo Spatial)
Asset data (Maximo)
Topology of primary equipment (ODMS)
Realtime measurements(PI)
Temperature dependent ratings
(Maximo)
Common grid model which is synchronized with asset management, operations planning, long term planning and network protection analysis
All switch gear modeled with real and accurate description of components in the grid. Lot's of additional information about the grid model.
Accurate planning grid model linked to real time status and metering data.
Preparing of calculation model is easy by using status and metering data from the past
Attributes for grid components available through the map
Visualization of real time power and voltage measurements using colours on grid model or map
Common database about future projects where schedules are in sync through the systems
Easy to build different scenarios
- How do you handle possible issues with data quality at the source of data?
- good communications between linked processes, error checking scripts, interface error handling, out of box data quality checking
- Have you faced challenges with using CIM grid model database instead of the previous taylor made grid model database?
- CIM presents the grid in a format that no-one has been used to so most important is changge management and focusing on the benefits. Still I do hope to see development in thee programs for better visualisation of data for example transformer electrical values shown in a "normal" nameplate format with per unit values instead of the SI standards format.