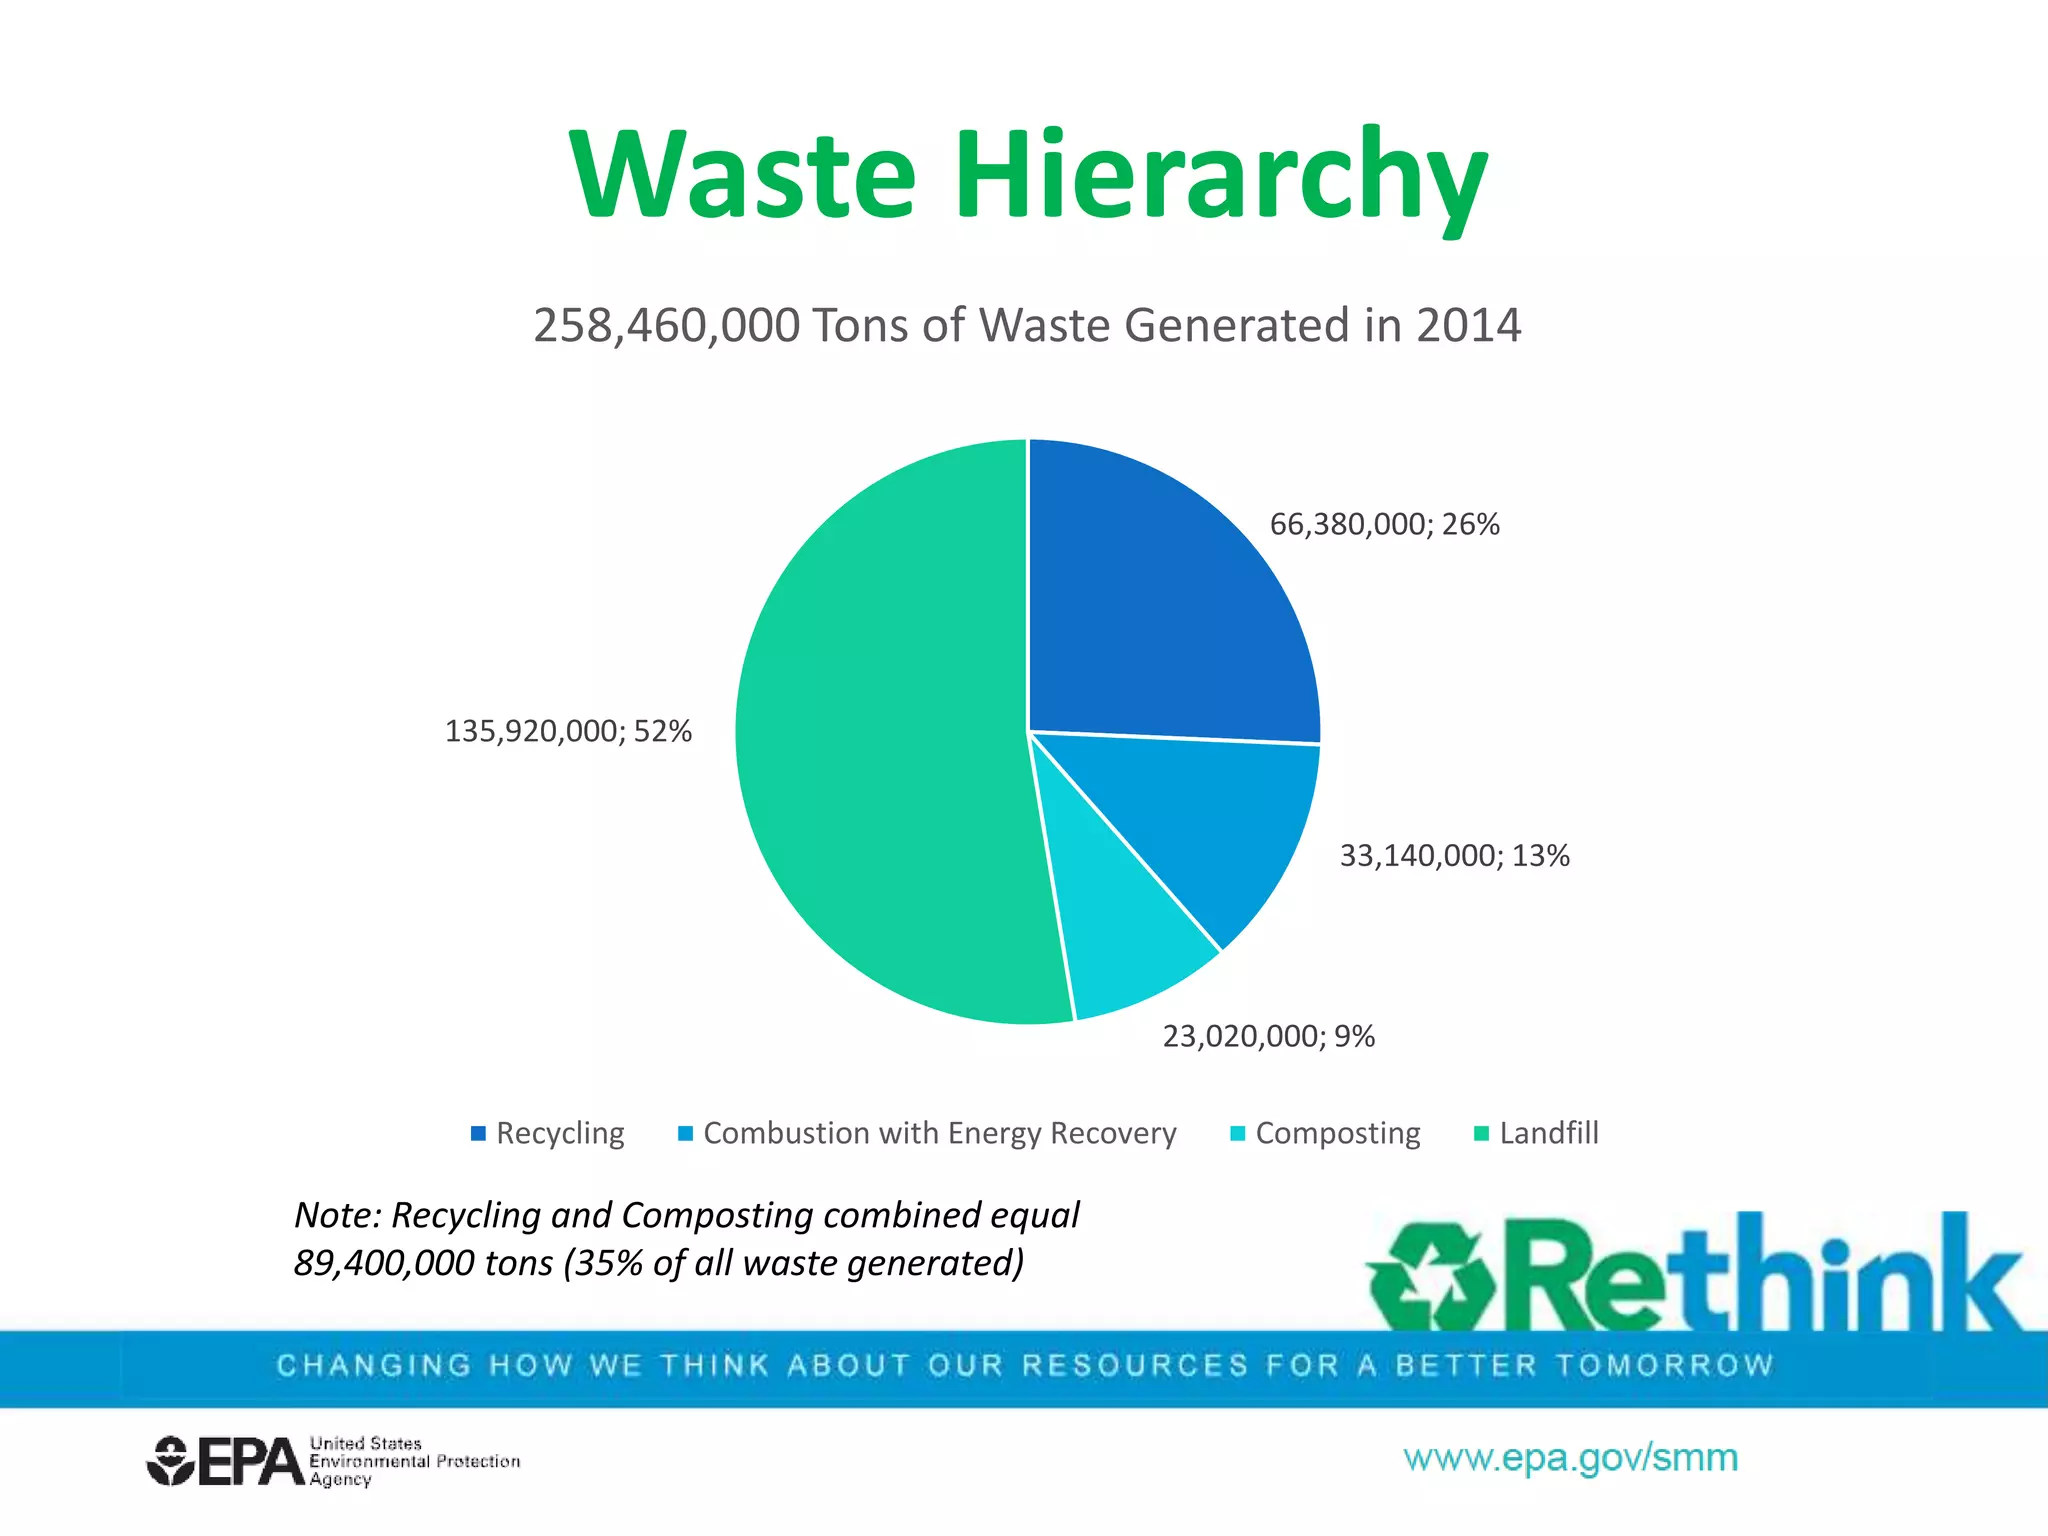
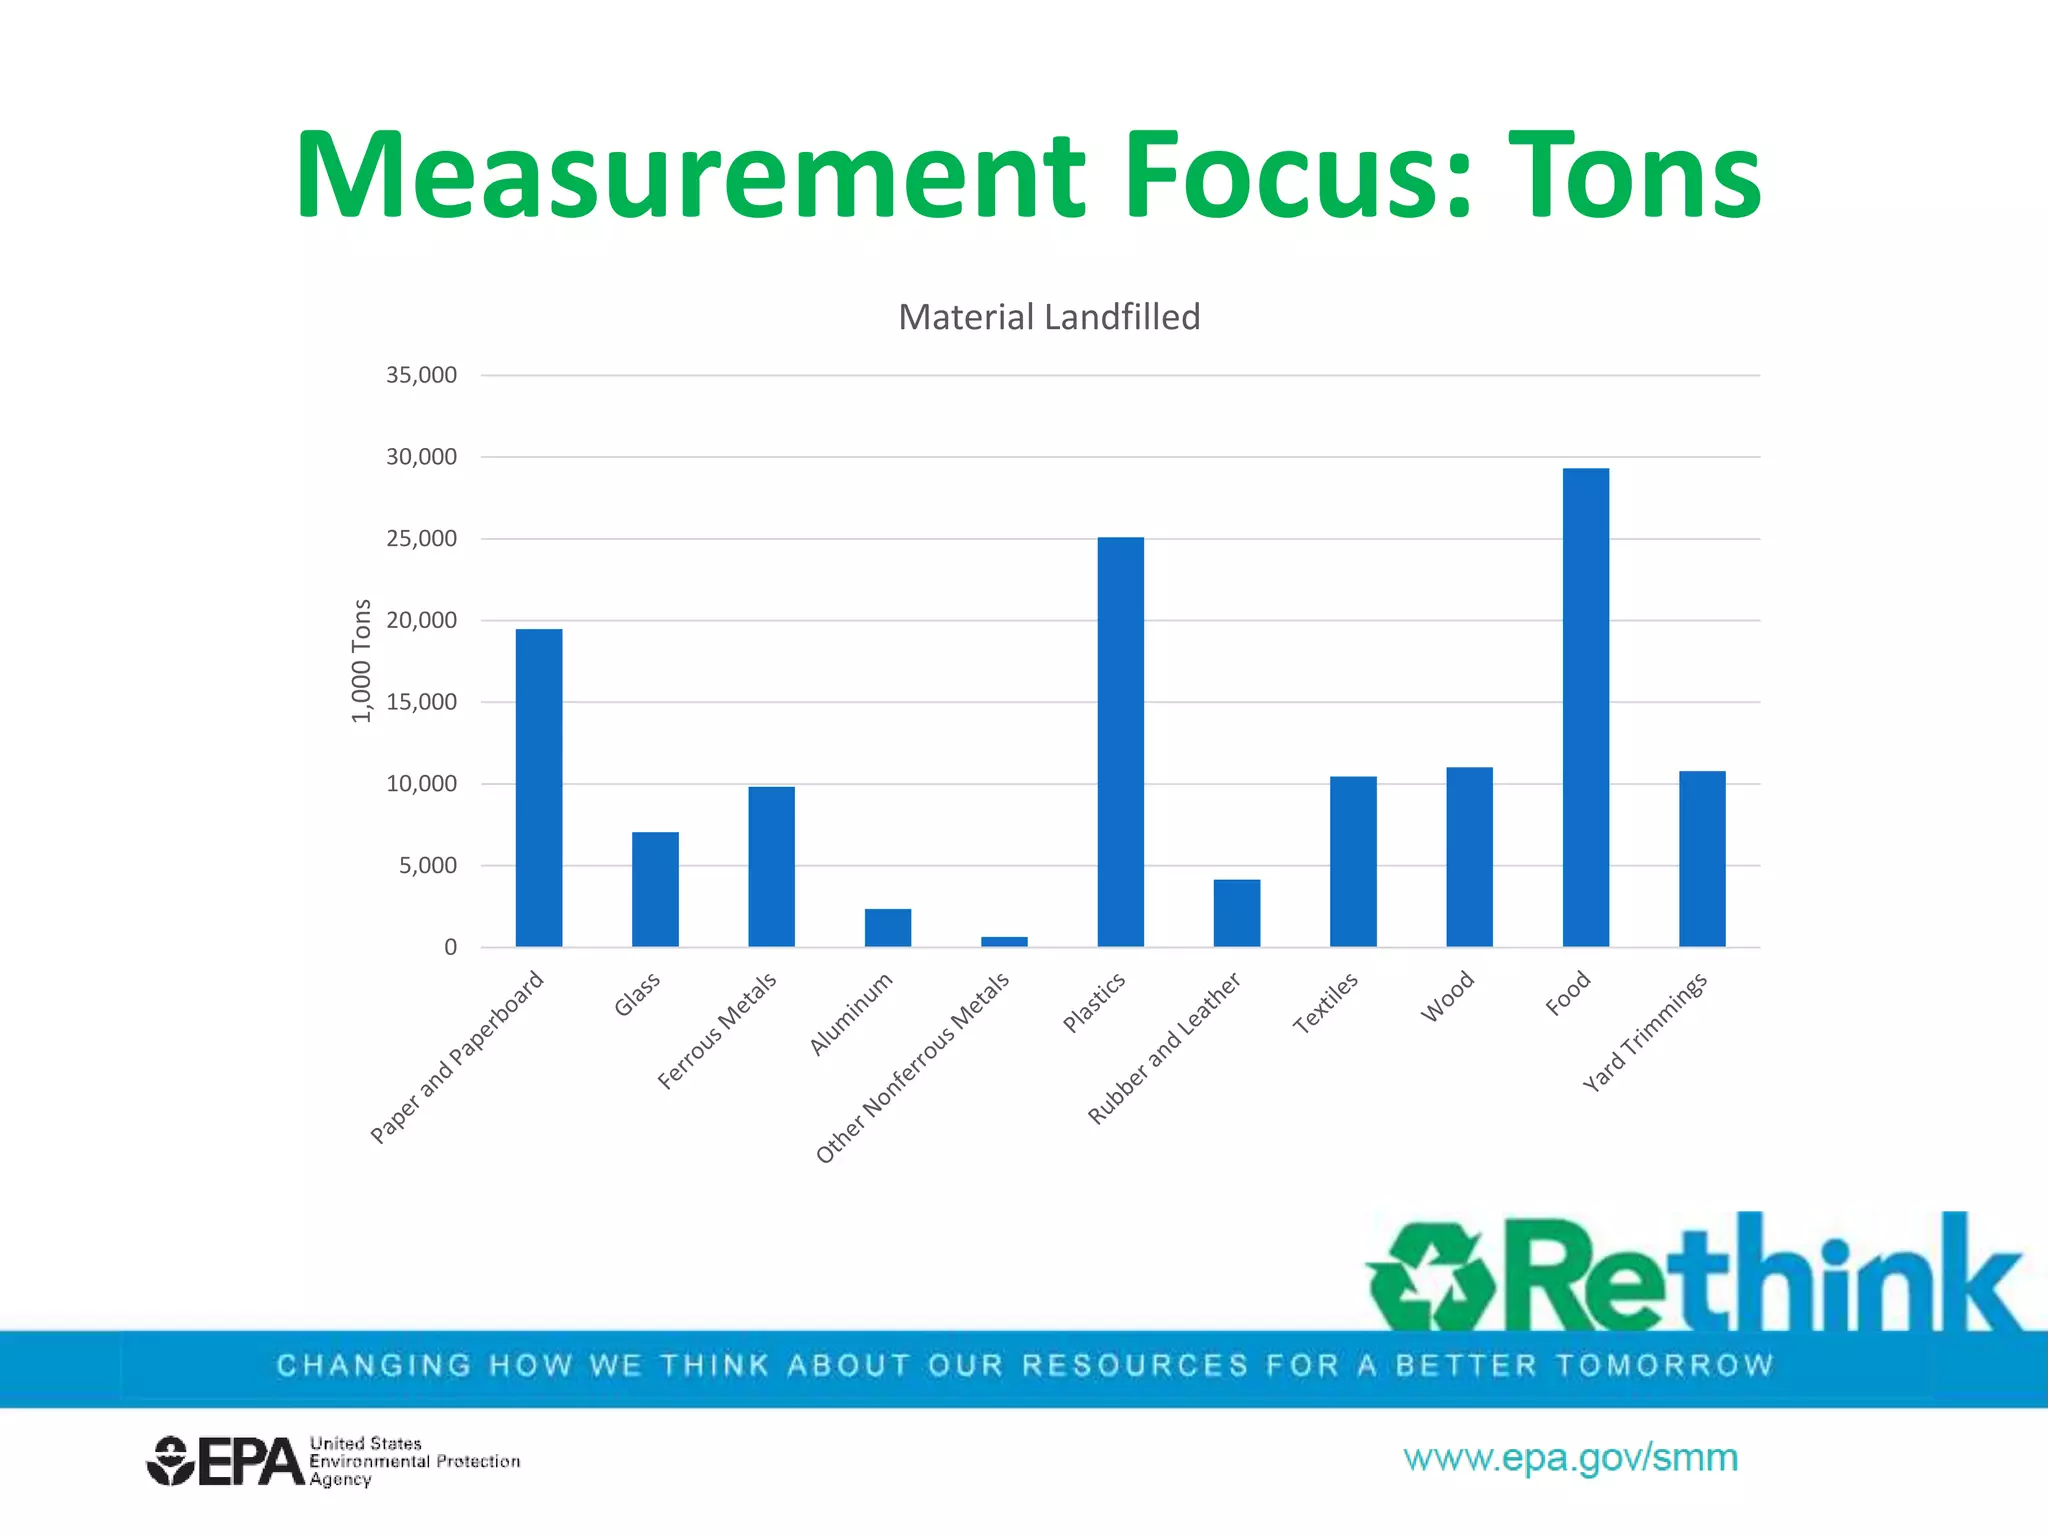
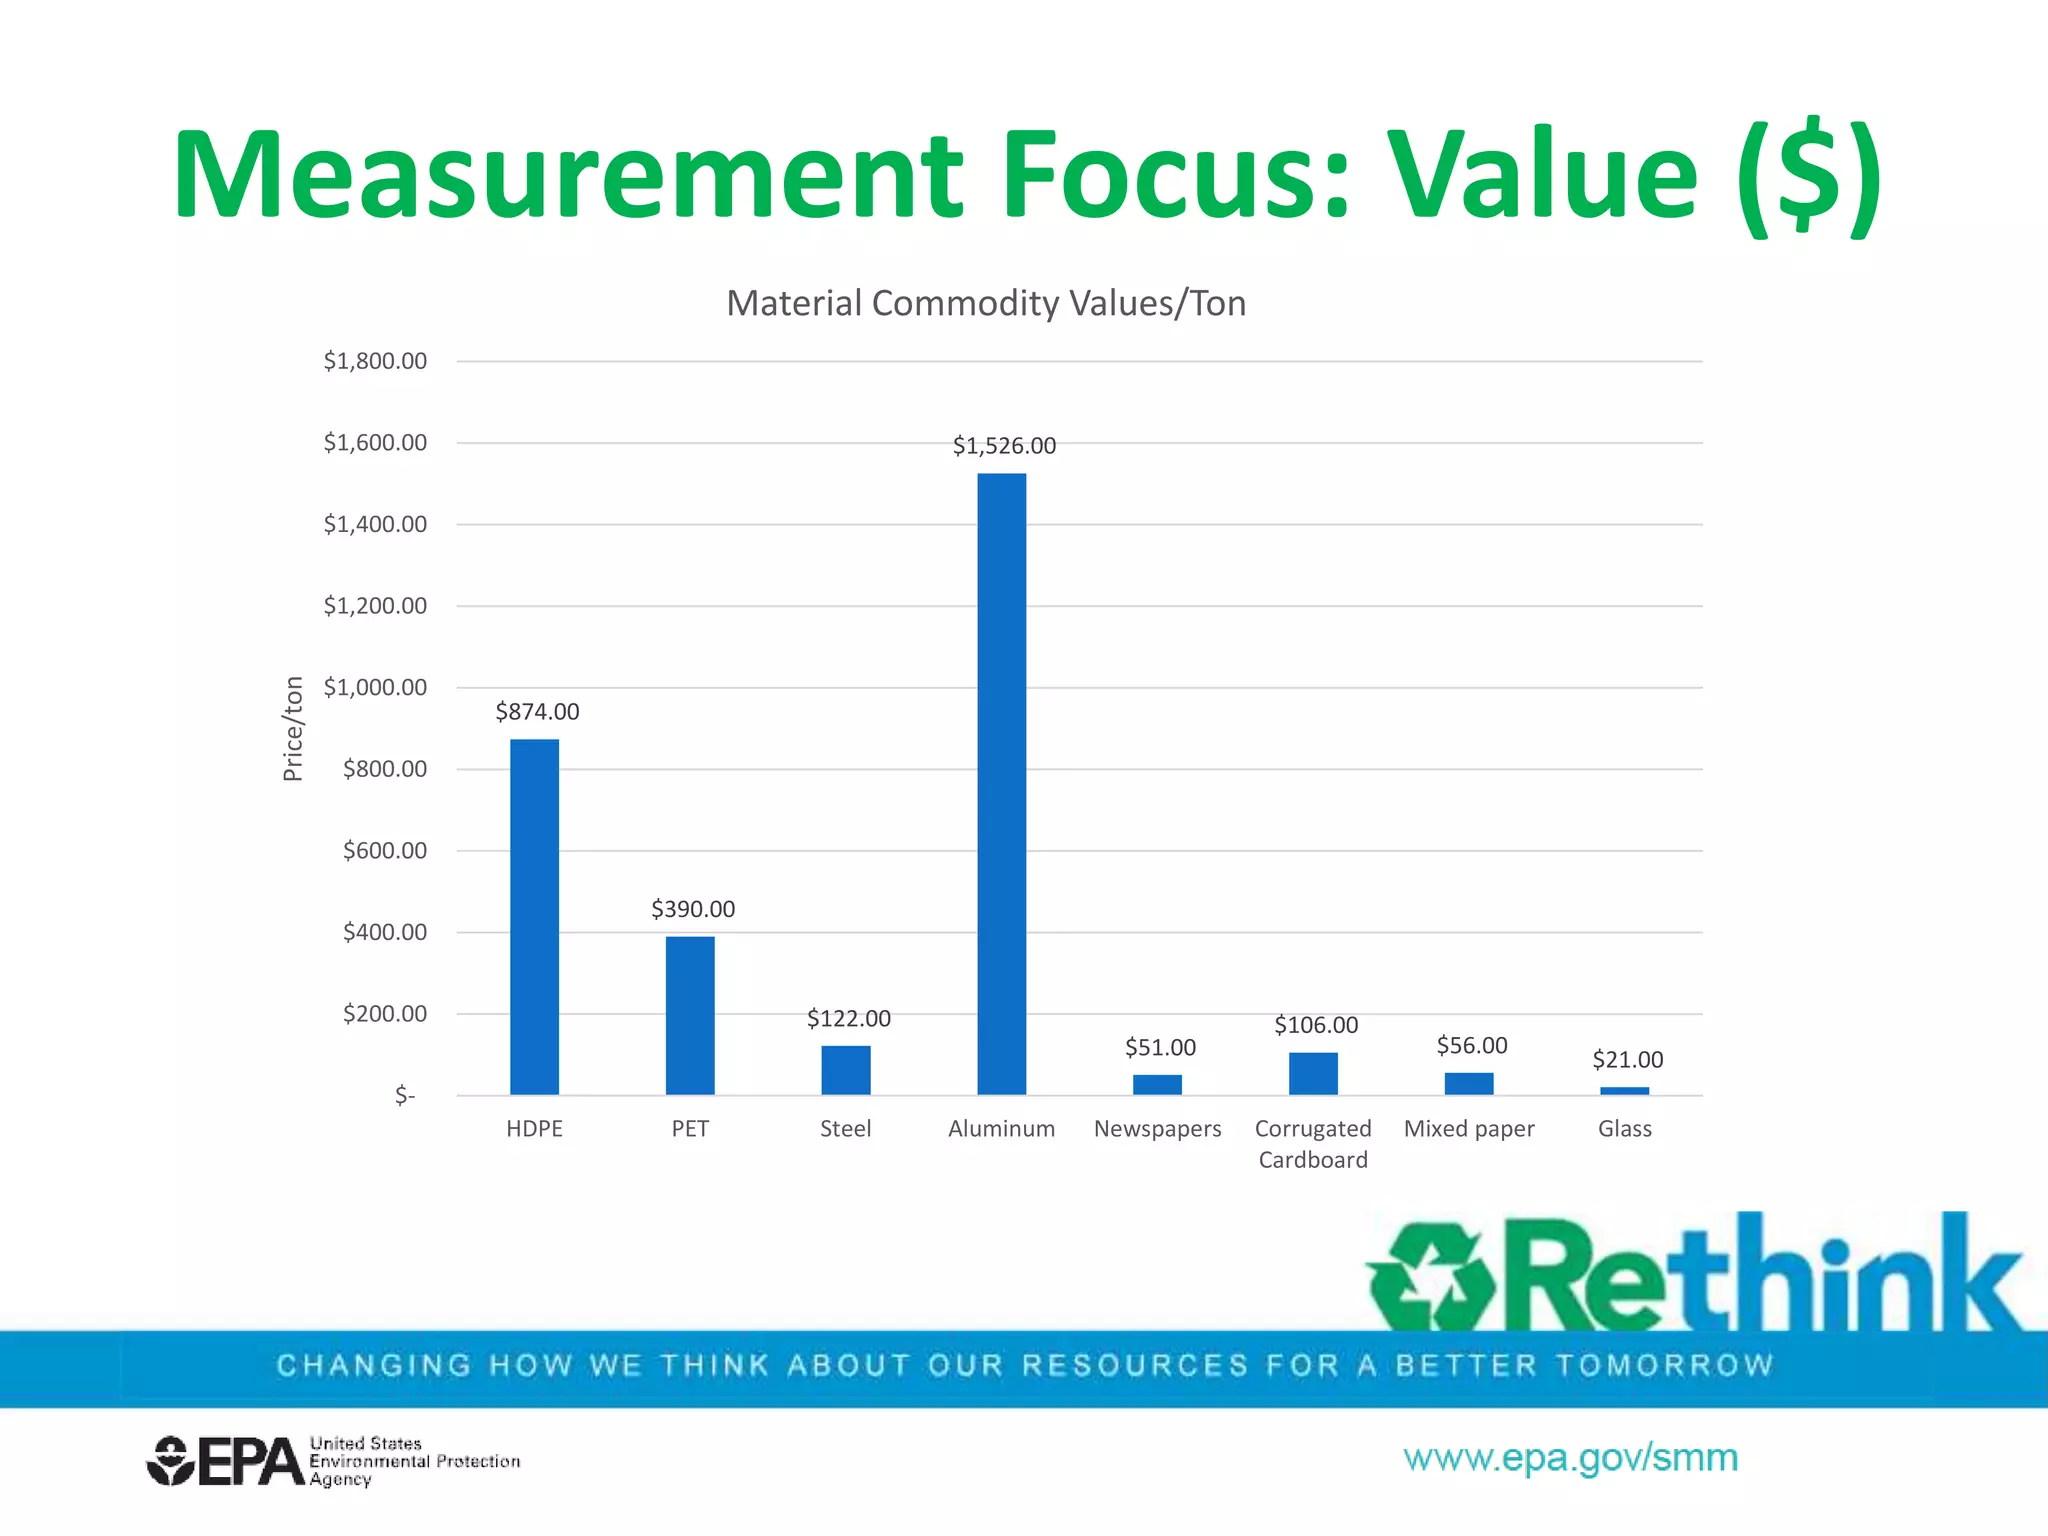
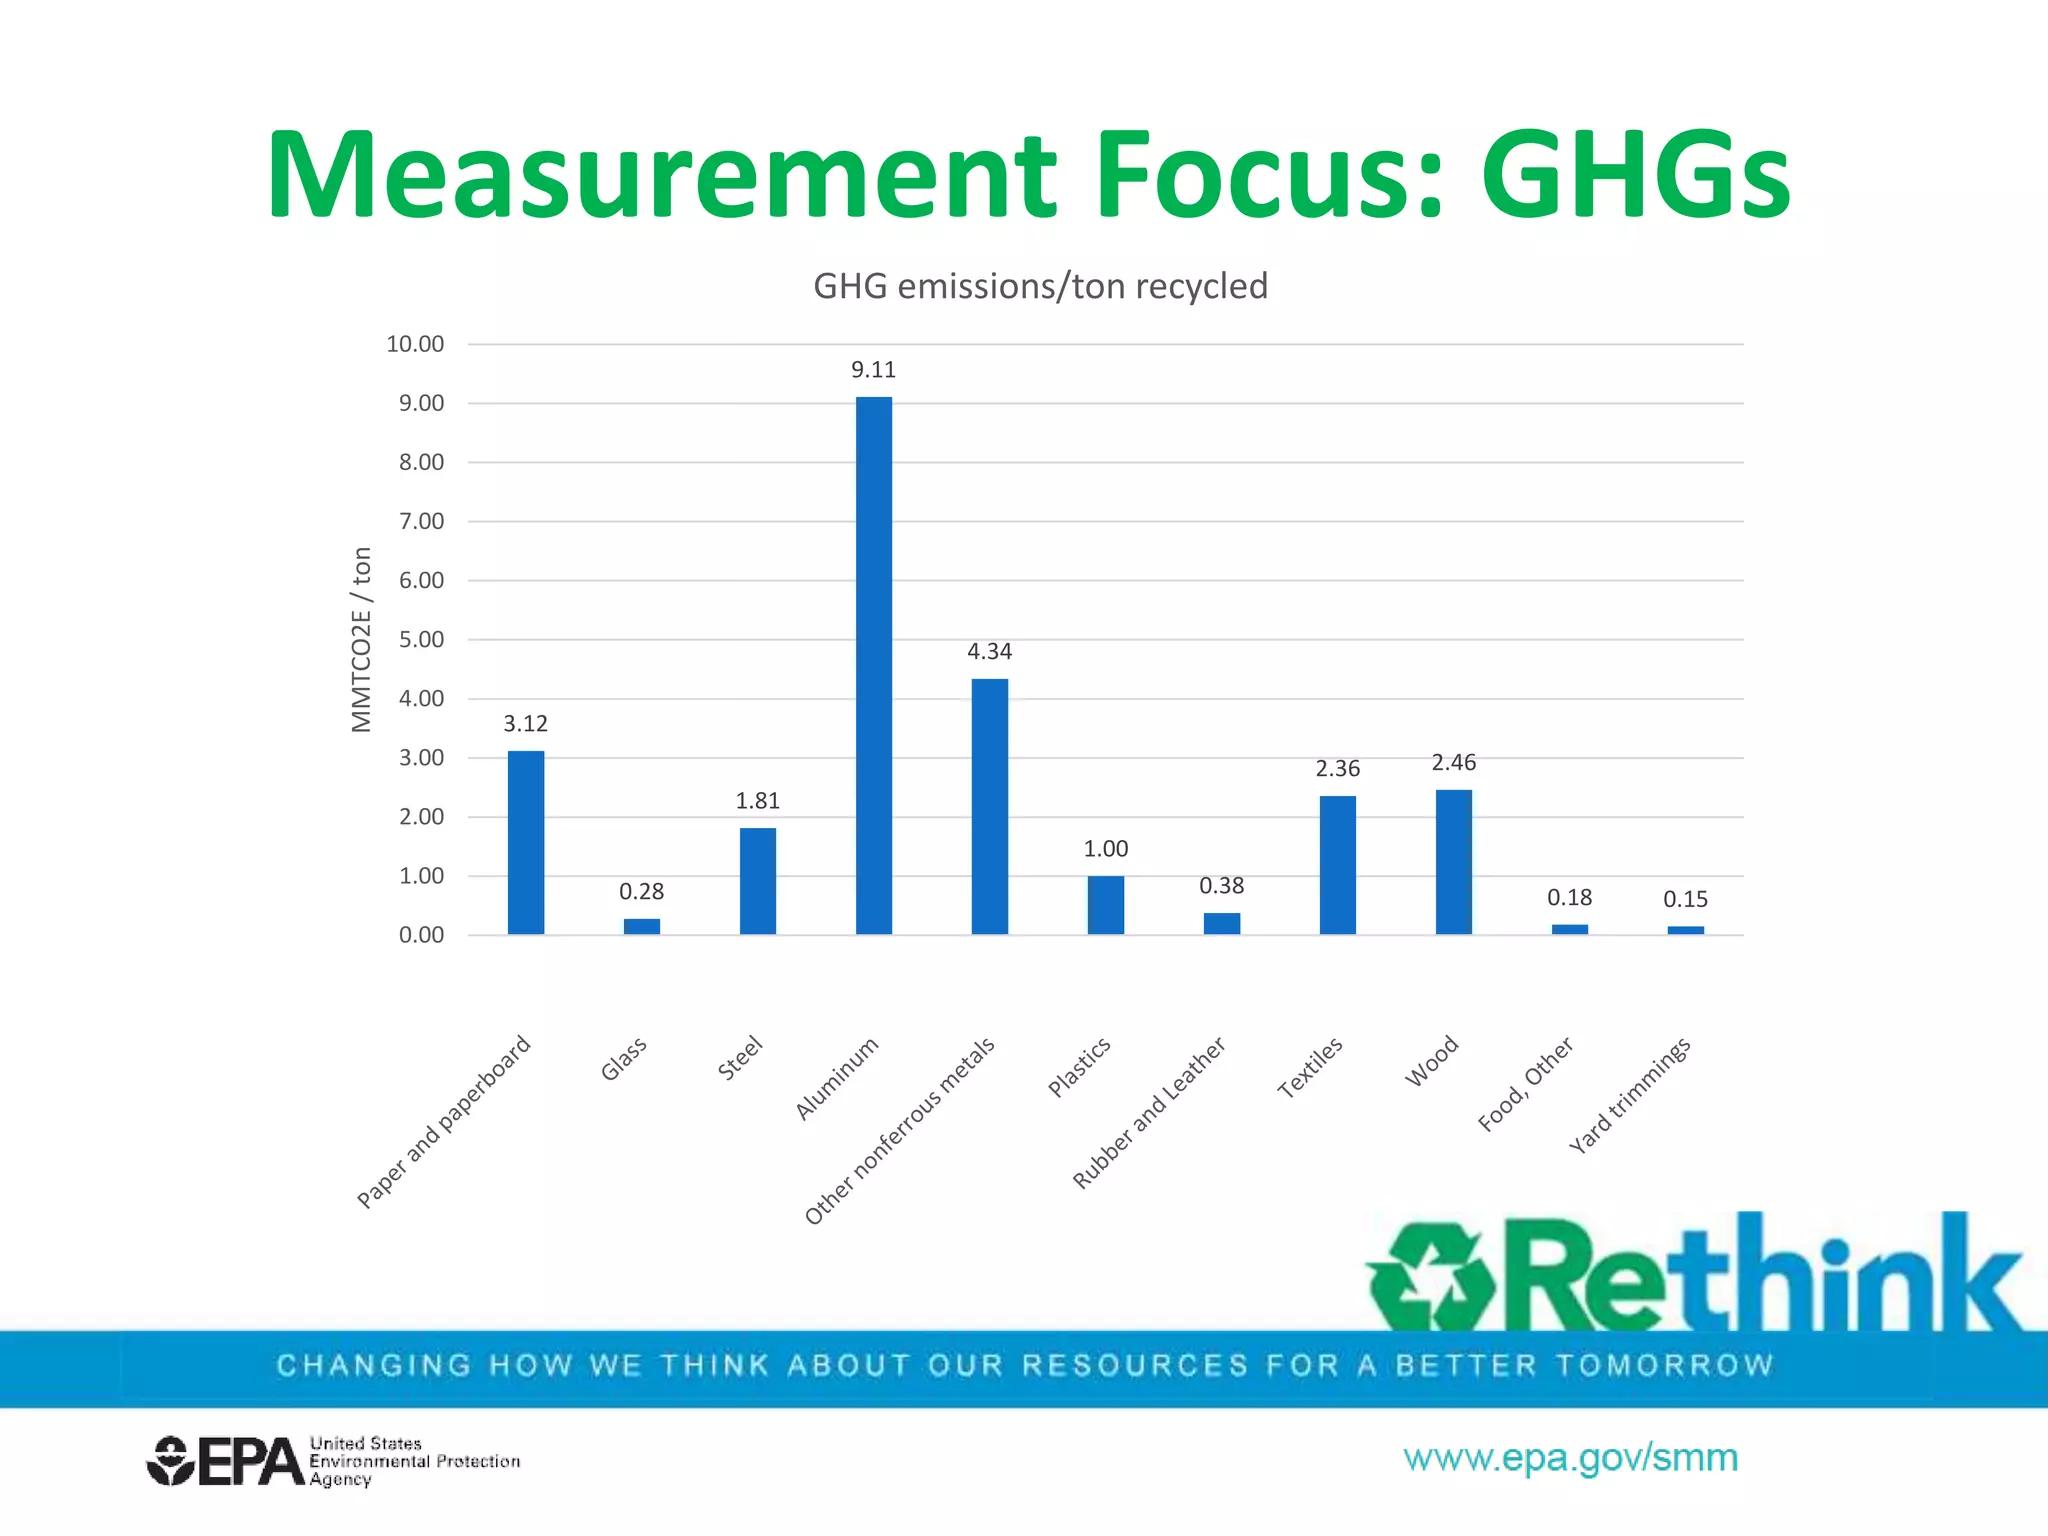
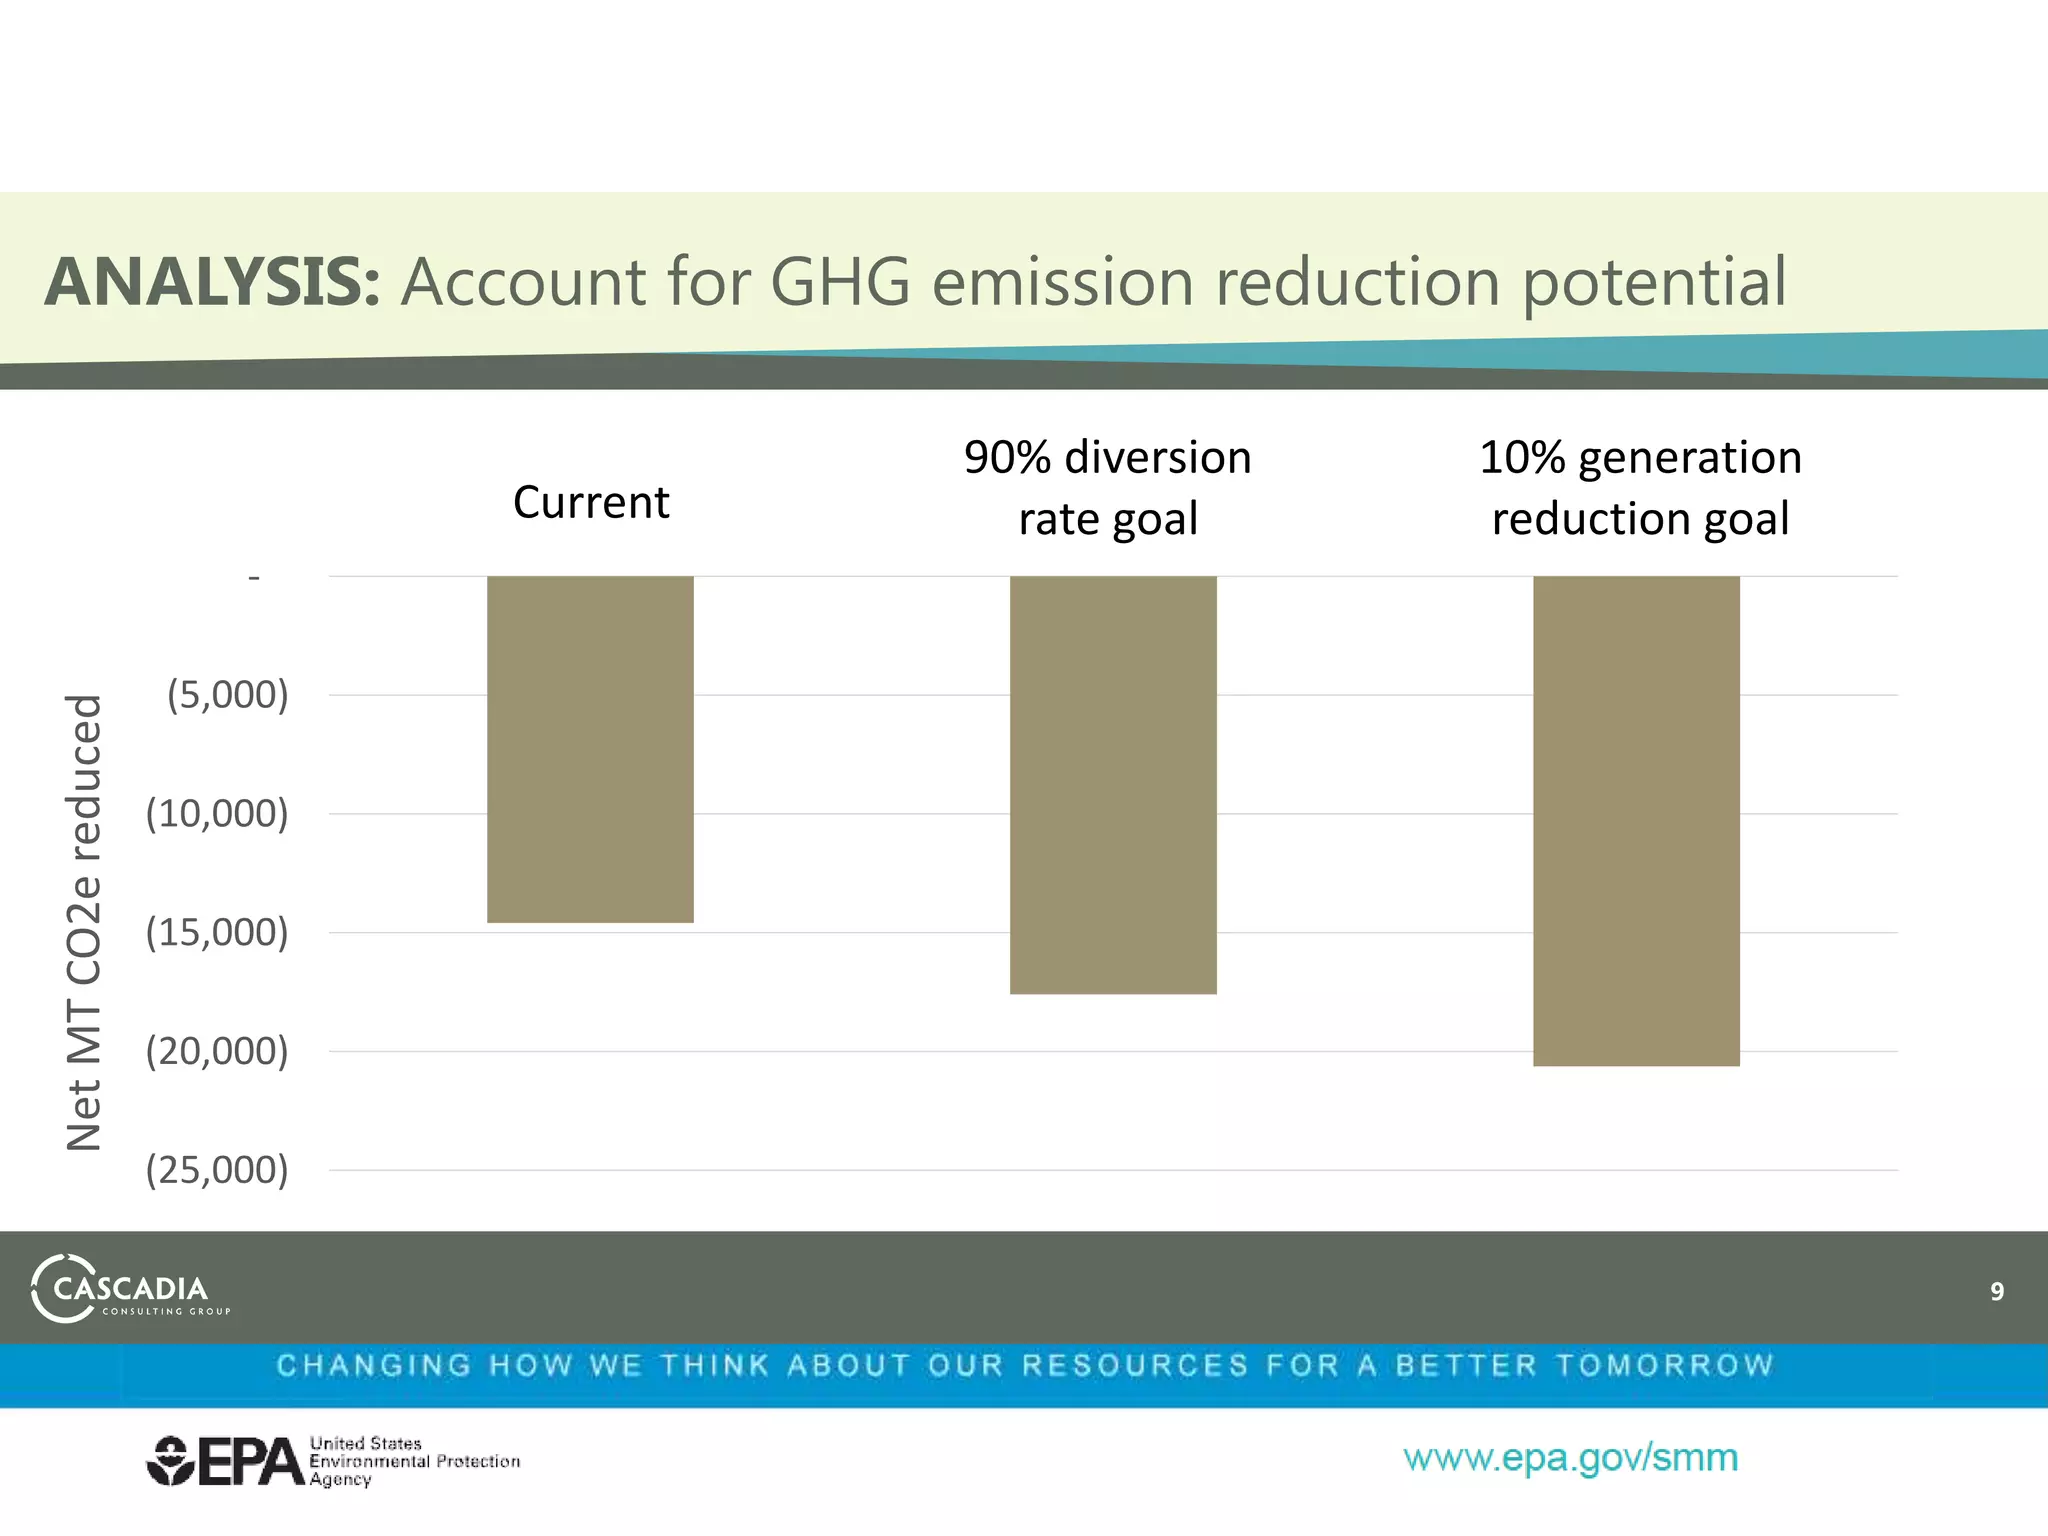
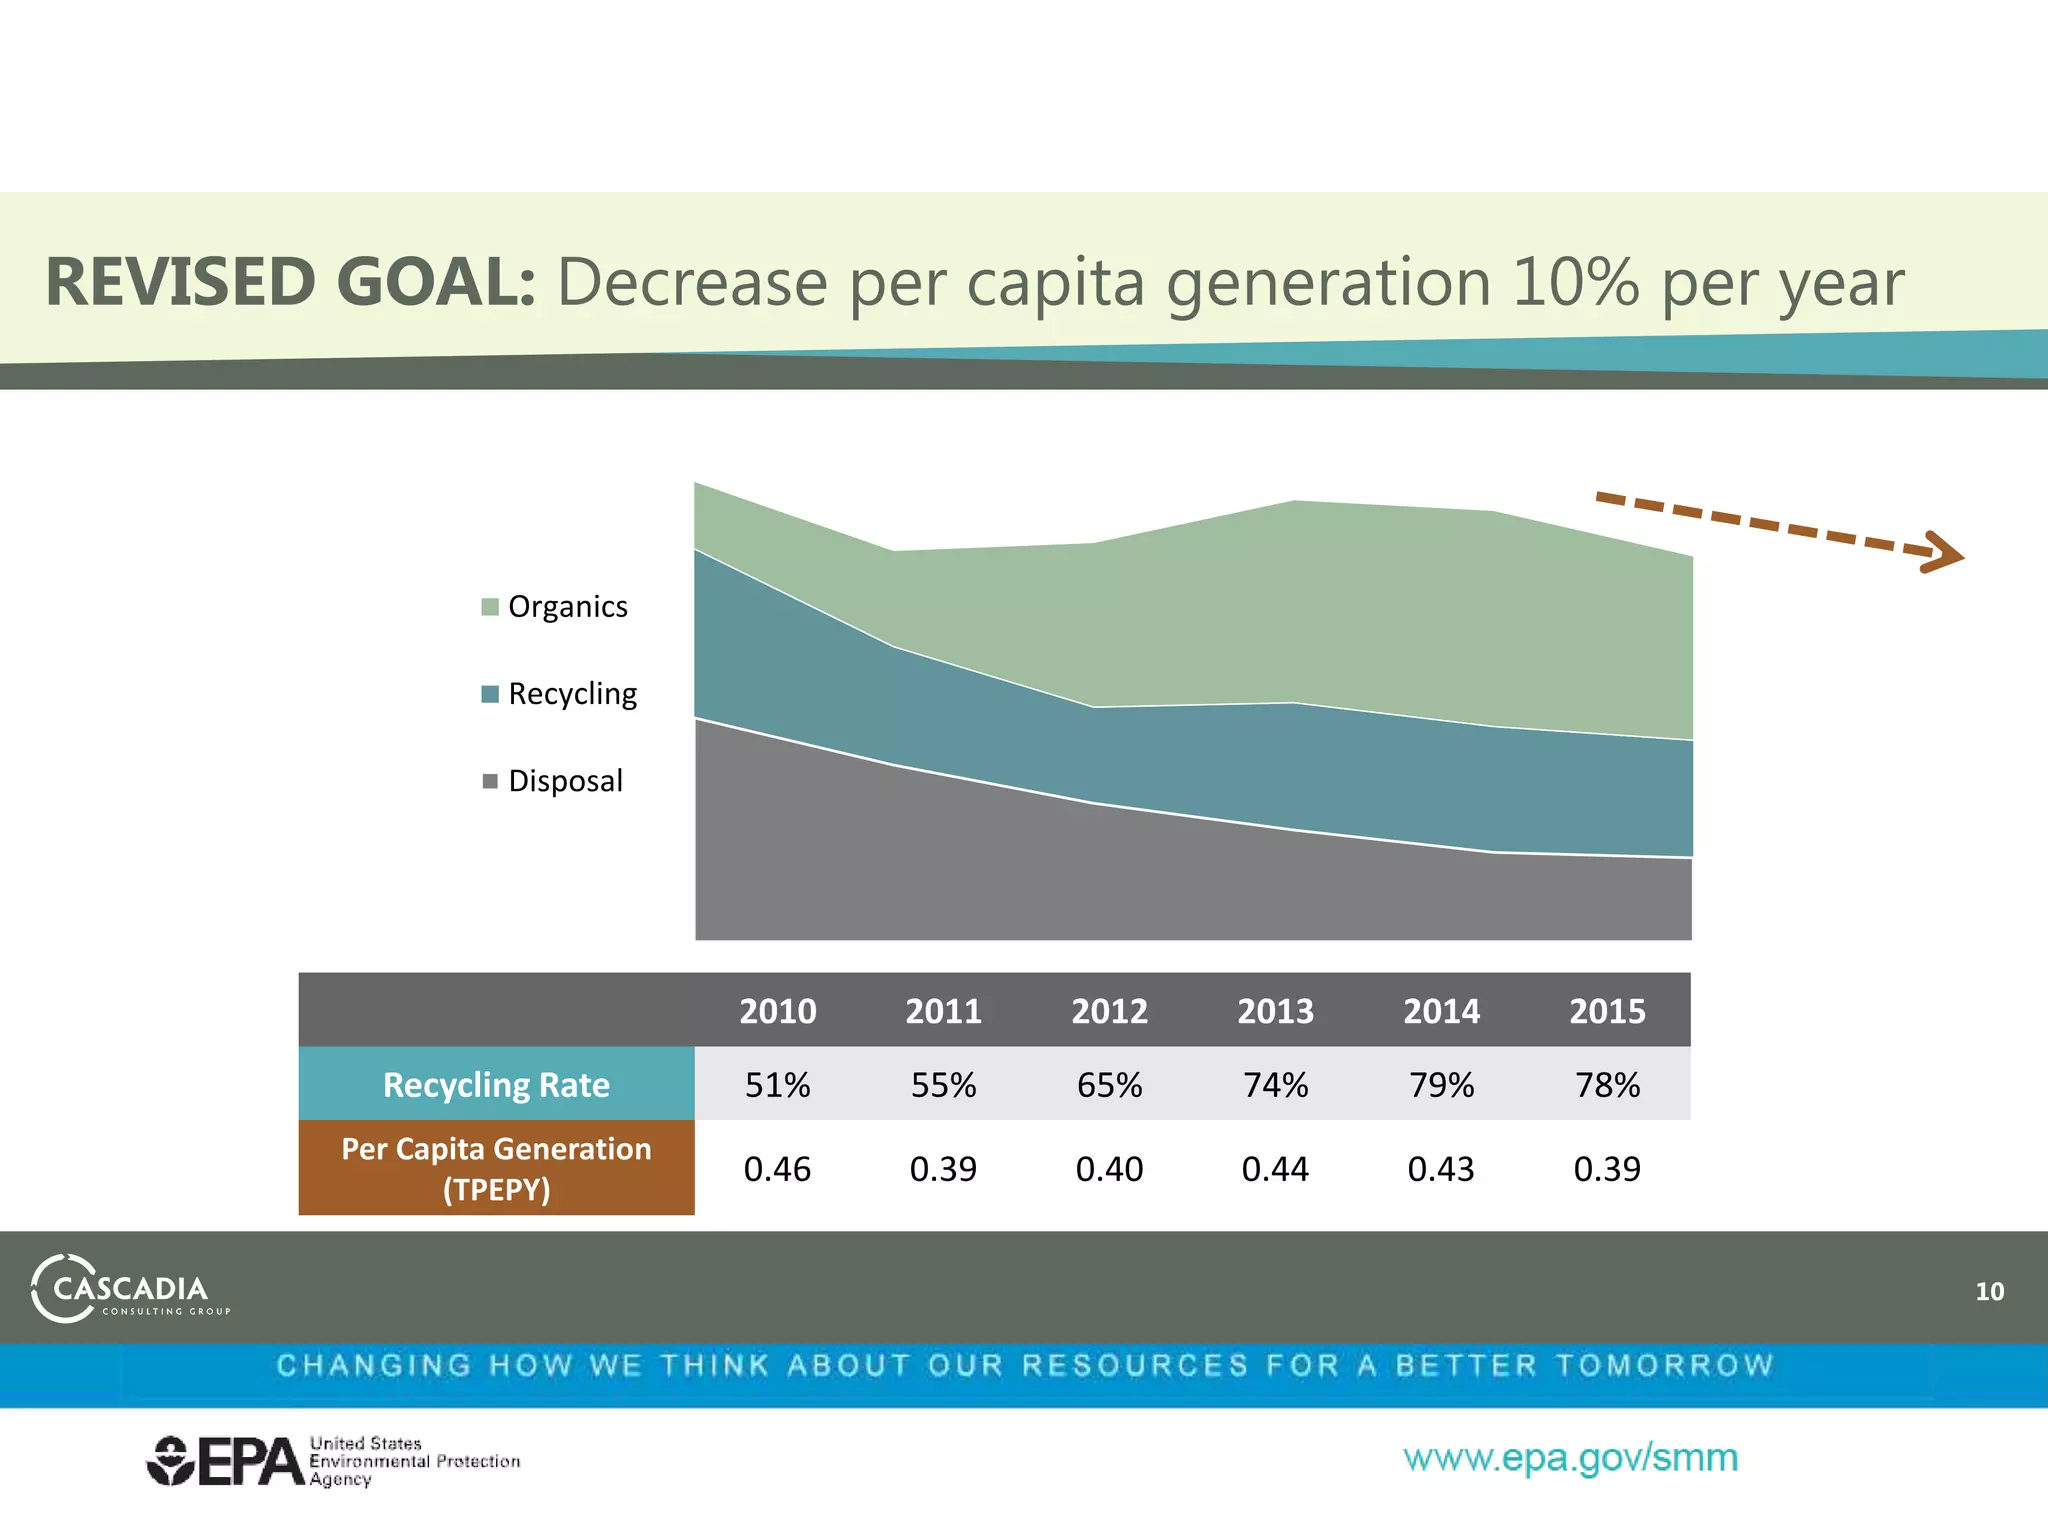
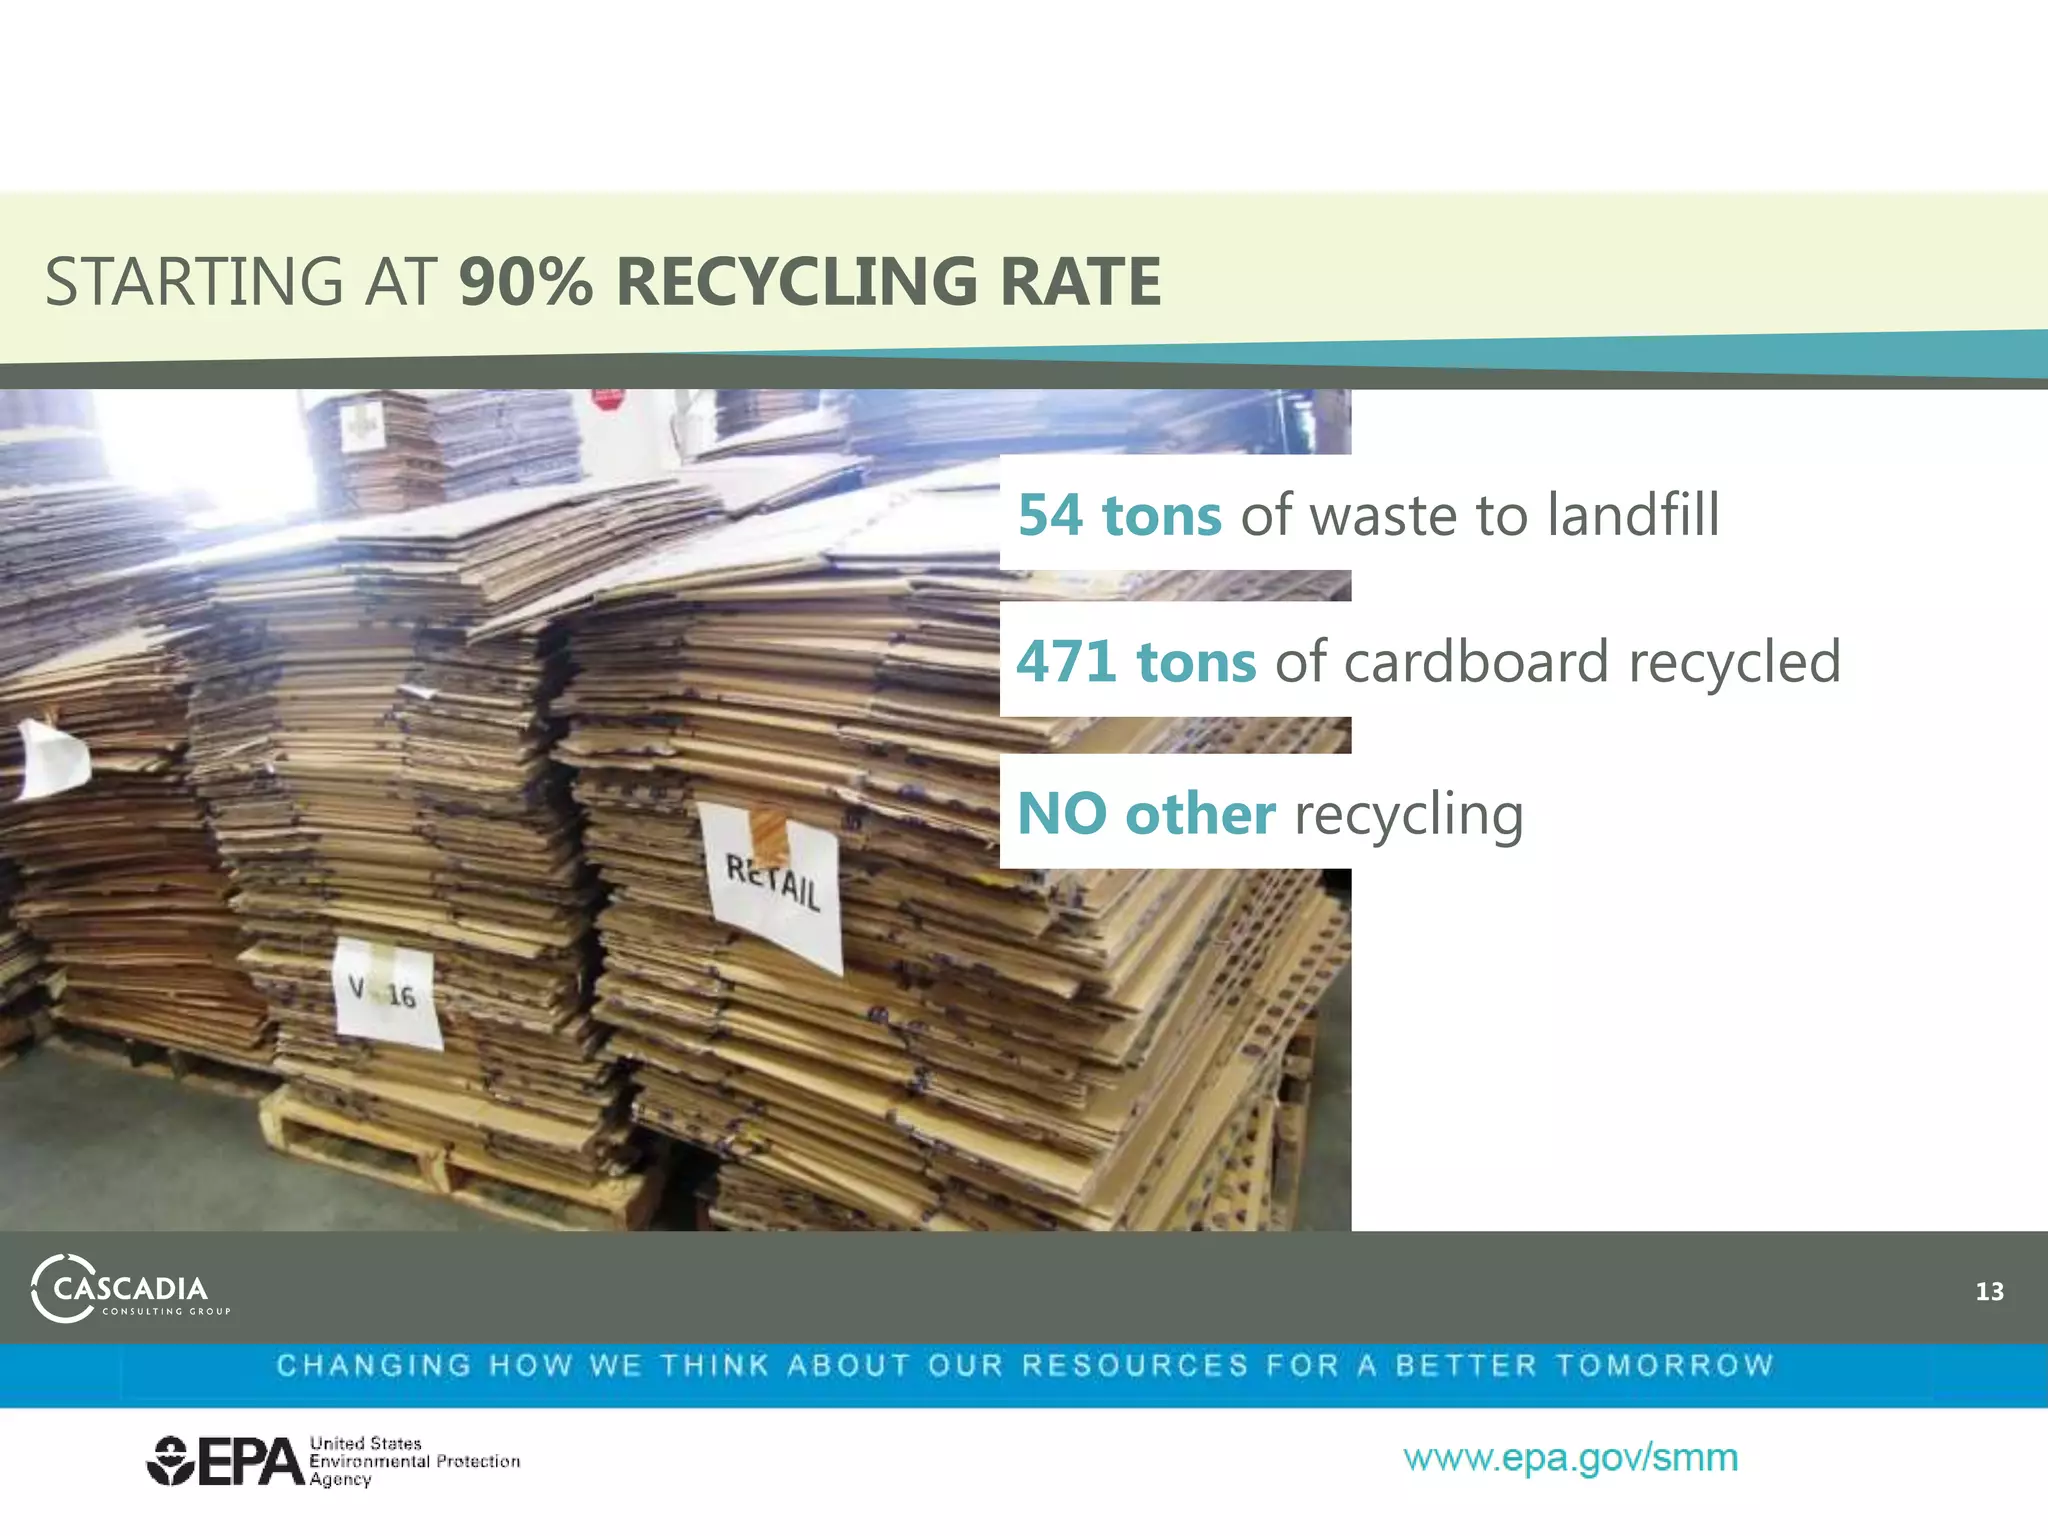
Measuring Materials
Management
Ron Vance
Chief
Resource Conservation Branch
U.S. Environmental Protection Agency
Evolution of Philosophy
Waste Management
Recycling
Integrated Waste Management
Sustainable Materials Management
2
While philosophy has evolved, our goals have not
Recycling Rate = 35%
3
Goals
Measuring SMM
Rank Goods & Services
HHCan
HHNonCan
HHResp
EcoTox
GWrm
OzDepl
Smog
Acid
Eutro
Energy
Land
Water
Matl
Waste
RankValue
1 Electric power generation,transmis... 6.9 3.0 14.3 1.3 15.1 <1 11.7 15.8 1.2 12.8 <1 14.4 2.0 1.5 35.4
2 Residential permanentsitesingle- ... 3.7 3.7 3.5 2.2 3.1 2.0 4.6 2.3 <1 4.1 5.9 1.6 16.1 9.2 22.0
3 Animal (exceptpoultry) slaughterin... <1 <1 2.8 <1 2.3 <1 1.1 3.9 4.3 1.1 15.4 3.2 <1 7.6 18.8
4 Poultry processing <1 <1 <1 <1 <1 <1 <1 1.6 16.2 <1 1.3 1.1 <1 3.7 16.8
5 Wastemanagementand remediation se... 6.0 6.6 <1 12.2 <1 <1 <1 <1 <1 <1 <1 <1 <1 <1 15.2
6 Greenhouse,nursery,and floricultu... <1 <1 3.3 <1 <1 14.1 <1 <1 <1 <1 <1 <1 <1 <1 14.5
7 Food services and drinkingplaces 3.9 3.3 3.2 3.1 3.4 2.1 2.8 3.1 3.9 3.8 4.0 5.6 1.0 6.7 14.2
8 Lighttruck and utility vehicleman... 5.9 9.6 1.2 5.0 2.1 3.1 1.9 1.2 <1 1.7 <1 <1 <1 2.6 13.5
9 Retail trade 4.4 4.5 3.4 4.7 3.9 3.2 3.8 3.3 1.6 4.9 1.7 3.4 <1 3.7 13.4
10 Truck transportation <1 <1 1.3 <1 <1 <1 8.9 3.0 <1 2.9 <1 <1 <1 <1 9.9
U.S. Top Ten Most Impactful Goods and Services
4
Goal is set at one tier –
Recycling
What about:
• Generation
• Landfilling (Zero
Waste)
5
Waste Hierarchy
6
Waste Hierarchy
66,380,000; 26%
33,140,000; 13%
23,020,000; 9%
135,920,000; 52%
258,460,000 Tons of Waste Generated in 2014
Recycling Combustion with Energy Recovery Composting Landfill
Note: Recycling and Composting combined equal
89,400,000 tons (35% of all waste generated)
7
Waste Hierarchy
8
Material vs Product
Glass Packaging ,
2,990,000 , 3% Steel Packaging,
1,580,000 , 2% Aluminum
Packaging,
700,000 , 1%
Corrugated Boxes
, 27,280,000 , 31%
Other Paper and
Paperboard
Packaging,
2,210,000 , 2%
Plastics Packaging,
2,120,000 , 2%
Wood packaging,
2,570,000 , 3%
Durable Goods,
9,750,000 , 11%
Newspapers ,
5,200,000 , 6%
Other Paper
Nondurable
Goods, 9,710,000
, 11%
Clothing and
Footwear,
1,900,000 , 2%
Towels, Sheets
and Pillowcases,
230,000 , 0%
Other Misc.
Nondurables,
140,000 , 0%
Food,
1,940,000 , 2%
Yard Trimmings,
21,080,000 , 24%
PRODUCTSMATERIALS
9
Normalizing
0
10,000
20,000
30,000
40,000
50,000
60,000
70,000
80,000
90,000
100,000
1960 1970 1980 1990 2000 2005 2010 2012 2013 2014
1,000Tons
Gross Recycling Tons
0.0
100.0
200.0
300.0
400.0
500.0
600.0
1960 1970 1980 1990 2000 2005 2010 2012 2013 2014
Pounds
Annual Per Capita Recycling
0.0%
5.0%
10.0%
15.0%
20.0%
25.0%
30.0%
35.0%
40.0%
1960 1970 1980 1990 2000 2005 2010 2012 2013 2014
%RecyclingofGeneration
Percentage Recycled of Waste Generation
Comparability between rates between gross tons, per capita pounds, and
percentage of generation:
R2 for lines of best fit = 0.928, 0.927, 0.921
10
Measurement Focus: Tons
0
5,000
10,000
15,000
20,000
25,000
30,000
35,000
1,000Tons
Material Landfilled
Measurement Focus: Recycling Rates
0%
10%
20%
30%
40%
50%
60%
70%
Paper and
Paperboard
Glass Ferrous
Metals
Aluminum Other
Nonferrous
Metals
Plastics Rubber and
Leather
Textiles Wood Food Yard
Trimmings
Material Recycling Rate
12
Measurement Focus: Value ($)
$874.00
$390.00
$122.00
$1,526.00
$51.00
$106.00
$56.00
$21.00
$-
$200.00
$400.00
$600.00
$800.00
$1,000.00
$1,200.00
$1,400.00
$1,600.00
$1,800.00
HDPE PET Steel Aluminum Newspapers Corrugated
Cardboard
Mixed paper Glass
Price/ton Material Commodity Values/Ton
13
Measurement Focus: GHGs
3.12
0.28
1.81
9.11
4.34
1.00
0.38
2.36 2.46
0.18 0.15
0.00
1.00
2.00
3.00
4.00
5.00
6.00
7.00
8.00
9.00
10.00
MMTCO2E/ton
GHG emissions/ton recycled
There is no one right way to measure.
There is no perfect singular measure.
Measure needs to be tailored to the program and
what is being evaluated.
14
Closing Thoughts
Thank you!
Visit us at:
http://www.epa.gov/smm
78% 90%
COMPANY A—Office COMPANY B—Distribution Center
Cardboard
Mixed Paper
Cans and Bottles
Compost
Cardboard
Mixed Paper
Cans and Bottles
Compost
5
78% 90%
COMPANY A—Office COMPANY B—Distribution Center
Cardboard
Mixed Paper
Cans and Bottles
Compost
Cardboard
Mixed Paper
Cans and Bottles
Compost
“There is no one perfect singular measure
and no one right way to measure”
6
INITIAL GOAL: 90% DIVERSION RATE
2010 2011 2012 2013 2014 2015
Recycling Rate 51% 55% 65% 74% 79% 78%
8
0.00
0.05
0.10
0.15
0.20
0.25
0.30
0.35
0.40
0.45
0.50
Organics
Recycling
Disposal
2010 2011 2012 2013 2014 2015
Recycling Rate 51% 55% 65% 74% 79% 78%
Per Capita Generation
(TPEPY)
0.46 0.39 0.40 0.44 0.43 0.39
REVISED GOAL: Decrease per capita generation 10% per year
11
“Set the right goals and prioritize programs”
“Focus on reduction first”
SCENARIO ANALYSIS
Start recycling other materials
75% of material to landfill could be
easily recycled
Potential to divert 42 tons of
material from landfill
GHG emission reductions of 93
metric tons
Capital investment of $10,000
Reduce total waste bills by $12,000
15
SCENARIO ANALYSIS
Start recycling other materials
75% of material to landfill could be
easily recycled
Potential to divert 42 tons of
material from landfill
GHG emission reductions of 93
metric tons
Capital investment of $10,000
Reduce total waste bills by $12,000
Increase cardboard reuse
Boxes would have to be redesigned
in collaboration with manufacturer
and customers in order to increase
reuse rate
Potential to reuse 800 tons of
cardboard
GHG emission reductions of 763
metric tons
Avoided box purchase costs of
$700,000
16
NEW GOALS: FIRST PRIORITY
Increase cardboard reuse
17
85%box reuse rate
NEW GOALS: SECOND PRIORITY
Start recycling other materials Increase cardboard reuse
18
75%reduction in waste to landfill
85%box reuse rate
NEW GOALS
Start recycling other materials Increase cardboard reuse
75% 85%reduction in waste to landfill box reuse rate
“Set the right goals and prioritize programs”
“Focus on reduction first”
19
GreenBiz 17 Workshop Slides: "Applying Lifecycle Thinking to Zero Waste Goals"

GreenBiz 17 Workshop Slides: "Applying Lifecycle Thinking to Zero Waste Goals"

  • 1.
    Measuring Materials Management Ron Vance Chief ResourceConservation Branch U.S. Environmental Protection Agency
  • 2.
    Evolution of Philosophy WasteManagement Recycling Integrated Waste Management Sustainable Materials Management 2
  • 3.
    While philosophy hasevolved, our goals have not Recycling Rate = 35% 3 Goals
  • 4.
    Measuring SMM Rank Goods& Services HHCan HHNonCan HHResp EcoTox GWrm OzDepl Smog Acid Eutro Energy Land Water Matl Waste RankValue 1 Electric power generation,transmis... 6.9 3.0 14.3 1.3 15.1 <1 11.7 15.8 1.2 12.8 <1 14.4 2.0 1.5 35.4 2 Residential permanentsitesingle- ... 3.7 3.7 3.5 2.2 3.1 2.0 4.6 2.3 <1 4.1 5.9 1.6 16.1 9.2 22.0 3 Animal (exceptpoultry) slaughterin... <1 <1 2.8 <1 2.3 <1 1.1 3.9 4.3 1.1 15.4 3.2 <1 7.6 18.8 4 Poultry processing <1 <1 <1 <1 <1 <1 <1 1.6 16.2 <1 1.3 1.1 <1 3.7 16.8 5 Wastemanagementand remediation se... 6.0 6.6 <1 12.2 <1 <1 <1 <1 <1 <1 <1 <1 <1 <1 15.2 6 Greenhouse,nursery,and floricultu... <1 <1 3.3 <1 <1 14.1 <1 <1 <1 <1 <1 <1 <1 <1 14.5 7 Food services and drinkingplaces 3.9 3.3 3.2 3.1 3.4 2.1 2.8 3.1 3.9 3.8 4.0 5.6 1.0 6.7 14.2 8 Lighttruck and utility vehicleman... 5.9 9.6 1.2 5.0 2.1 3.1 1.9 1.2 <1 1.7 <1 <1 <1 2.6 13.5 9 Retail trade 4.4 4.5 3.4 4.7 3.9 3.2 3.8 3.3 1.6 4.9 1.7 3.4 <1 3.7 13.4 10 Truck transportation <1 <1 1.3 <1 <1 <1 8.9 3.0 <1 2.9 <1 <1 <1 <1 9.9 U.S. Top Ten Most Impactful Goods and Services 4
  • 5.
    Goal is setat one tier – Recycling What about: • Generation • Landfilling (Zero Waste) 5 Waste Hierarchy
  • 6.
    6 Waste Hierarchy 66,380,000; 26% 33,140,000;13% 23,020,000; 9% 135,920,000; 52% 258,460,000 Tons of Waste Generated in 2014 Recycling Combustion with Energy Recovery Composting Landfill Note: Recycling and Composting combined equal 89,400,000 tons (35% of all waste generated)
  • 7.
  • 8.
    8 Material vs Product GlassPackaging , 2,990,000 , 3% Steel Packaging, 1,580,000 , 2% Aluminum Packaging, 700,000 , 1% Corrugated Boxes , 27,280,000 , 31% Other Paper and Paperboard Packaging, 2,210,000 , 2% Plastics Packaging, 2,120,000 , 2% Wood packaging, 2,570,000 , 3% Durable Goods, 9,750,000 , 11% Newspapers , 5,200,000 , 6% Other Paper Nondurable Goods, 9,710,000 , 11% Clothing and Footwear, 1,900,000 , 2% Towels, Sheets and Pillowcases, 230,000 , 0% Other Misc. Nondurables, 140,000 , 0% Food, 1,940,000 , 2% Yard Trimmings, 21,080,000 , 24% PRODUCTSMATERIALS
  • 9.
    9 Normalizing 0 10,000 20,000 30,000 40,000 50,000 60,000 70,000 80,000 90,000 100,000 1960 1970 19801990 2000 2005 2010 2012 2013 2014 1,000Tons Gross Recycling Tons 0.0 100.0 200.0 300.0 400.0 500.0 600.0 1960 1970 1980 1990 2000 2005 2010 2012 2013 2014 Pounds Annual Per Capita Recycling 0.0% 5.0% 10.0% 15.0% 20.0% 25.0% 30.0% 35.0% 40.0% 1960 1970 1980 1990 2000 2005 2010 2012 2013 2014 %RecyclingofGeneration Percentage Recycled of Waste Generation Comparability between rates between gross tons, per capita pounds, and percentage of generation: R2 for lines of best fit = 0.928, 0.927, 0.921
  • 10.
  • 11.
    Measurement Focus: RecyclingRates 0% 10% 20% 30% 40% 50% 60% 70% Paper and Paperboard Glass Ferrous Metals Aluminum Other Nonferrous Metals Plastics Rubber and Leather Textiles Wood Food Yard Trimmings Material Recycling Rate
  • 12.
    12 Measurement Focus: Value($) $874.00 $390.00 $122.00 $1,526.00 $51.00 $106.00 $56.00 $21.00 $- $200.00 $400.00 $600.00 $800.00 $1,000.00 $1,200.00 $1,400.00 $1,600.00 $1,800.00 HDPE PET Steel Aluminum Newspapers Corrugated Cardboard Mixed paper Glass Price/ton Material Commodity Values/Ton
  • 13.
    13 Measurement Focus: GHGs 3.12 0.28 1.81 9.11 4.34 1.00 0.38 2.362.46 0.18 0.15 0.00 1.00 2.00 3.00 4.00 5.00 6.00 7.00 8.00 9.00 10.00 MMTCO2E/ton GHG emissions/ton recycled
  • 14.
    There is noone right way to measure. There is no perfect singular measure. Measure needs to be tailored to the program and what is being evaluated. 14 Closing Thoughts
  • 15.
    Thank you! Visit usat: http://www.epa.gov/smm
  • 20.
    78% 90% COMPANY A—OfficeCOMPANY B—Distribution Center Cardboard Mixed Paper Cans and Bottles Compost Cardboard Mixed Paper Cans and Bottles Compost 5
  • 21.
    78% 90% COMPANY A—OfficeCOMPANY B—Distribution Center Cardboard Mixed Paper Cans and Bottles Compost Cardboard Mixed Paper Cans and Bottles Compost “There is no one perfect singular measure and no one right way to measure” 6
  • 23.
    INITIAL GOAL: 90%DIVERSION RATE 2010 2011 2012 2013 2014 2015 Recycling Rate 51% 55% 65% 74% 79% 78% 8
  • 26.
    0.00 0.05 0.10 0.15 0.20 0.25 0.30 0.35 0.40 0.45 0.50 Organics Recycling Disposal 2010 2011 20122013 2014 2015 Recycling Rate 51% 55% 65% 74% 79% 78% Per Capita Generation (TPEPY) 0.46 0.39 0.40 0.44 0.43 0.39 REVISED GOAL: Decrease per capita generation 10% per year 11 “Set the right goals and prioritize programs” “Focus on reduction first”
  • 30.
    SCENARIO ANALYSIS Start recyclingother materials 75% of material to landfill could be easily recycled Potential to divert 42 tons of material from landfill GHG emission reductions of 93 metric tons Capital investment of $10,000 Reduce total waste bills by $12,000 15
  • 31.
    SCENARIO ANALYSIS Start recyclingother materials 75% of material to landfill could be easily recycled Potential to divert 42 tons of material from landfill GHG emission reductions of 93 metric tons Capital investment of $10,000 Reduce total waste bills by $12,000 Increase cardboard reuse Boxes would have to be redesigned in collaboration with manufacturer and customers in order to increase reuse rate Potential to reuse 800 tons of cardboard GHG emission reductions of 763 metric tons Avoided box purchase costs of $700,000 16
  • 32.
    NEW GOALS: FIRSTPRIORITY Increase cardboard reuse 17 85%box reuse rate
  • 33.
    NEW GOALS: SECONDPRIORITY Start recycling other materials Increase cardboard reuse 18 75%reduction in waste to landfill 85%box reuse rate
  • 34.
    NEW GOALS Start recyclingother materials Increase cardboard reuse 75% 85%reduction in waste to landfill box reuse rate “Set the right goals and prioritize programs” “Focus on reduction first” 19

Editor's Notes