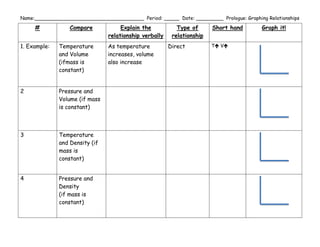
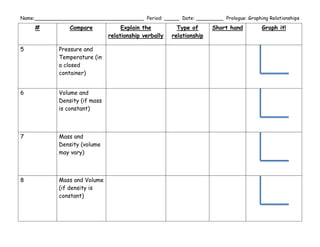
The document describes 8 relationships between physical properties: 1) As temperature increases, volume increases for constant mass systems. 2) As pressure increases, volume decreases for constant mass systems. 3) As temperature increases, density decreases for constant mass systems. 4) As pressure increases, density increases for constant mass systems. 5) In a closed container, as temperature increases, pressure increases. 6) As volume increases, density decreases for constant mass systems. 7) As mass increases, density increases regardless of volume. 8) As mass increases, volume increases for constant density systems.