
Recommended
More Related Content
What's hot
What's hot (18)
Viewers also liked
Viewers also liked (20)
Similar to Graphing a line
Similar to Graphing a line (20)
Recently uploaded
Recently uploaded (20)
Graphing a line
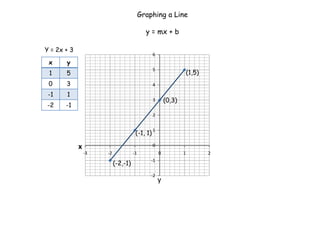
- 1. Graphing a Line y = mx + b Y = 2x + 3 6 x y 5 1 5 (1,5) 0 3 4 -1 1 3 (0,3) -2 -1 2 1 (-1, 1) x 0 -3 -2 -1 0 1 2 -1 (-2,-1) -2 y
- 2. Graphing a Line y = mx + b y = 2x + 3 6 5 4 3 b = point where line crosses 2 y-axis slope = m = rise = 2 1 run 1 x 0 -3 -2 -1 0 1 2 -1 -2 y