Download as PDF, PPTX
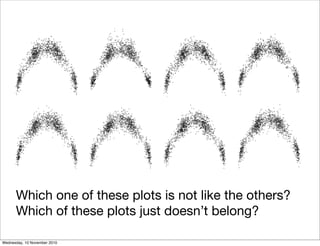
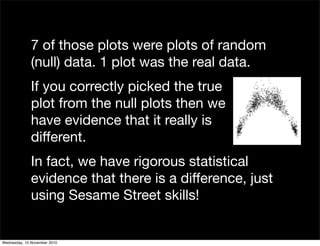
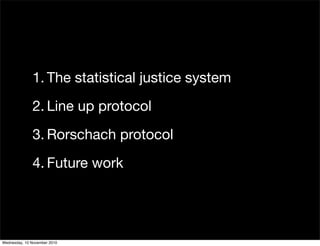


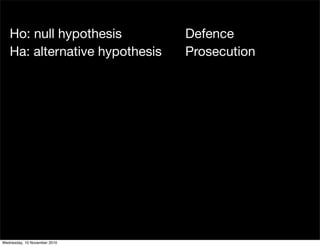

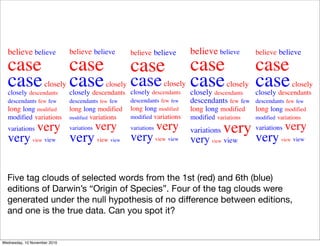

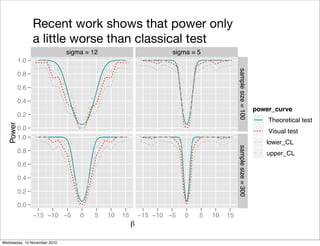
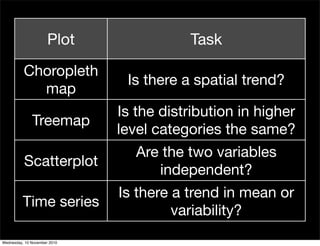
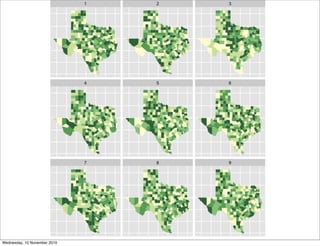
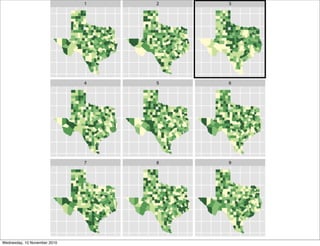
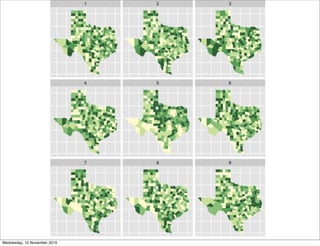
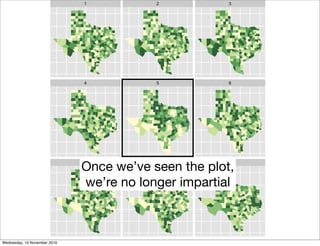
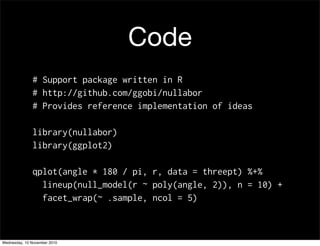

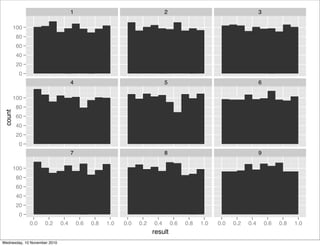


The document discusses visual inference, which is using human judgment to determine if a visualization of real data differs from visualizations of random null data. It describes protocols for generating null data visualizations and having observers try to pick out the real visualization, allowing for statistical tests without predefined test statistics. Potential applications and future work are also discussed, such as integrating this approach into visualization software and studying how training impacts human judgment of random variations.


