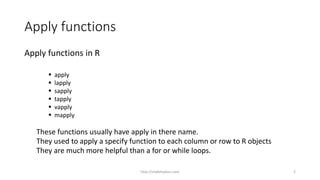
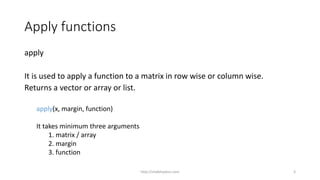
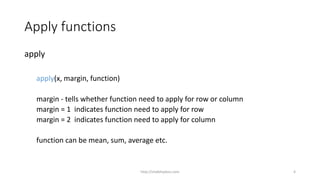
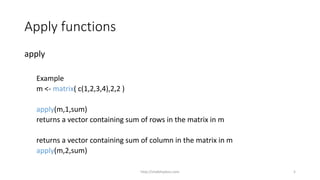
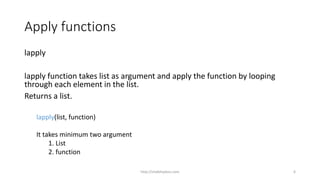
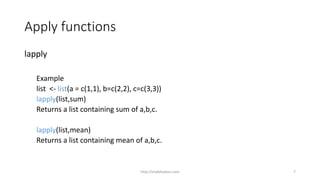
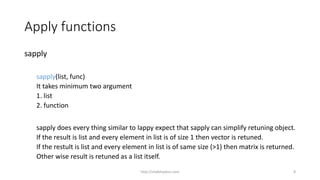
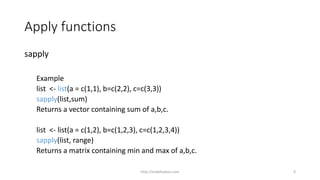
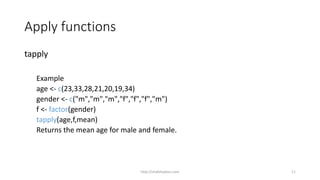
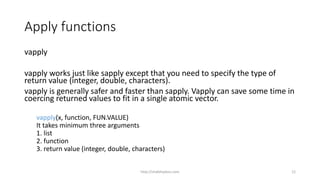
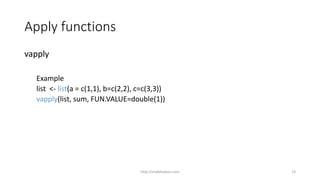
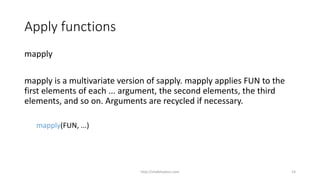
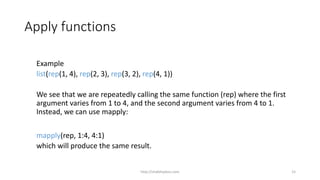
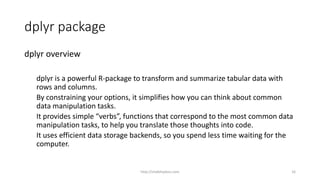
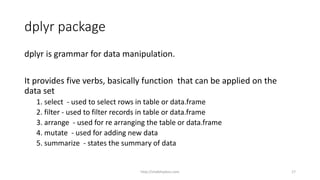
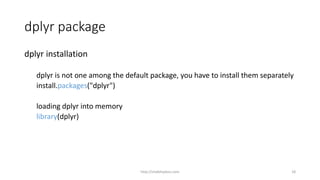
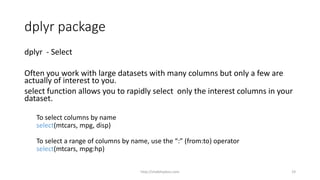
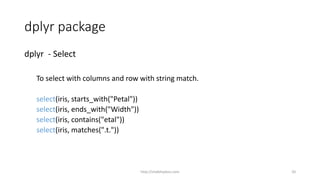
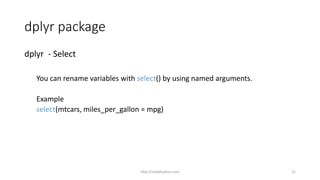
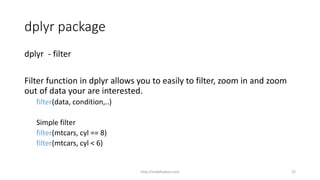
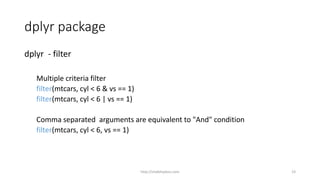
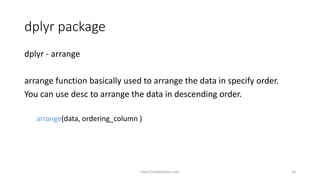
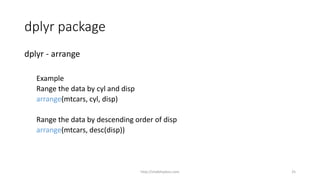
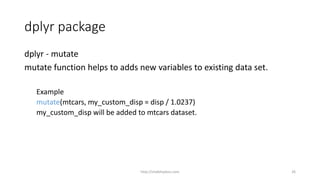
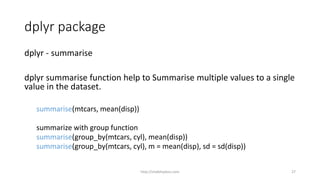
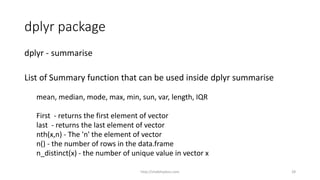
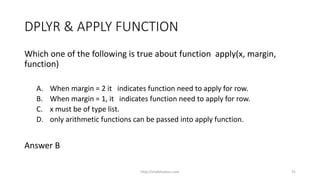
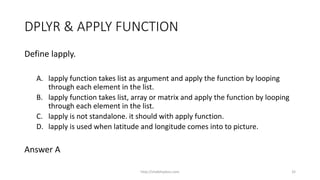
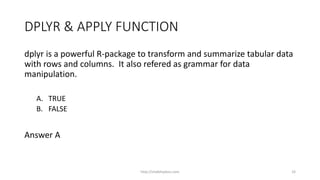
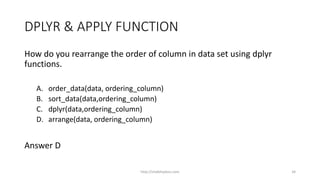
- Apply functions in R are used to apply a specified function to each column or row of R objects. Common apply functions include apply(), lapply(), sapply(), tapply(), vapply(), and mapply().
- The dplyr package is a powerful R package for data manipulation. It provides verbs like select(), filter(), arrange(), mutate(), and summarize() to work with tabular data.
- Functions like apply(), lapply(), sapply() apply a function over lists or matrices. Arrange() reorders data, mutate() adds new variables, and summarize() collapses multiple values into single values.
It covers- Introduction to R language, Creating, Exploring data with Various Data Structures e.g. Vector, Array, Matrices, and Factors. Using Methods with examples.
Inheritance is the capability of a class to use the properties and methods of another class while adding its own functionality.
Enables you to add new features and functionality to an existing class without modifying the existing class.
To learn important concept of Collection and its handling plus its advantages and different class & child class of Collection and their implementations. Important interview questions of the collection.
Overview and about R, R Studio Installation, Fundamentals of R Programming: Data Structures and Data Types, Operators, Control Statements, Loop Statements, Functions,
Descriptive Analysis using R: Maximum, Minimum, Range, Mean, Median and Mode, Variance, Standard Deviation, Quantiles, IQR, Summary
After completing this lesson, you should be able to
do the following:
List the capabilities of SQL SELECT statements
Execute a basic SELECT statement
Differentiate between SQL statements and iSQL*Plus commands
http://phpexecutor.com
This set of slides is based on the presentation I gave at ACM DataScience camp 2014. This is suitable for those who are still new to R. It has a few basic data manipulation techniques, and then goes into the basics of using of the dplyr package (Hadley Wickham) #rstats #dplyr
Overview of a few ways to group and summarize data in R using sample airfare data from DOT/BTS's O&D Survey.
Starts with naive approach with subset() & loops, shows base R's tapply() & aggregate(), highlights doBy and plyr packages.
Presented at the March 2011 meeting of the Greater Boston useR Group.
Paquete ggplot - Potencia y facilidad para generar gráficos en RNestor Montaño
El paquete ggplot de R proporciona un poderoso sistema que hace que sea fácil de producir gráficos complejos de varias capas, automatiza varios aspectos tediosos del proceso de graficar manteniendo al mismo tiempo la habilidad de construir paso a paso un gráfico pues se compone de una serie de pequeños bloques de construcción independientes, esto reduce la redundancia dentro del código, y hace que sea fácil de personalizar el gráfico para obtener exactamente lo que se desea.
Stata cheat sheet: programming. Co-authored with Tim Essam (linkedin.com/in/timessam). See all cheat sheets at http://bit.ly/statacheatsheets. Updated 2016/06/04
MATLAB stands for Matrix Laboratory. MATLAB was written originally
to provide easy access to matrix software developed by the LINPACK (linear system package) and matlab 2012a manual pdf
This 10 hours class is intended to give students the basis to empirically solve statistical problems. Talk 1 serves as an introduction to the statistical software R, and presents how to calculate basic measures such as mean, variance, correlation and gini index. Talk 2 shows how the central limit theorem and the law of the large numbers work empirically. Talk 3 presents the point estimate, the confidence interval and the hypothesis test for the most important parameters. Talk 4 introduces to the linear regression model and Talk 5 to the bootstrap world. Talk 5 also presents an easy example of a markov chains.
All the talks are supported by script codes, in R language.
Mini-lab 1: Stochastic Gradient Descent classifier, Optimizing Logistic Regre...Yao Yao
https://github.com/yaowser/data_mining_group_project
https://www.kaggle.com/c/zillow-prize-1/data
From the Zillow real estate data set of properties in the southern California area, conduct the following data cleaning, data analysis, predictive analysis, and machine learning algorithms:
Mini-lab 1: Stochastic Gradient Descent classifier, Optimizing Logistic Regression Model Performance, Optimizing Support Vector Machine Classifier, Accuracy of results and efficiency, Logistic Regression Feature Importance, interpretation of support vectors, Density Graph
Attached here is a presentation that I made covering some bits and pieces of what I got to discover about Data Science and Machine Learning using R Programming Language.
Adjusting primitives for graph : SHORT REPORT / NOTESSubhajit Sahu
Graph algorithms, like PageRank Compressed Sparse Row (CSR) is an adjacency-list based graph representation that is
Multiply with different modes (map)
1. Performance of sequential execution based vs OpenMP based vector multiply.
2. Comparing various launch configs for CUDA based vector multiply.
Sum with different storage types (reduce)
1. Performance of vector element sum using float vs bfloat16 as the storage type.
Sum with different modes (reduce)
1. Performance of sequential execution based vs OpenMP based vector element sum.
2. Performance of memcpy vs in-place based CUDA based vector element sum.
3. Comparing various launch configs for CUDA based vector element sum (memcpy).
4. Comparing various launch configs for CUDA based vector element sum (in-place).
Sum with in-place strategies of CUDA mode (reduce)
1. Comparing various launch configs for CUDA based vector element sum (in-place).
Explore our comprehensive data analysis project presentation on predicting product ad campaign performance. Learn how data-driven insights can optimize your marketing strategies and enhance campaign effectiveness. Perfect for professionals and students looking to understand the power of data analysis in advertising. for more details visit: https://bostoninstituteofanalytics.org/data-science-and-artificial-intelligence/
As Europe's leading economic powerhouse and the fourth-largest hashtag#economy globally, Germany stands at the forefront of innovation and industrial might. Renowned for its precision engineering and high-tech sectors, Germany's economic structure is heavily supported by a robust service industry, accounting for approximately 68% of its GDP. This economic clout and strategic geopolitical stance position Germany as a focal point in the global cyber threat landscape.
In the face of escalating global tensions, particularly those emanating from geopolitical disputes with nations like hashtag#Russia and hashtag#China, hashtag#Germany has witnessed a significant uptick in targeted cyber operations. Our analysis indicates a marked increase in hashtag#cyberattack sophistication aimed at critical infrastructure and key industrial sectors. These attacks range from ransomware campaigns to hashtag#AdvancedPersistentThreats (hashtag#APTs), threatening national security and business integrity.
🔑 Key findings include:
🔍 Increased frequency and complexity of cyber threats.
🔍 Escalation of state-sponsored and criminally motivated cyber operations.
🔍 Active dark web exchanges of malicious tools and tactics.
Our comprehensive report delves into these challenges, using a blend of open-source and proprietary data collection techniques. By monitoring activity on critical networks and analyzing attack patterns, our team provides a detailed overview of the threats facing German entities.
This report aims to equip stakeholders across public and private sectors with the knowledge to enhance their defensive strategies, reduce exposure to cyber risks, and reinforce Germany's resilience against cyber threats.
Techniques to optimize the pagerank algorithm usually fall in two categories. One is to try reducing the work per iteration, and the other is to try reducing the number of iterations. These goals are often at odds with one another. Skipping computation on vertices which have already converged has the potential to save iteration time. Skipping in-identical vertices, with the same in-links, helps reduce duplicate computations and thus could help reduce iteration time. Road networks often have chains which can be short-circuited before pagerank computation to improve performance. Final ranks of chain nodes can be easily calculated. This could reduce both the iteration time, and the number of iterations. If a graph has no dangling nodes, pagerank of each strongly connected component can be computed in topological order. This could help reduce the iteration time, no. of iterations, and also enable multi-iteration concurrency in pagerank computation. The combination of all of the above methods is the STICD algorithm. [sticd] For dynamic graphs, unchanged components whose ranks are unaffected can be skipped altogether.
2. Apply functions
Apply functions in R
apply
lapply
sapply
tapply
vapply
mapply
These functions usually have apply in there name.
They used to apply a specify function to each column or row to R objects
They are much more helpful than a for or while loops.
http://shakthydoss.com 2
3. Apply functions
apply
It is used to apply a function to a matrix in row wise or column wise.
Returns a vector or array or list.
apply(x, margin, function)
It takes minimum three arguments
1. matrix / array
2. margin
3. function
http://shakthydoss.com 3
4. Apply functions
apply
apply(x, margin, function)
margin - tells whether function need to apply for row or column
margin = 1 indicates function need to apply for row
margin = 2 indicates function need to apply for column
function can be mean, sum, average etc.
http://shakthydoss.com 4
5. Apply functions
apply
Example
m <- matrix( c(1,2,3,4),2,2 )
apply(m,1,sum)
returns a vector containing sum of rows in the matrix in m
returns a vector containing sum of column in the matrix in m
apply(m,2,sum)
http://shakthydoss.com 5
6. Apply functions
lapply
lapply function takes list as argument and apply the function by looping
through each element in the list.
Returns a list.
lapply(list, function)
It takes minimum two argument
1. List
2. function
http://shakthydoss.com 6
7. Apply functions
lapply
Example
list <- list(a = c(1,1), b=c(2,2), c=c(3,3))
lapply(list,sum)
Returns a list containing sum of a,b,c.
lapply(list,mean)
Returns a list containing mean of a,b,c.
http://shakthydoss.com 7
8. Apply functions
sapply
sapply(list, func)
It takes minimum two argument
1. list
2. function
sapply does every thing similar to lappy expect that sapply can simplify retuning object.
If the result is list and every element in list is of size 1 then vector is retuned.
If the restult is list and every element in list is of same size (>1) then matrix is returned.
Other wise result is retuned as a list itself.
http://shakthydoss.com 8
9. Apply functions
sapply
Example
list <- list(a = c(1,1), b=c(2,2), c=c(3,3))
sapply(list,sum)
Returns a vector containing sum of a,b,c.
list <- list(a = c(1,2), b=c(1,2,3), c=c(1,2,3,4))
sapply(list, range)
Returns a matrix containing min and max of a,b,c.
http://shakthydoss.com 9
10. Apply functions
tapply
tapply works on vector, It apply the function by grouping factors inside
the vector.
tapply(x, factor, fun)
It takes minimum three arguments
1. vector
2. factor of vector
3. function
http://shakthydoss.com 10
11. Apply functions
tapply
Example
age <- c(23,33,28,21,20,19,34)
gender <- c("m","m","m","f","f","f","m")
f <- factor(gender)
tapply(age,f,mean)
Returns the mean age for male and female.
http://shakthydoss.com 11
12. Apply functions
vapply
vapply works just like sapply except that you need to specify the type of
return value (integer, double, characters).
vapply is generally safer and faster than sapply. Vapply can save some time in
coercing returned values to fit in a single atomic vector.
vapply(x, function, FUN.VALUE)
It takes minimum three arguments
1. list
2. function
3. return value (integer, double, characters)
http://shakthydoss.com 12
14. Apply functions
mapply
mapply is a multivariate version of sapply. mapply applies FUN to the
first elements of each ... argument, the second elements, the third
elements, and so on. Arguments are recycled if necessary.
mapply(FUN, ...)
http://shakthydoss.com 14
15. Apply functions
Example
list(rep(1, 4), rep(2, 3), rep(3, 2), rep(4, 1))
We see that we are repeatedly calling the same function (rep) where the first
argument varies from 1 to 4, and the second argument varies from 4 to 1.
Instead, we can use mapply:
mapply(rep, 1:4, 4:1)
which will produce the same result.
http://shakthydoss.com 15
16. dplyr package
dplyr overview
dplyr is a powerful R-package to transform and summarize tabular data with
rows and columns.
By constraining your options, it simplifies how you can think about common
data manipulation tasks.
It provides simple “verbs”, functions that correspond to the most common data
manipulation tasks, to help you translate those thoughts into code.
It uses efficient data storage backends, so you spend less time waiting for the
computer.
http://shakthydoss.com 16
17. dplyr package
dplyr is grammar for data manipulation.
It provides five verbs, basically function that can be applied on the
data set
1. select - used to select rows in table or data.frame
2. filter - used to filter records in table or data.frame
3. arrange - used for re arranging the table or data.frame
4. mutate - used for adding new data
5. summarize - states the summary of data
http://shakthydoss.com 17
18. dplyr package
dplyr installation
dplyr is not one among the default package, you have to install them separately
install.packages("dplyr")
loading dplyr into memory
library(dplyr)
http://shakthydoss.com 18
19. dplyr package
dplyr - Select
Often you work with large datasets with many columns but only a few are
actually of interest to you.
select function allows you to rapidly select only the interest columns in your
dataset.
To select columns by name
select(mtcars, mpg, disp)
To select a range of columns by name, use the “:” (from:to) operator
select(mtcars, mpg:hp)
http://shakthydoss.com 19
20. dplyr package
dplyr - Select
To select with columns and row with string match.
select(iris, starts_with("Petal"))
select(iris, ends_with("Width"))
select(iris, contains("etal"))
select(iris, matches(".t."))
http://shakthydoss.com 20
21. dplyr package
dplyr - Select
You can rename variables with select() by using named arguments.
Example
select(mtcars, miles_per_gallon = mpg)
http://shakthydoss.com 21
22. dplyr package
dplyr - filter
Filter function in dplyr allows you to easily to filter, zoom in and zoom
out of data your are interested.
filter(data, condition,..)
Simple filter
filter(mtcars, cyl == 8)
filter(mtcars, cyl < 6)
http://shakthydoss.com 22
23. dplyr package
dplyr - filter
Multiple criteria filter
filter(mtcars, cyl < 6 & vs == 1)
filter(mtcars, cyl < 6 | vs == 1)
Comma separated arguments are equivalent to "And" condition
filter(mtcars, cyl < 6, vs == 1)
http://shakthydoss.com 23
24. dplyr package
dplyr - arrange
arrange function basically used to arrange the data in specify order.
You can use desc to arrange the data in descending order.
arrange(data, ordering_column )
http://shakthydoss.com 24
25. dplyr package
dplyr - arrange
Example
Range the data by cyl and disp
arrange(mtcars, cyl, disp)
Range the data by descending order of disp
arrange(mtcars, desc(disp))
http://shakthydoss.com 25
26. dplyr package
dplyr - mutate
mutate function helps to adds new variables to existing data set.
Example
mutate(mtcars, my_custom_disp = disp / 1.0237)
my_custom_disp will be added to mtcars dataset.
http://shakthydoss.com 26
27. dplyr package
dplyr - summarise
dplyr summarise function help to Summarise multiple values to a single
value in the dataset.
summarise(mtcars, mean(disp))
summarize with group function
summarise(group_by(mtcars, cyl), mean(disp))
summarise(group_by(mtcars, cyl), m = mean(disp), sd = sd(disp))
http://shakthydoss.com 27
28. dplyr package
dplyr - summarise
List of Summary function that can be used inside dplyr summarise
mean, median, mode, max, min, sun, var, length, IQR
First - returns the first element of vector
last - returns the last element of vector
nth(x,n) - The 'n' the element of vector
n() - the number of rows in the data.frame
n_distinct(x) - the number of unique value in vector x
http://shakthydoss.com 28
29. DPLYR & APPLY FUNCTION
Knowledge Check
http://shakthydoss.com 29
30. DPLYR & APPLY FUNCTION
Apply functions in R used to apply a specify function to each column or
row to R objects.
A. TRUE
B. FALSE
Answer A
http://shakthydoss.com 30
31. DPLYR & APPLY FUNCTION
Which one of the following is true about function apply(x, margin,
function)
A. When margin = 2 it indicates function need to apply for row.
B. When margin = 1, it indicates function need to apply for row.
C. x must be of type list.
D. only arithmetic functions can be passed into apply function.
Answer B
http://shakthydoss.com 31
32. DPLYR & APPLY FUNCTION
Define lapply.
A. lapply function takes list as argument and apply the function by looping
through each element in the list.
B. lapply function takes list, array or matrix and apply the function by looping
through each element in the list.
C. lapply is not standalone. it should with apply function.
D. lapply is used when latitude and longitude comes into to picture.
Answer A
http://shakthydoss.com 32
33. DPLYR & APPLY FUNCTION
dplyr is a powerful R-package to transform and summarize tabular data
with rows and columns. It also refered as grammar for data
manipulation.
A. TRUE
B. FALSE
Answer A
http://shakthydoss.com 33
34. DPLYR & APPLY FUNCTION
How do you rearrange the order of column in data set using dplyr
functions.
A. order_data(data, ordering_column)
B. sort_data(data,ordering_column)
C. dplyr(data,ordering_column)
D. arrange(data, ordering_column)
Answer D
http://shakthydoss.com 34