Download to read offline
![Page 26
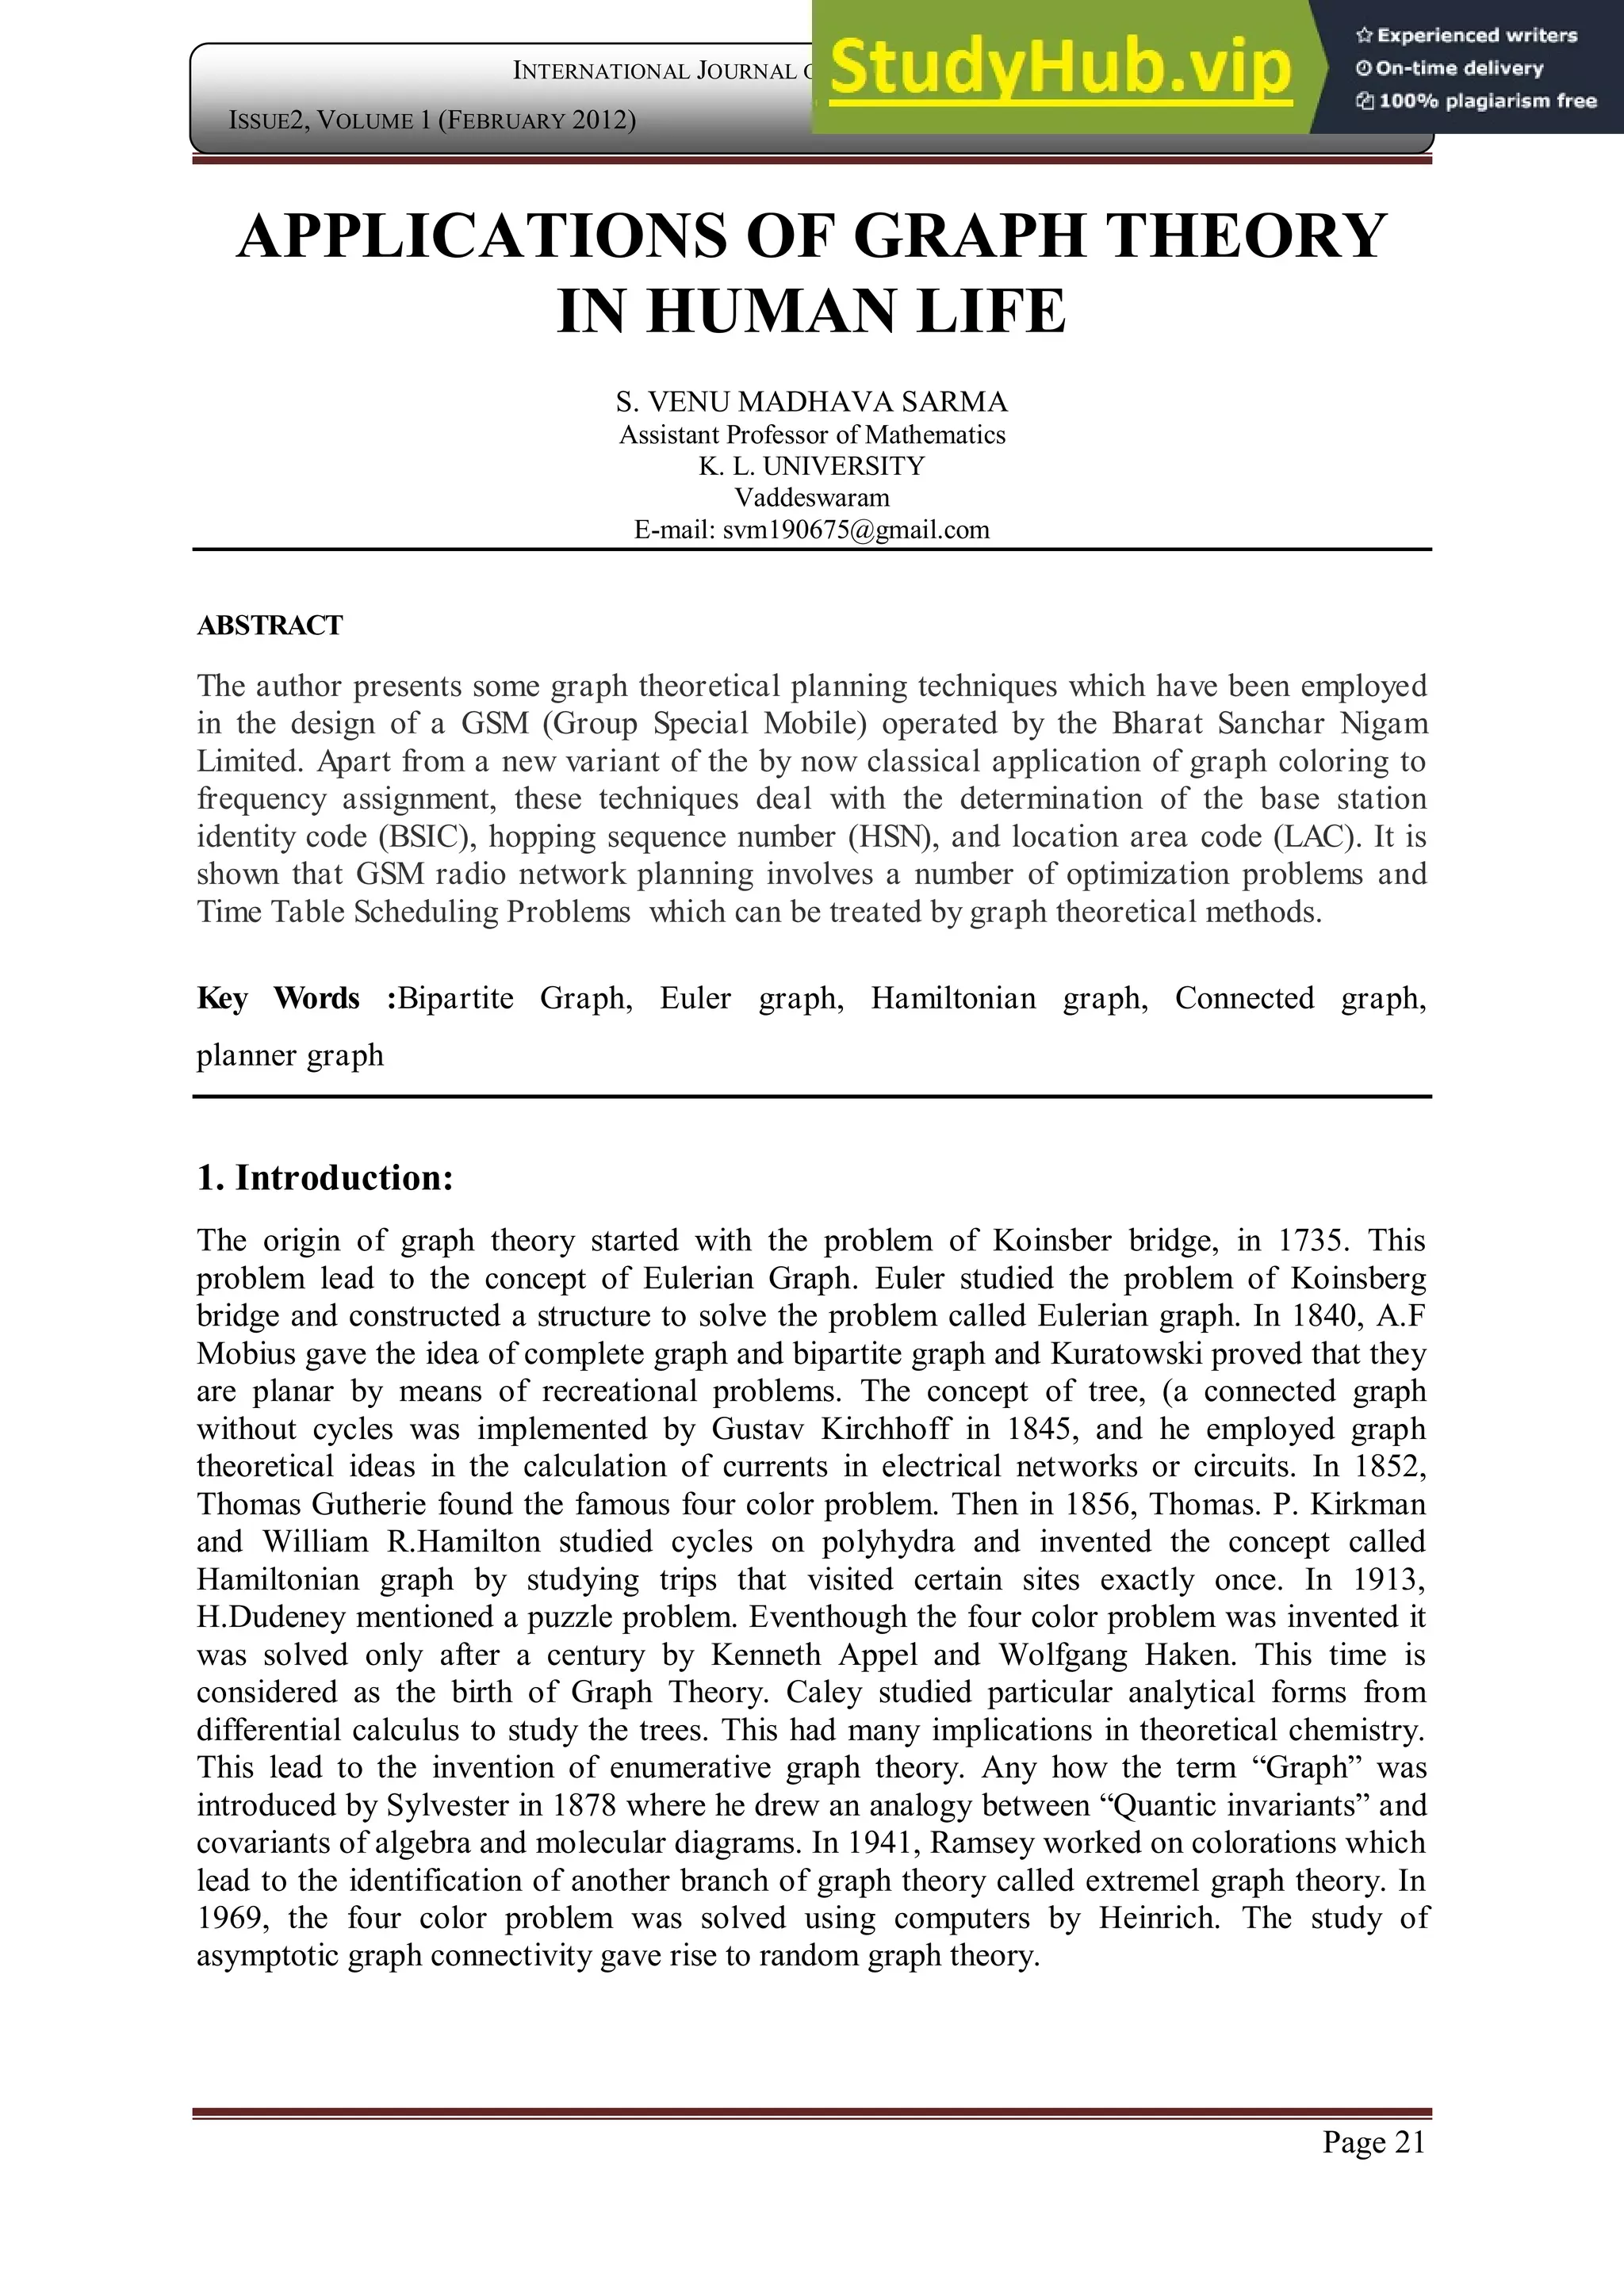
INTERNATIONAL JOURNAL OF COMPUTER APPLICATION
ISSUE2, VOLUME 1 (FEBRUARY 2012) ISSN: 2250-1797
prestige or to explore diffusion mechanisms. Graph theory is used in biology and
conservation efforts where a vertex represents regions where certain species exist and the
edges represent migration path or movement between the regions. This information is
important when looking at breeding patterns or tracking the spread of disease, parasites and
to study the impact of migration that affect other species. Graph theoretical concepts are
widely used in Operations Research. For example, the traveling salesman problem, the
shortest spanning tree in a weighted graph, obtaining an optimal match of jobs and men and
locating the shortest path between two vertices in a graph. It is also used in modeling
transport networks, activity networks and theory of games. The network activity is used to
solve large number of combinatorial problems. The most popular and successful applications
of networks in OR is the planning and scheduling of large complicated projects. The best well
known problems are PERT(Project Evaluation Review Technique) and CPM (Critical Path
Method). Next, Game theory is applied to the problems in engineering, economics and war
science to find optimal way to perform
certain tasks in competitive environments. To represent the method of finite game a digraph
is used. Here, the vertices represent the positions and the edges represent the moves.
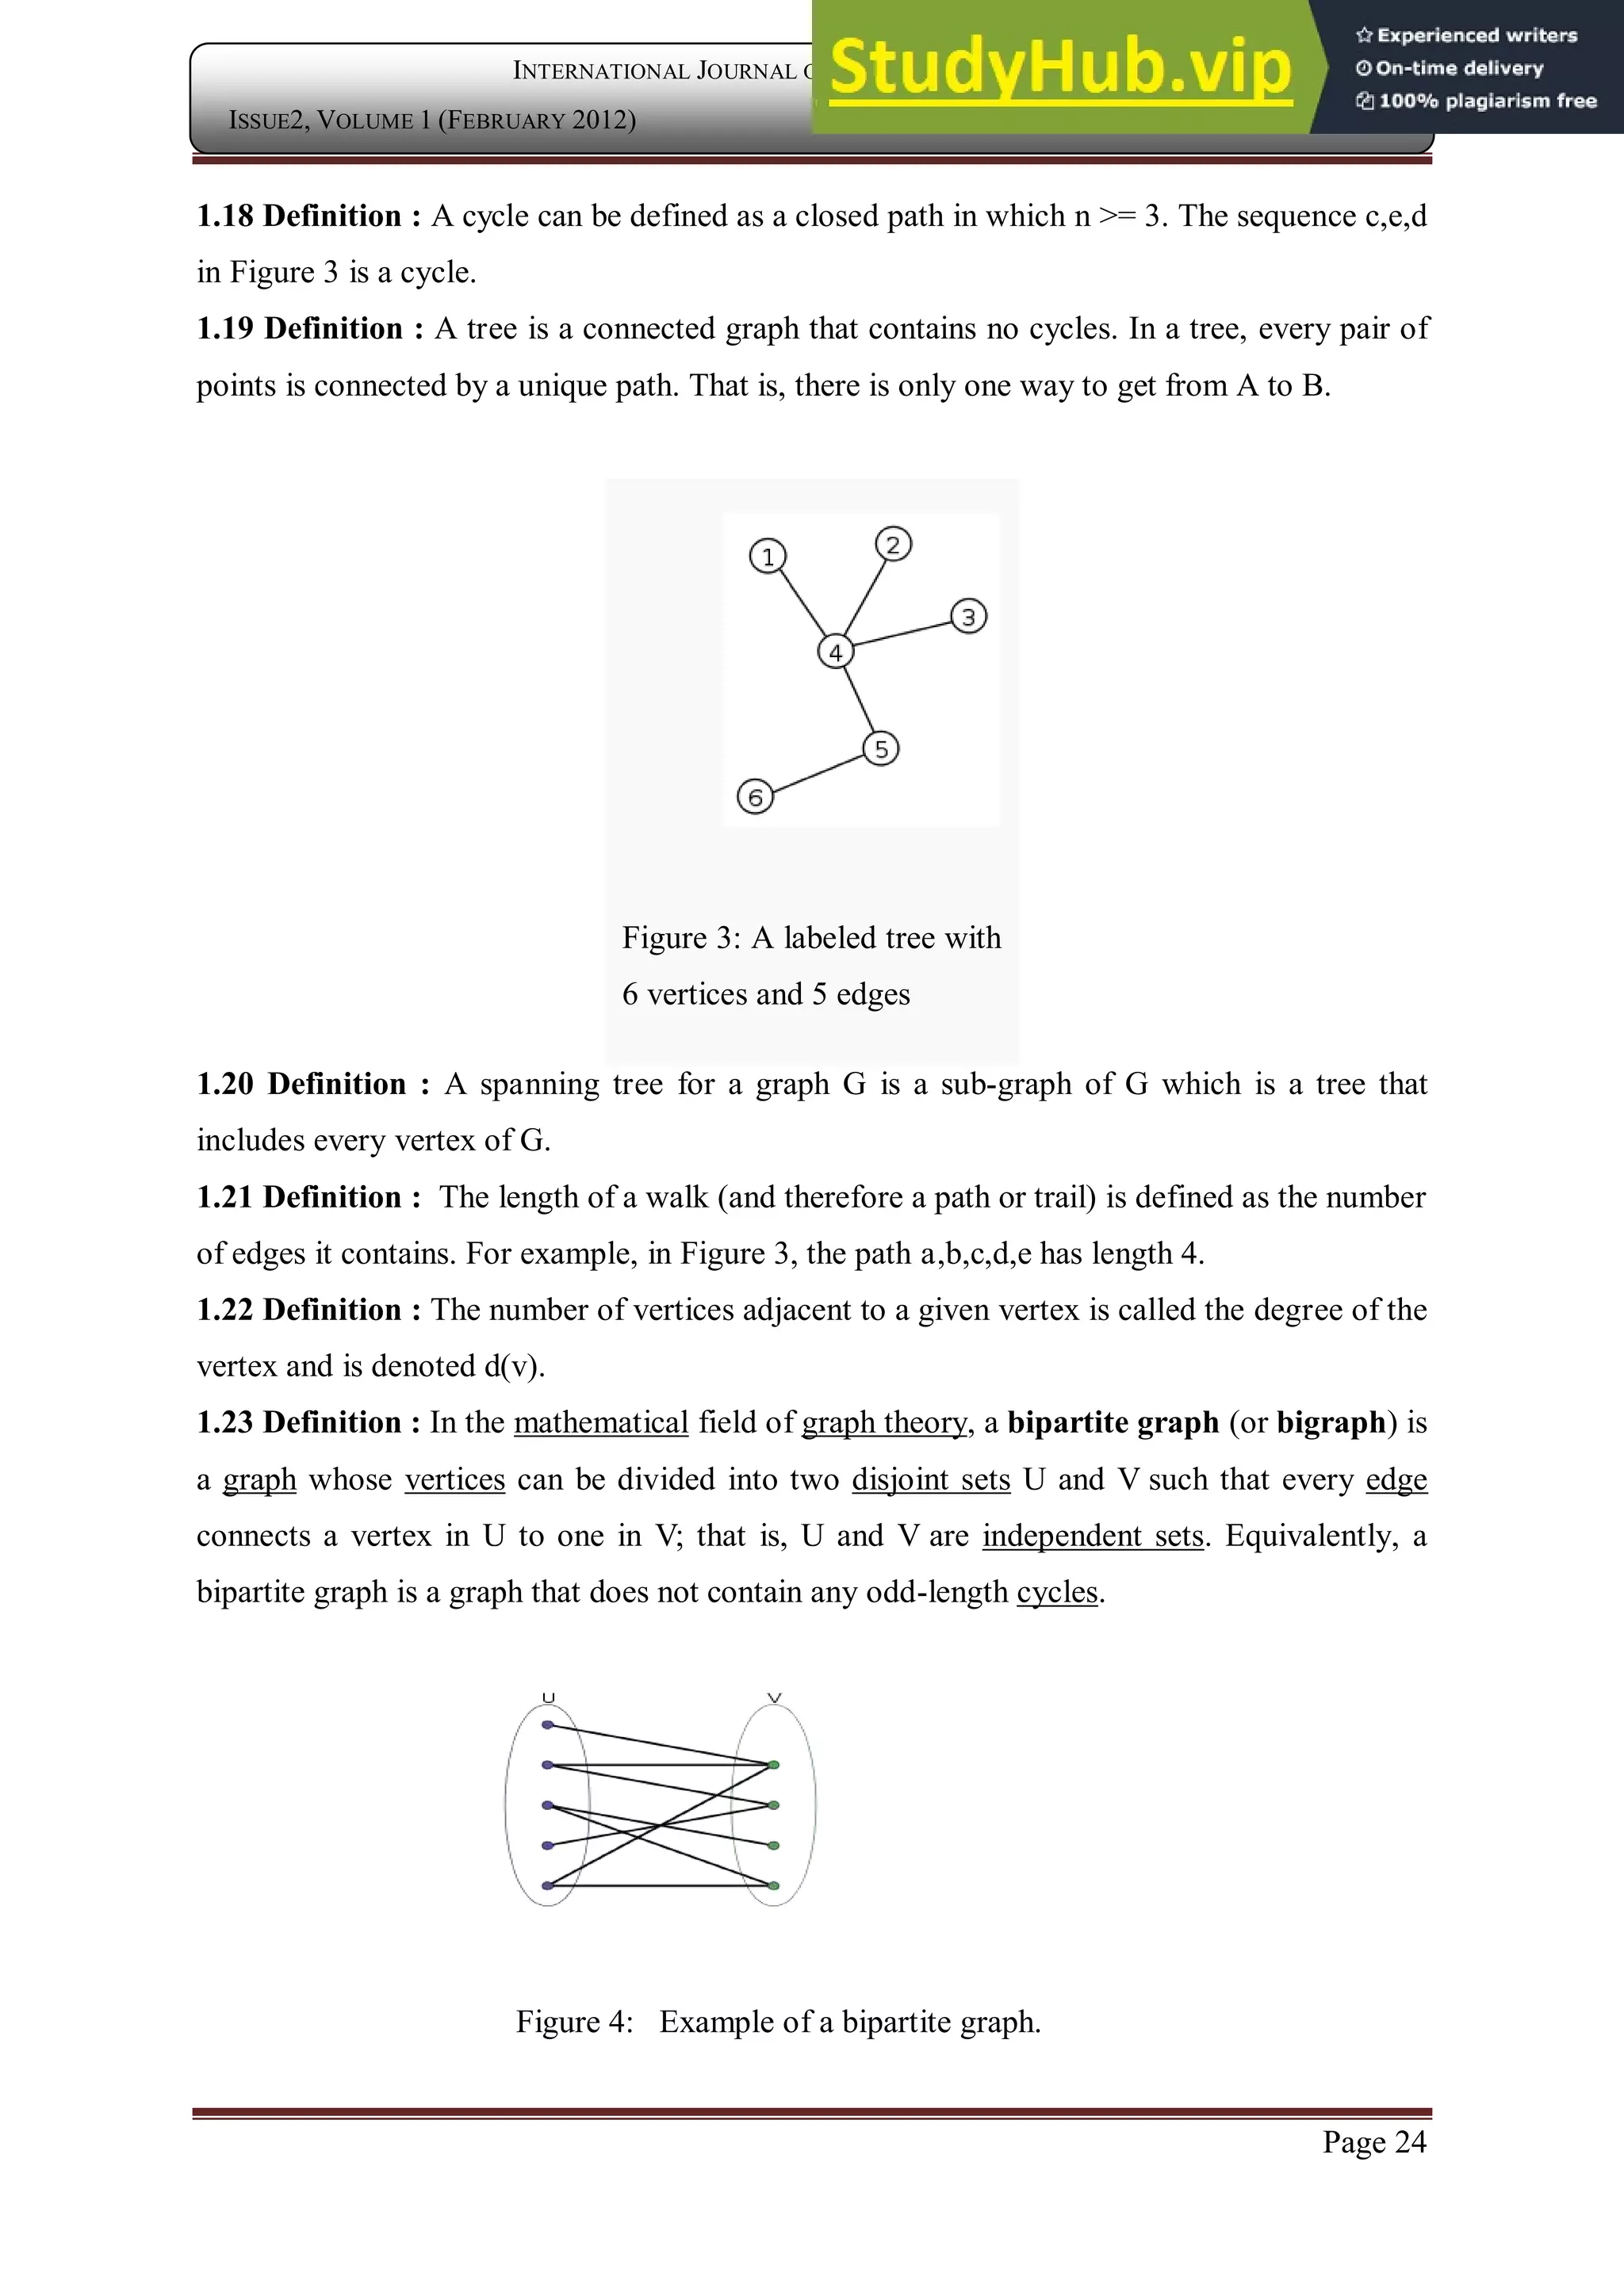
3.1 Traveling Salesman Problem :
TSP is a very well-known problem which is based on Hamilton cycle. The problem statement
is: Given a number of cities and the cost of traveling from any city to any other city, find the
cheapest round-trip route that visits every city exactly once and return to the starting city.
In graph terminology, where the vertices of the graph represent cities and the edges represent
the cost of traveling between the connected cities (adjacent vertices), traveling salesman
problem is just about trying to find the Hamilton cycle with the minimum weight. This
problem has been shown to be NP-Hard. Even though the problem is computationally
difficult, a large number of heuristics and exact methods are known, so that some instances
with tens of thousands of cities have been solved. The most direct solution would be to try all
permutations and see which one is cheapest (using brute force search). The running time for
this approach is O(V !), the factorial of the number of cities, so this solution becomes
impractical even for only 20 cities. A dynamic programming solution solves the problem with
a runtime complexity of O(V22V) by considering
dp[end][state] which means the minimum cost to travel from start vertex to end vertex using
the vertrices stated in the state (start vertex can be any vertex chosen at the start). As there are](https://image.slidesharecdn.com/applicationsofgraphtheoryinhumanlife-230806124232-3419b17c/75/APPLICATIONS-OF-GRAPH-THEORY-IN-HUMAN-LIFE-6-2048.jpg)
![Page 28
INTERNATIONAL JOURNAL OF COMPUTER APPLICATION
ISSUE2, VOLUME 1 (FEBRUARY 2012) ISSN: 2250-1797
common. Then proper coloring of the dual graph gives proper coloring of the original map.
Since, coloring the regions of a planar graph G is equivalent to coloring the vertices of its
dual graph and vice versa. By coloring the map regions using four color theorem, the four
frequencies can be assigned to the regions accordingly.
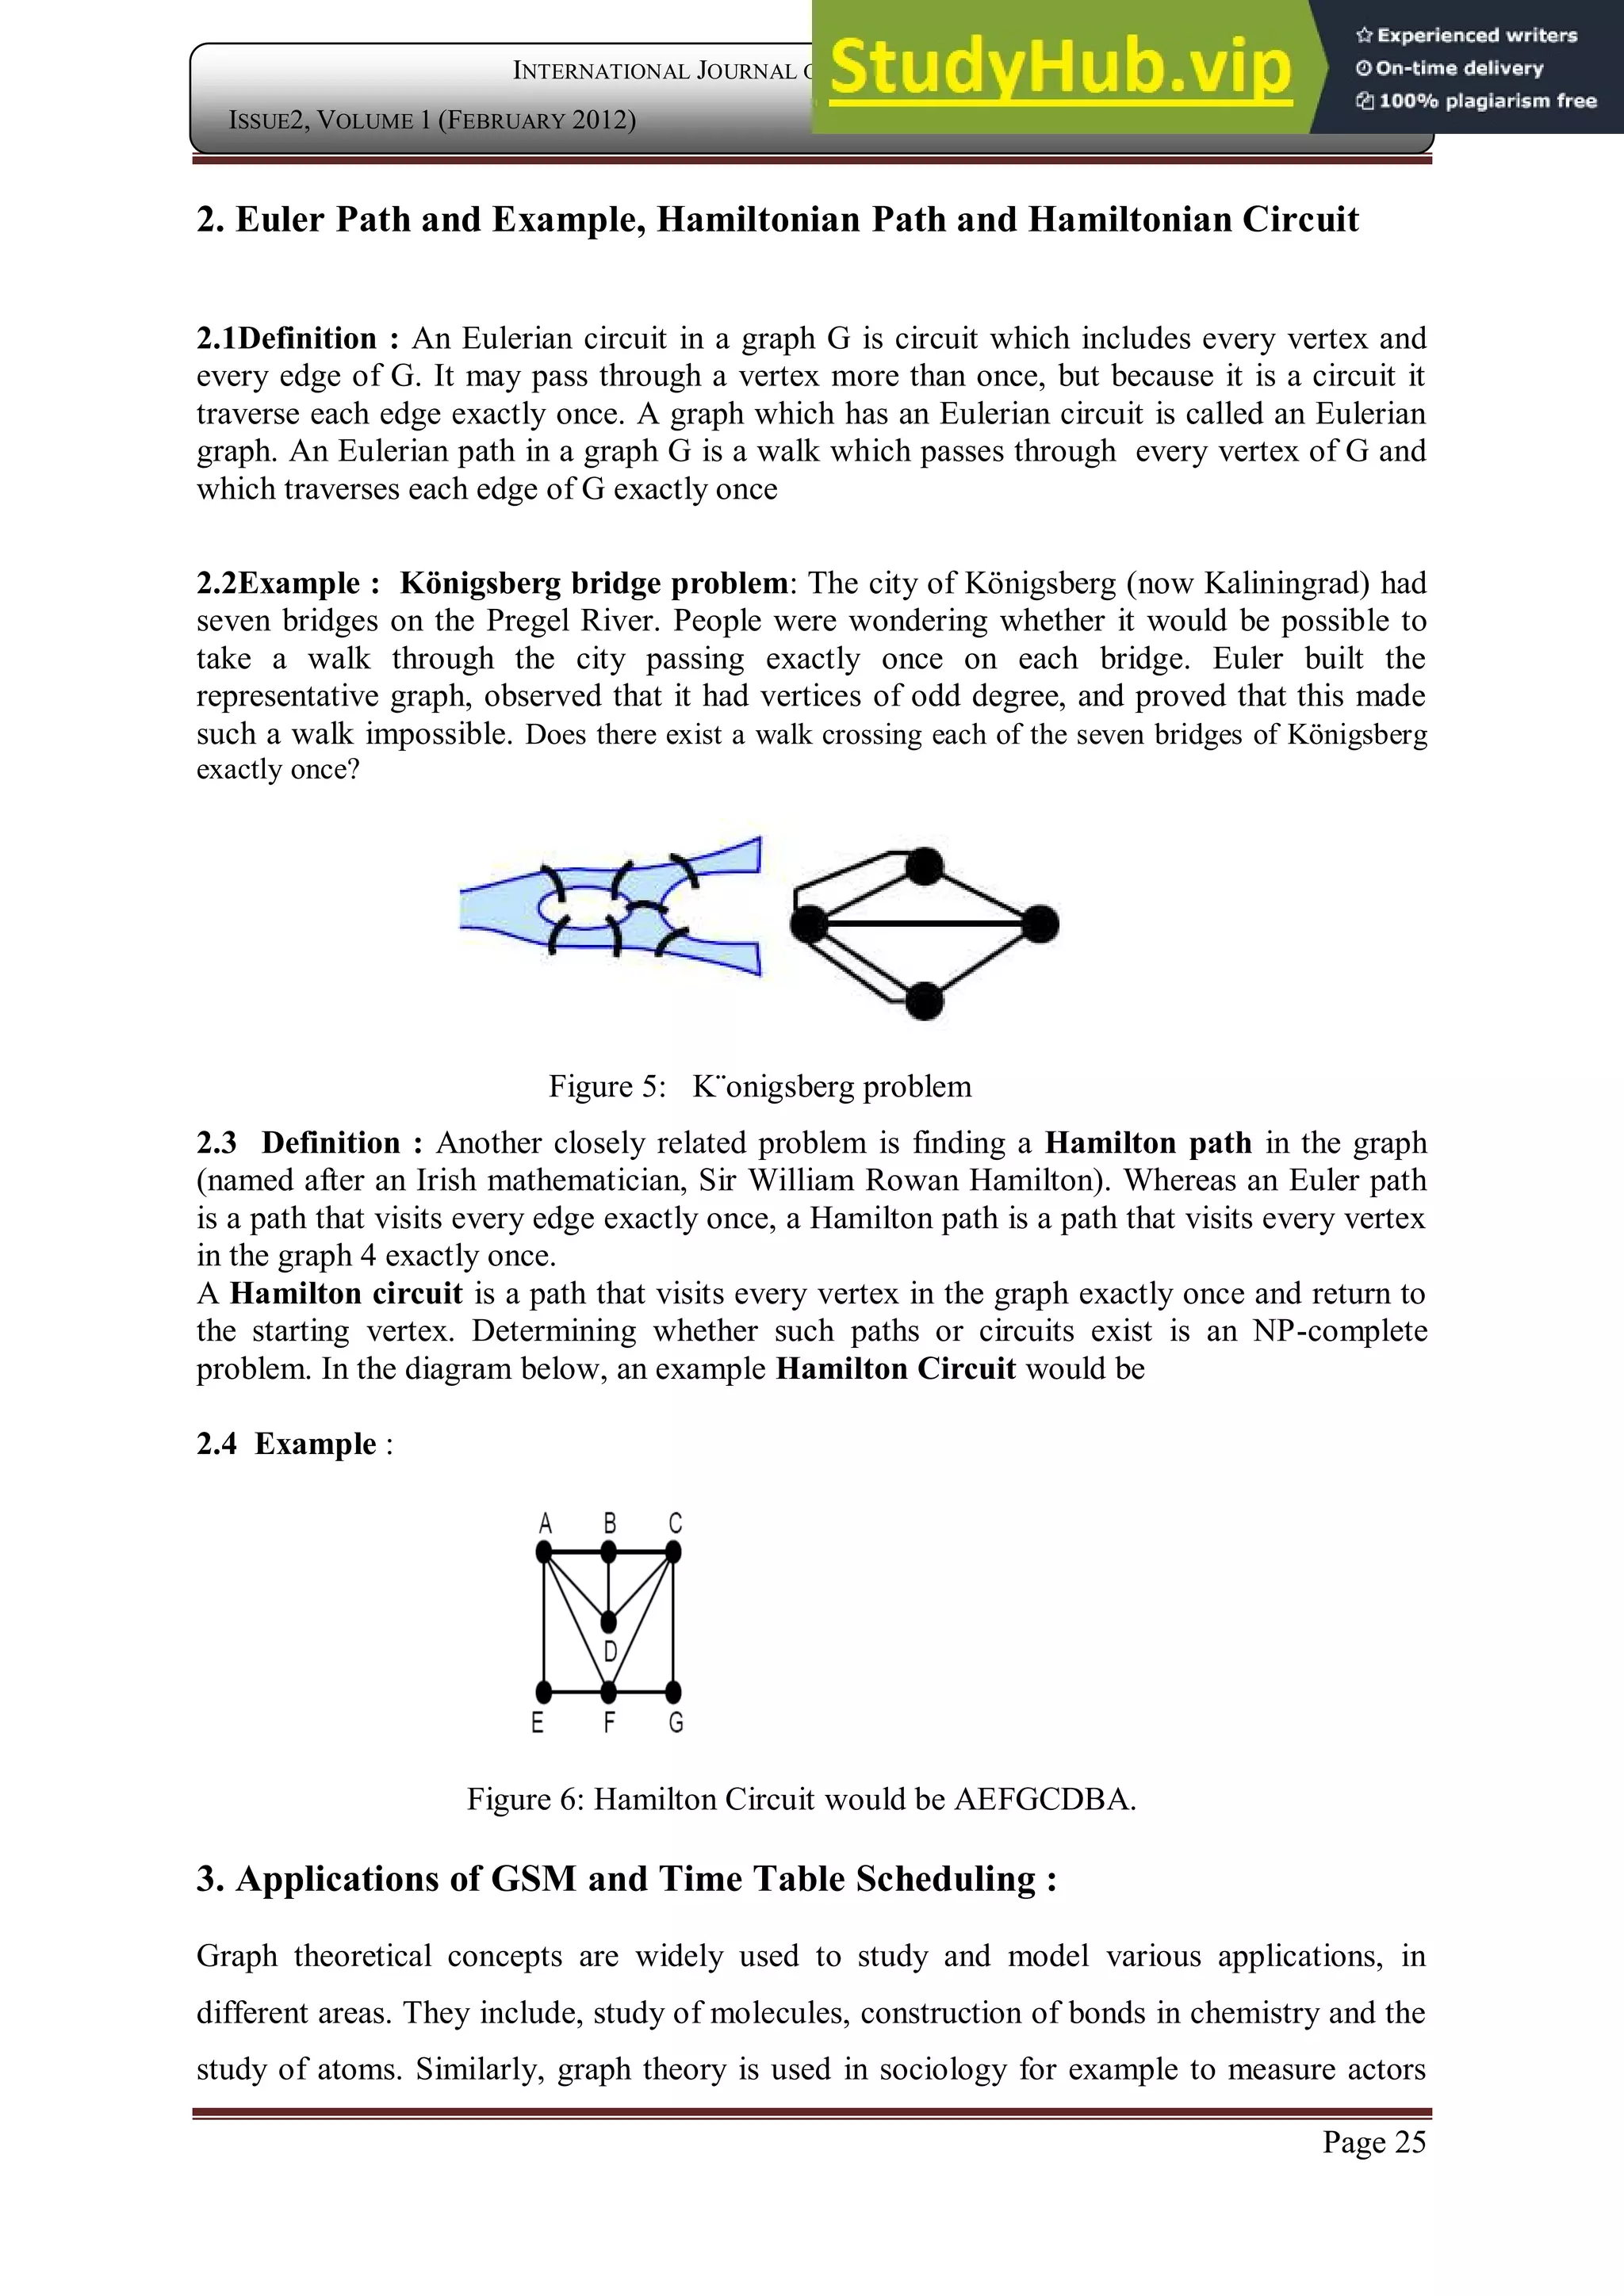
3.4Time table scheduling:
Allocation of classes and subjects to the Teachers is one of the major issues if the constraints
are complex. Graph theory plays an important role in this problem. For „t‟ Teachers with „n‟
subjects the available number of „p‟ periods timetable has to be prepared. This is done as
follows. A bipartite graph (or bigraph is a graph whose vertices can be divided into two
disjoint sets U and V such that every edge connects a vertex in U to one in V; that is, U and V
are independent sets) G where the vertices are the number of Faculty say t1, t2, t3, t4, …….
tk and n number of subjects say n1, n2, n3, n4, ……. nm such that the vertices are
connected by „pi‟ edges. It is presumed that at any one period each Teacher can teach at most
one subject and that each subject can be taught by maximum one Teacher. Consider the first
period. The timetable for this single period corresponds to a matching in the graph and
conversely, each matching corresponds to a possible assignment of Teacher to subjects taught
during that period. So, the solution for the timetabling problem will be obtained by
partitioning the edges of graph G into minimum number of matching. Also the edges have to
be colored with minimum number of colors. This problem can also be solved by vertex
coloring algorithm. “ The line graph L(G) of G has equal number of vertices and edges of G
and two vertices in L(G) are connected by an edge iff the corresponding edges of G have a
vertex in common. The line graph L(G) is a simple graph and a proper vertex coloring of
L(G) gives a proper edge coloring of G by the same number of colors. So, the problem can be
solved by
finding minimum proper vertex coloring of L(G).” For example, Consider there are 4
Teachers namely t1, t2, t3, t4,. and 5 subjects say n1, n2, n3, n4, n5 to be taught. The
teaching requirement matrix p = [pij] is given as.](https://image.slidesharecdn.com/applicationsofgraphtheoryinhumanlife-230806124232-3419b17c/75/APPLICATIONS-OF-GRAPH-THEORY-IN-HUMAN-LIFE-8-2048.jpg)
![Page 29
INTERNATIONAL JOURNAL OF COMPUTER APPLICATION
ISSUE2, VOLUME 1 (FEBRUARY 2012) ISSN: 2250-1797
P n1 n2 n3 n4 n5
t1 2 0 1 1 0
t2 0 1 0 1 0
t3 0 1 1 1 0
t4 0 0 0 1 1
Figure – 7: The teaching requirement matrix for four Teachers and five subjects
The bipartite graph is constructed as follows.
Figure – 8: Bipartite graph with 4 Teachers and 5 subjects
Finally, the authors found that proper coloring of the above mentioned graph can be done by
4 colors using the vertex coloring algorithm which leads to the edge coloring of the bipartite
multigraph G. Four colors are interpreted to four periods
…. 1 2 3 4
t1 n1 n2 n3 n4
Figure – 9: The schedule for the four subjects
References:
[1] Gian Luca Marcialis, Fabio Roli, Alessandra Serrau, “Graph Based and Structural
Methods for Fingerprint Classification, Springer verlag, Berlin Heidelberg 2007
[2] John.P.Hayes, “A graph Model for Fault Tolerant Computing Systems”, IEEE September
1976
[3] Narasingh Deo, “Graph theory with applications to engineering and computer science”,
Prentice Hall of India, 1990.](https://image.slidesharecdn.com/applicationsofgraphtheoryinhumanlife-230806124232-3419b17c/75/APPLICATIONS-OF-GRAPH-THEORY-IN-HUMAN-LIFE-9-2048.jpg)
![Page 30
INTERNATIONAL JOURNAL OF COMPUTER APPLICATION
ISSUE2, VOLUME 1 (FEBRUARY 2012) ISSN: 2250-1797
[4] Perri Mehonen, Janne Riihijarvi, Marina Petrova, “Automatic Channel allocation for
small wireless area networks using graph coloring algorithm approach”, IEEE 2004
[5] Shariefuddin Pirzada and Ashay Dharwadker, “Journal of the Korean Society for
Industrial and applied Mathematics, Volume 11, No.4, 2007
[6] Sven Dickinson, Pelillo, Ramin Zabih, “Introduction to the special section on graph
algorithms in computer vision”, IEEE on pattern analysis, Vol 23 No. 10, September 2001
[7] V.P.Eswaramoorthy, “New algorithm for analyzing performance of neighbourhood
strategies in solving job shop scheduling problems,
[8] International Journal of Engineering Science and Technology Vol. 2(9), 2010, 4610-4621.
[9] International Journal of Mathematical Archieve-2(11),2011,Page 2113-2118.](https://image.slidesharecdn.com/applicationsofgraphtheoryinhumanlife-230806124232-3419b17c/75/APPLICATIONS-OF-GRAPH-THEORY-IN-HUMAN-LIFE-10-2048.jpg)

1. The document discusses applications of graph theory in designing a GSM network operated by Bharat Sanchar Nigam Limited. Graph theory techniques are used to determine the base station identity code, hopping sequence number, and location area code. 2. Graph theory is also applied to solve optimization and scheduling problems in GSM radio network planning. Classical applications of graph theory concepts like graph coloring, Eulerian graphs, and Hamiltonian graphs are discussed. 3. The origins of graph theory are traced back to problems like the Koinsberg bridge problem in the 18th century. Key developments that helped establish graph theory as a field are highlighted, including work in the 19th century on planar graphs, trees, and