Downloaded 30 times
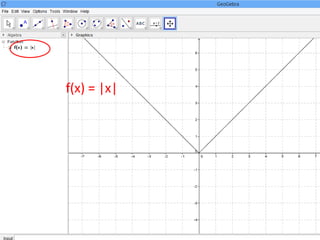
![f(x) =[x]](https://image.slidesharecdn.com/graphplottingusinggeogebra-131225081912-phpapp02/85/Graph-plotting-using-GeoGebra-15-320.jpg)
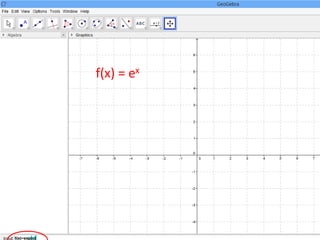
![f(x) =[x]](https://image.slidesharecdn.com/graphplottingusinggeogebra-131225081912-phpapp02/85/Graph-plotting-using-GeoGebra-16-320.jpg)
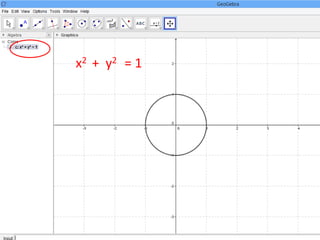
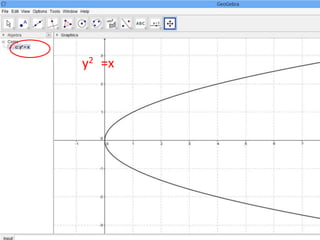
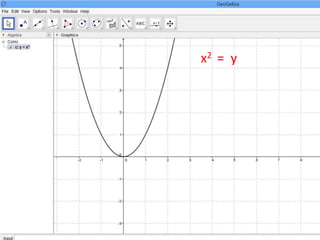
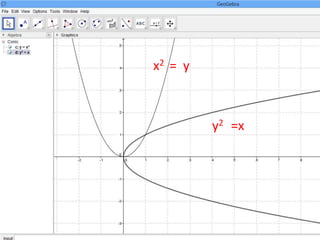
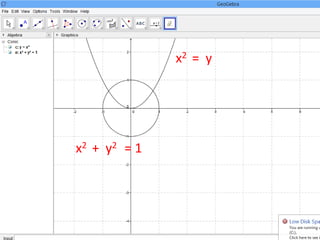
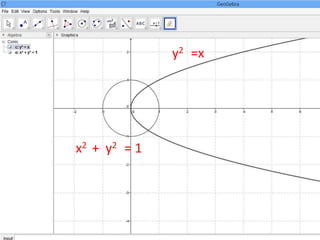
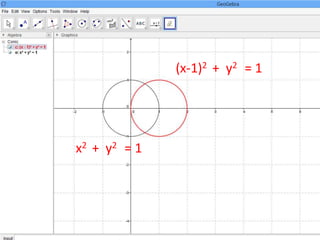
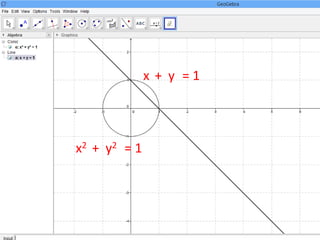

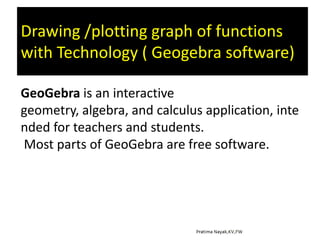
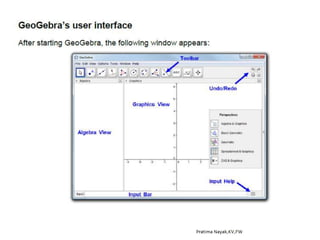
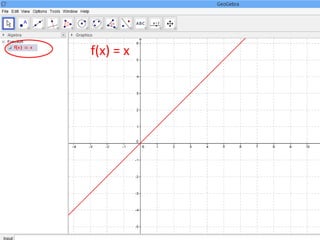
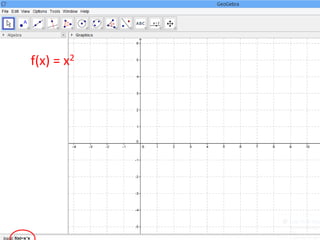
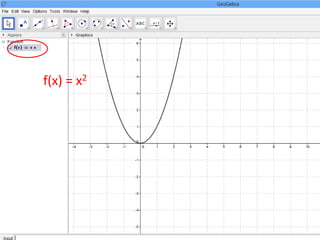
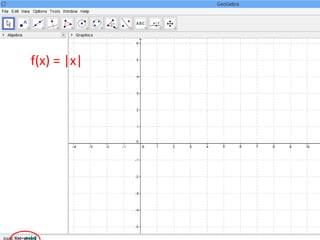
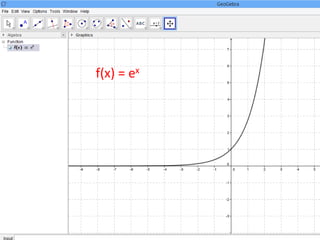
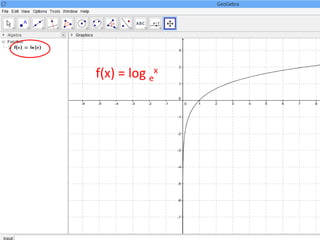
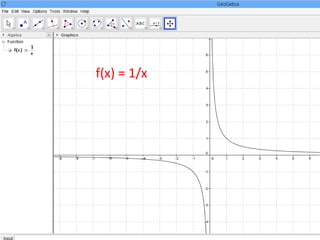
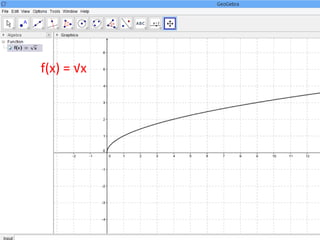
The document discusses using the GeoGebra software to plot and graph functions. GeoGebra is a free interactive geometry, algebra, and calculus application for teachers and students. The document provides examples of functions that can be entered into GeoGebra, such as linear, quadratic, absolute value, exponential, and logarithmic functions. It also provides examples of equations that can be graphed, including circles and lines.