Download to read offline


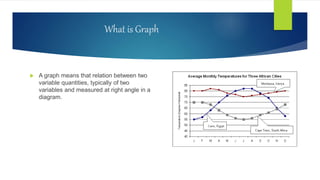
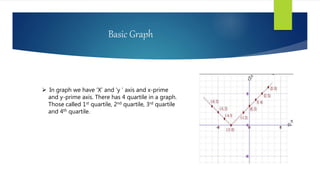
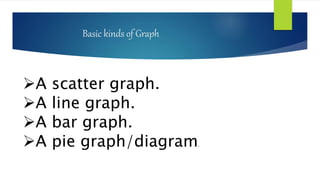
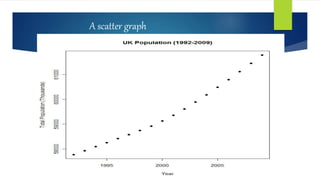
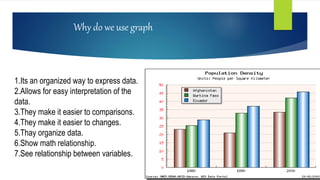
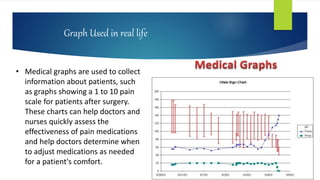


The presentation by students from Daffodil International University outlines the concept and importance of graphs, detailing their structure, types, and uses in various fields including academia and corporate settings. Graphs are highlighted as essential tools for organizing and interpreting data, facilitating comparisons, and demonstrating relationships between variables. Additionally, real-life applications, such as medical graphs used for patient assessments, are discussed.


![Statistics -copy_-_copy[1]](https://cdn.slidesharecdn.com/ss_thumbnails/statistics-copy-copy1-150503082441-conversion-gate02-thumbnail.jpg?width=640&height=640&fit=bounds)


