![Challenges of Simulation
• Need a simulation platforms to
• Make meaningful predictions of design alternatives and early software development,
as well as to be able to assess the performance of a system.
• Current state-of-the-art sequential simulators leverage
• SystemC [11], binary translation [18], smart sampling techniques [12] or tunable
abstraction levels [13] for hardware description.
• The major limiting factors in utilizing current simulation methodologies is
simulation speed.
7](https://image.slidesharecdn.com/gpuaccelerationforsimulatingmassivelyparallelmany-coreplatforms-150505052639-conversion-gate01/75/Gpu-acceleration-for-simulating-massively-parallel-many-core-platforms-7-2048.jpg)
![Parallel simulators
• Simulating a parallel system is an inherently parallel task.
• Individual processor simulation can be independently proceed until the point where
communication or synchronization with other processors is required.
• Parallel simulators have been proposed in the past [14], [15], [16]
• Leverage the availability of multiple physical processing nodes to increase the
simulation rate.
• Too costly if server clusters or computing farms are adopted as a target to
run the many-core coprocessor simulations.
9](https://image.slidesharecdn.com/gpuaccelerationforsimulatingmassivelyparallelmany-coreplatforms-150505052639-conversion-gate01/75/Gpu-acceleration-for-simulating-massively-parallel-many-core-platforms-9-2048.jpg)
![Advantage of GPGPU
• Scalable computation power and flexibility is delivered at a rather low cost
by commodity GPU hardware.
• The programmability of GPUs also has been significantly increased in the
last 5 years [17], [19].
• Developing a novel parallel simulation technology that leverages the
computational power of widely-available and low-cost GPUs.
11](https://image.slidesharecdn.com/gpuaccelerationforsimulatingmassivelyparallelmany-coreplatforms-150505052639-conversion-gate01/75/Gpu-acceleration-for-simulating-massively-parallel-many-core-platforms-11-2048.jpg)
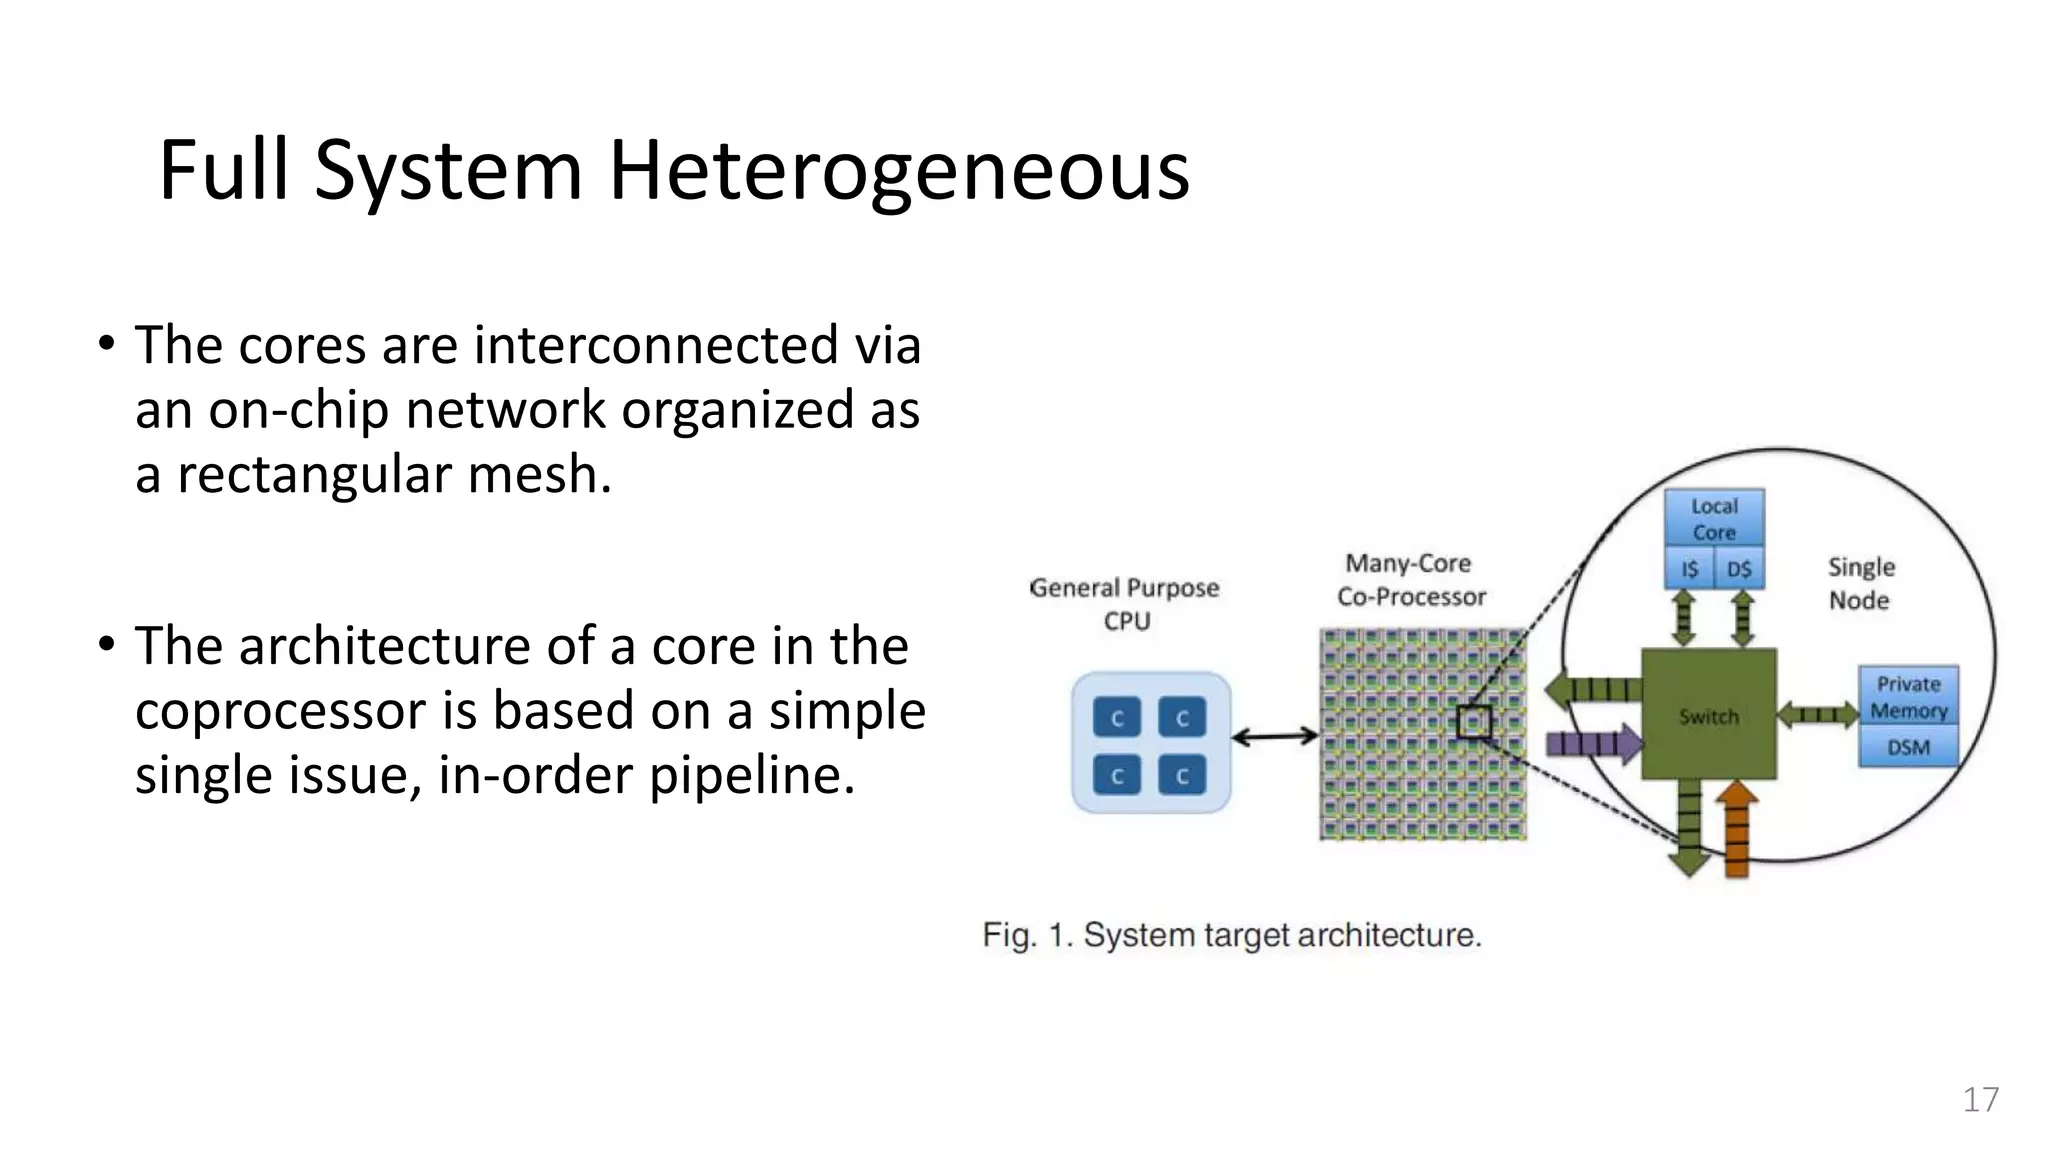
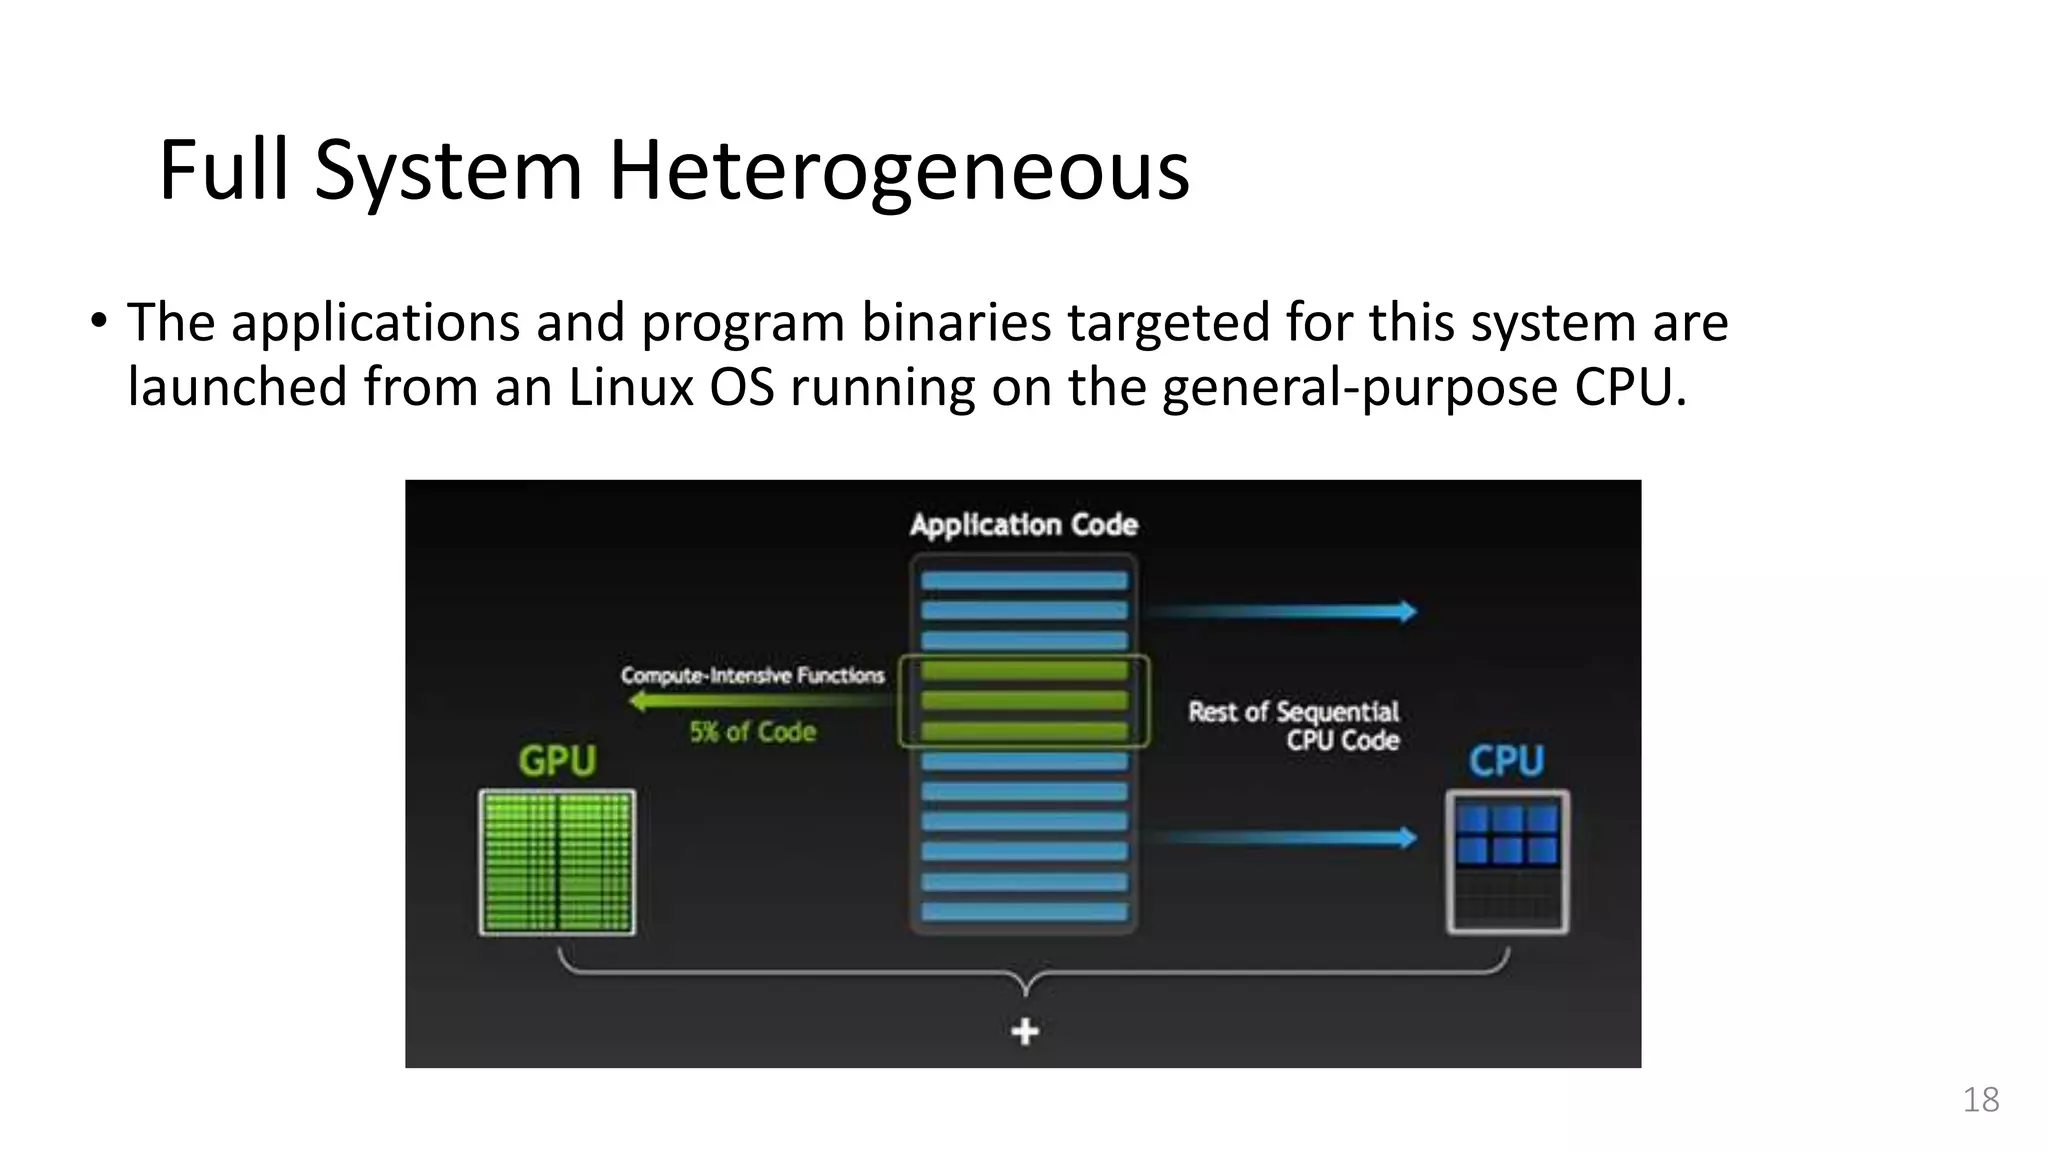
![Full System Heterogeneous
• Our target architecture is representative of future heterogeneous platforms.
• It consists of a general purpose processor connected with a many-core
coprocessor.
• While currently available many-core coprocessors only integrate up to
hundreds of cores interconnected via a network-on-chip (NoC) [5], [6], [8],
• In the future the number of cores is likely to increase to thousands [22].
15](https://image.slidesharecdn.com/gpuaccelerationforsimulatingmassivelyparallelmany-coreplatforms-150505052639-conversion-gate01/75/Gpu-acceleration-for-simulating-massively-parallel-many-core-platforms-15-2048.jpg)
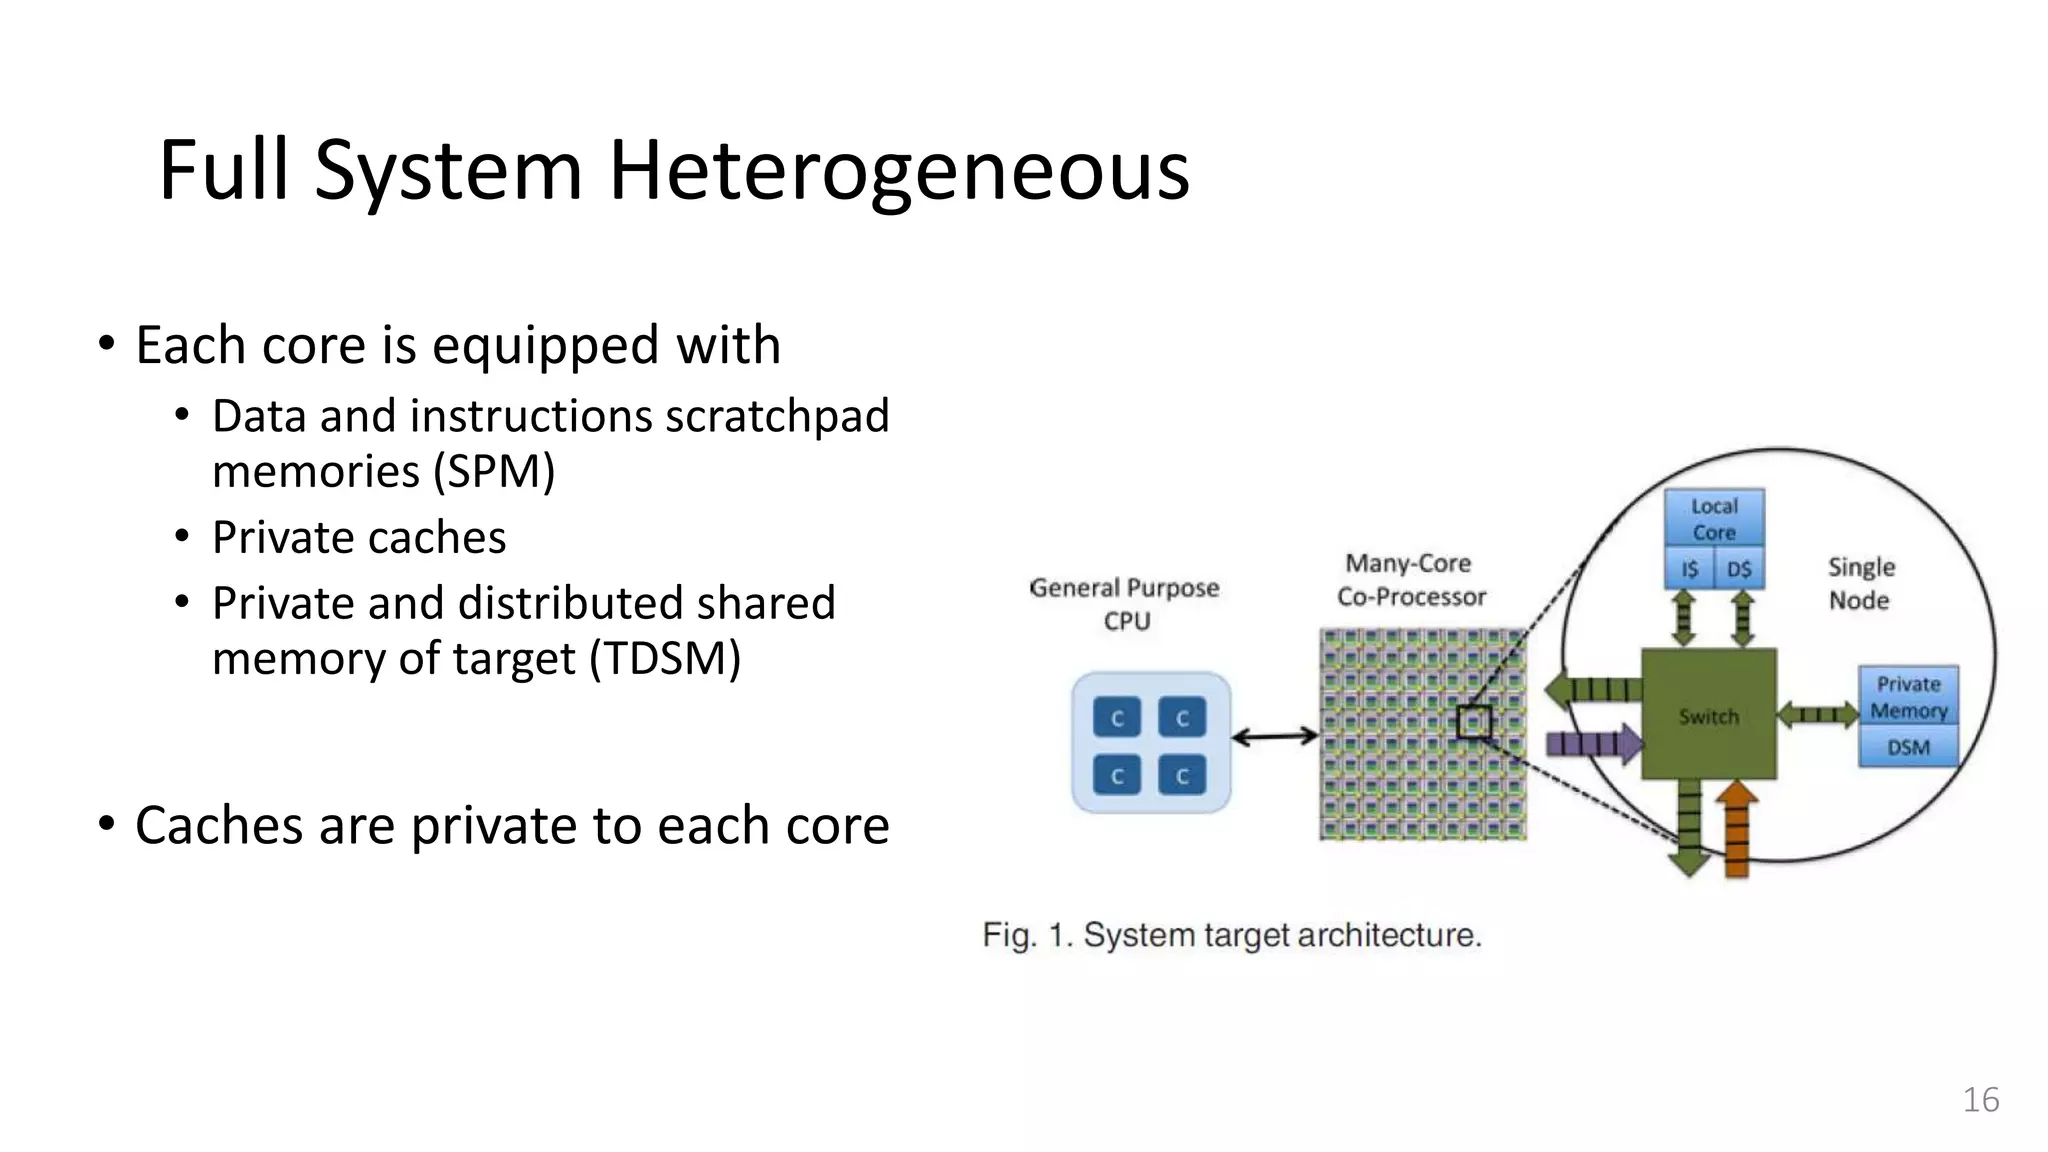
![Memory model of coprocessor
• The considered memory model of coprocessor applies the Partitioned
Global Address Space (PGAS) paradigm [20].
• Each thread mapped to a single node of target coprocessor has
• Private memory for local data items
• Shared memory for globally shared data values.
• Greater performance is achieved when a thread accesses data locally.
19](https://image.slidesharecdn.com/gpuaccelerationforsimulatingmassivelyparallelmany-coreplatforms-150505052639-conversion-gate01/75/Gpu-acceleration-for-simulating-massively-parallel-many-core-platforms-19-2048.jpg)
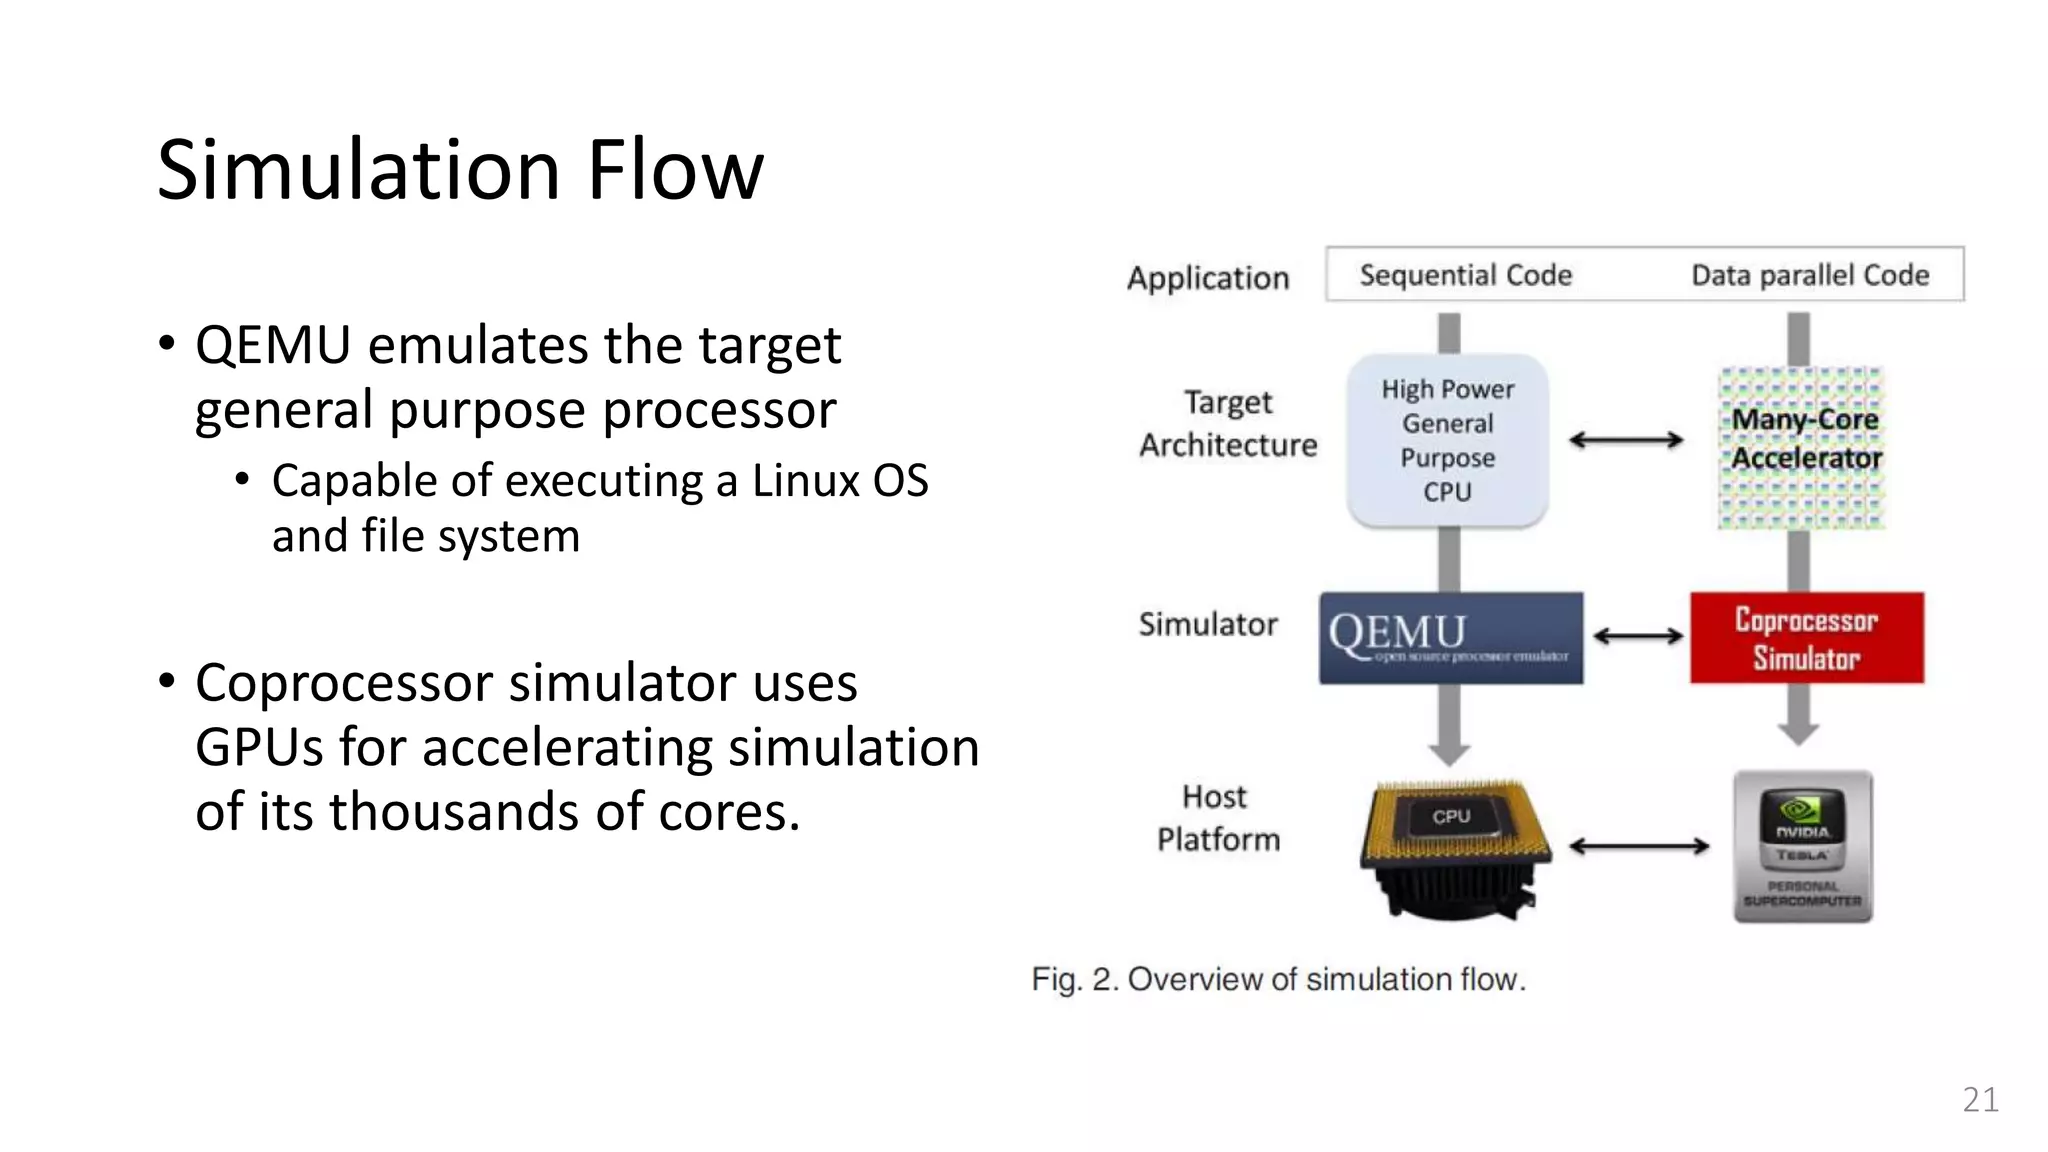
![QEMU
• To simulate general-purpose CPU, we selected QEMU [18]
• on an ARM Versatile Platform Baseboard featuring an ARM v7-
based processor and input-output devices.
• QEMU is a popular, open-source, fast emulation platform
based on dynamic binary translation,
• Provides a set of device models, enabling it to run a
variety of unmodified guest operating systems.
20](https://image.slidesharecdn.com/gpuaccelerationforsimulatingmassivelyparallelmany-coreplatforms-150505052639-conversion-gate01/75/Gpu-acceleration-for-simulating-massively-parallel-many-core-platforms-20-2048.jpg)
![Coprocessor Simulator
• Coprocessor simulator is entirely written using C for CUDA [17] and we map each
instance of a simulated node to a single CUDA thread.
• These CUDA threads are then mapped to streaming processors of GPU by its
hardware scheduler and run concurrently in parallel.
• Each target core model is written using an interpretation-based method to
simulate the ARM pipeline.
• Each simulated core is assigned its own context structure, which represents
register file, status flags, program counter, etc.
22](https://image.slidesharecdn.com/gpuaccelerationforsimulatingmassivelyparallelmany-coreplatforms-150505052639-conversion-gate01/75/Gpu-acceleration-for-simulating-massively-parallel-many-core-platforms-22-2048.jpg)
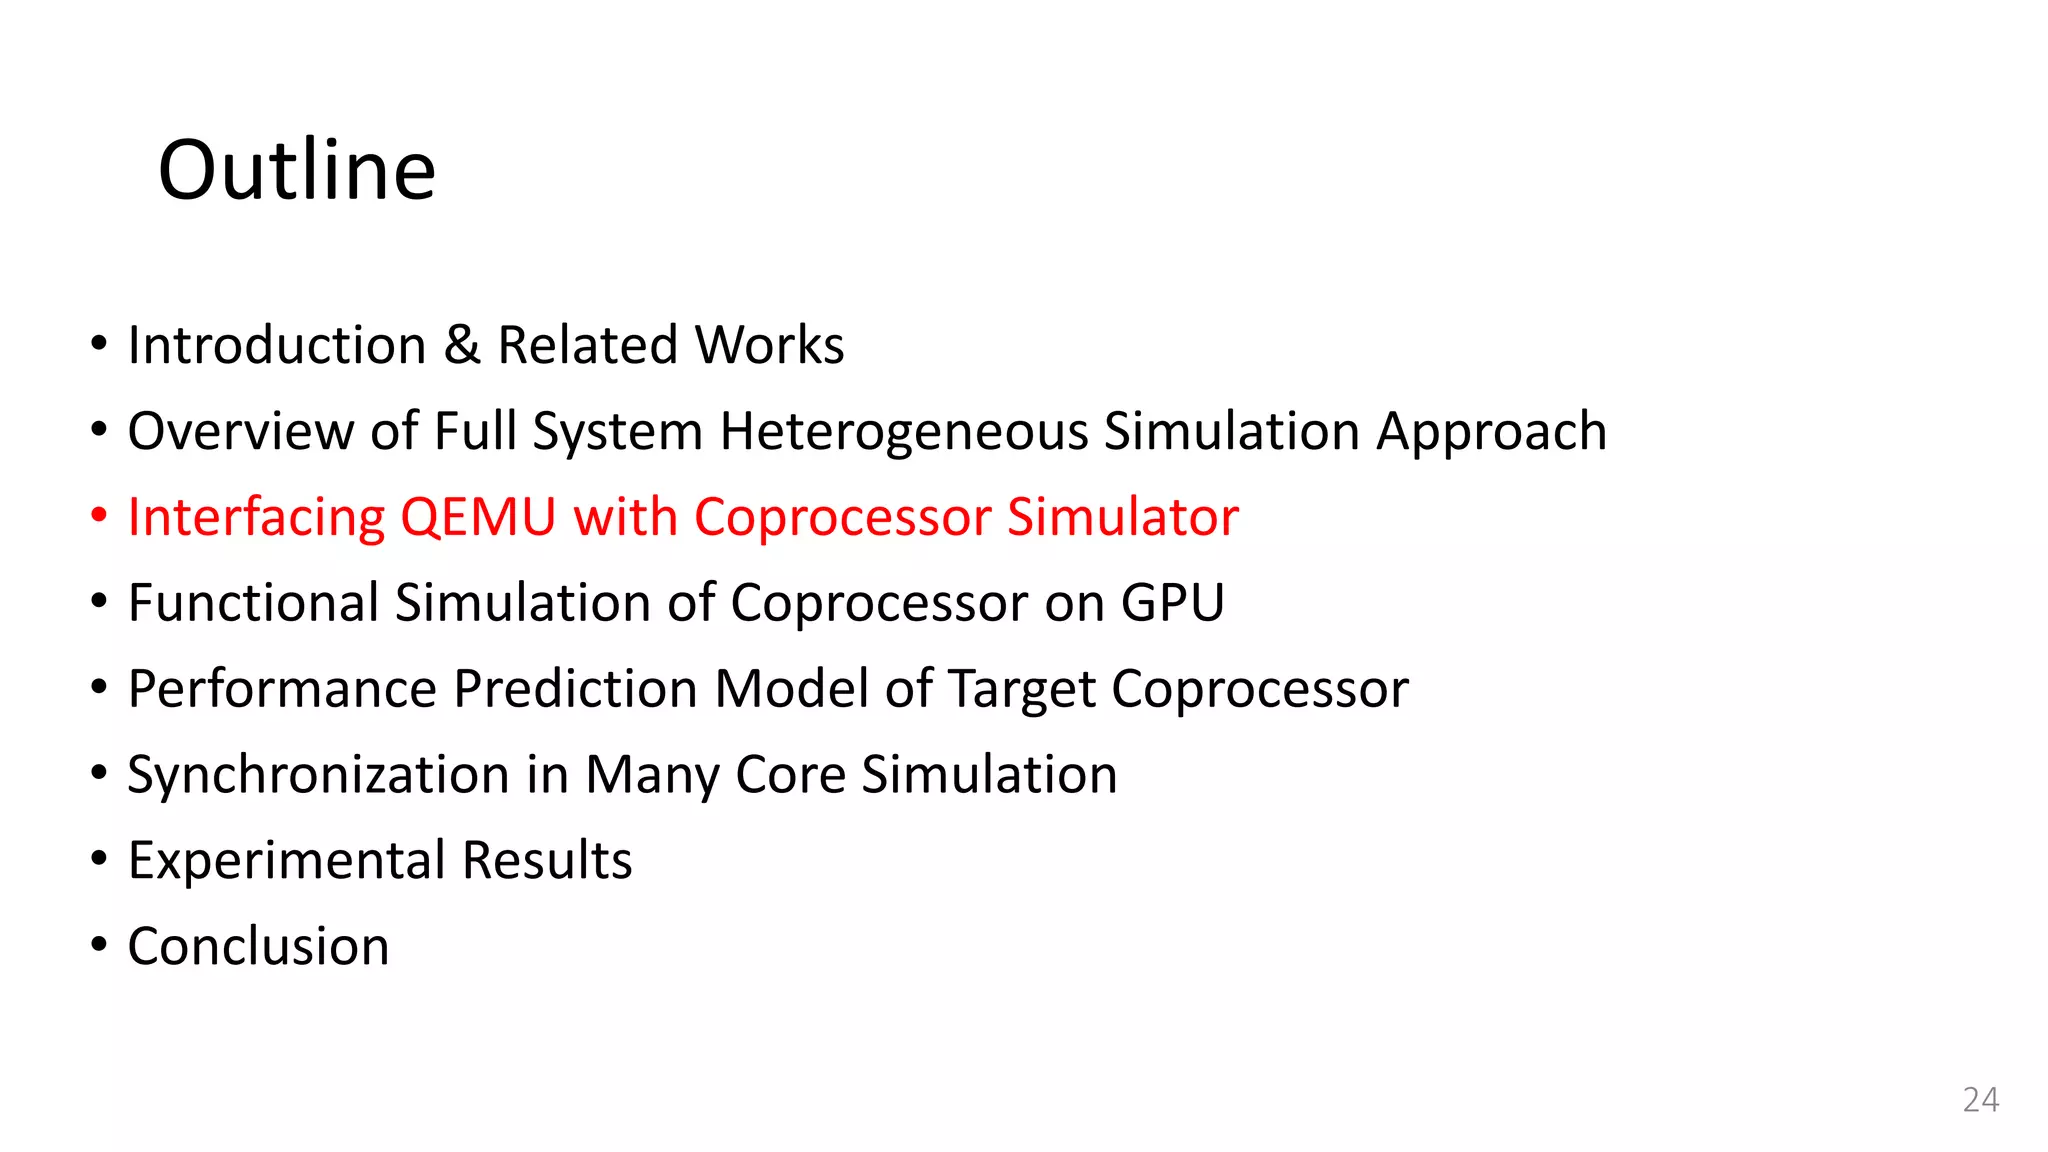
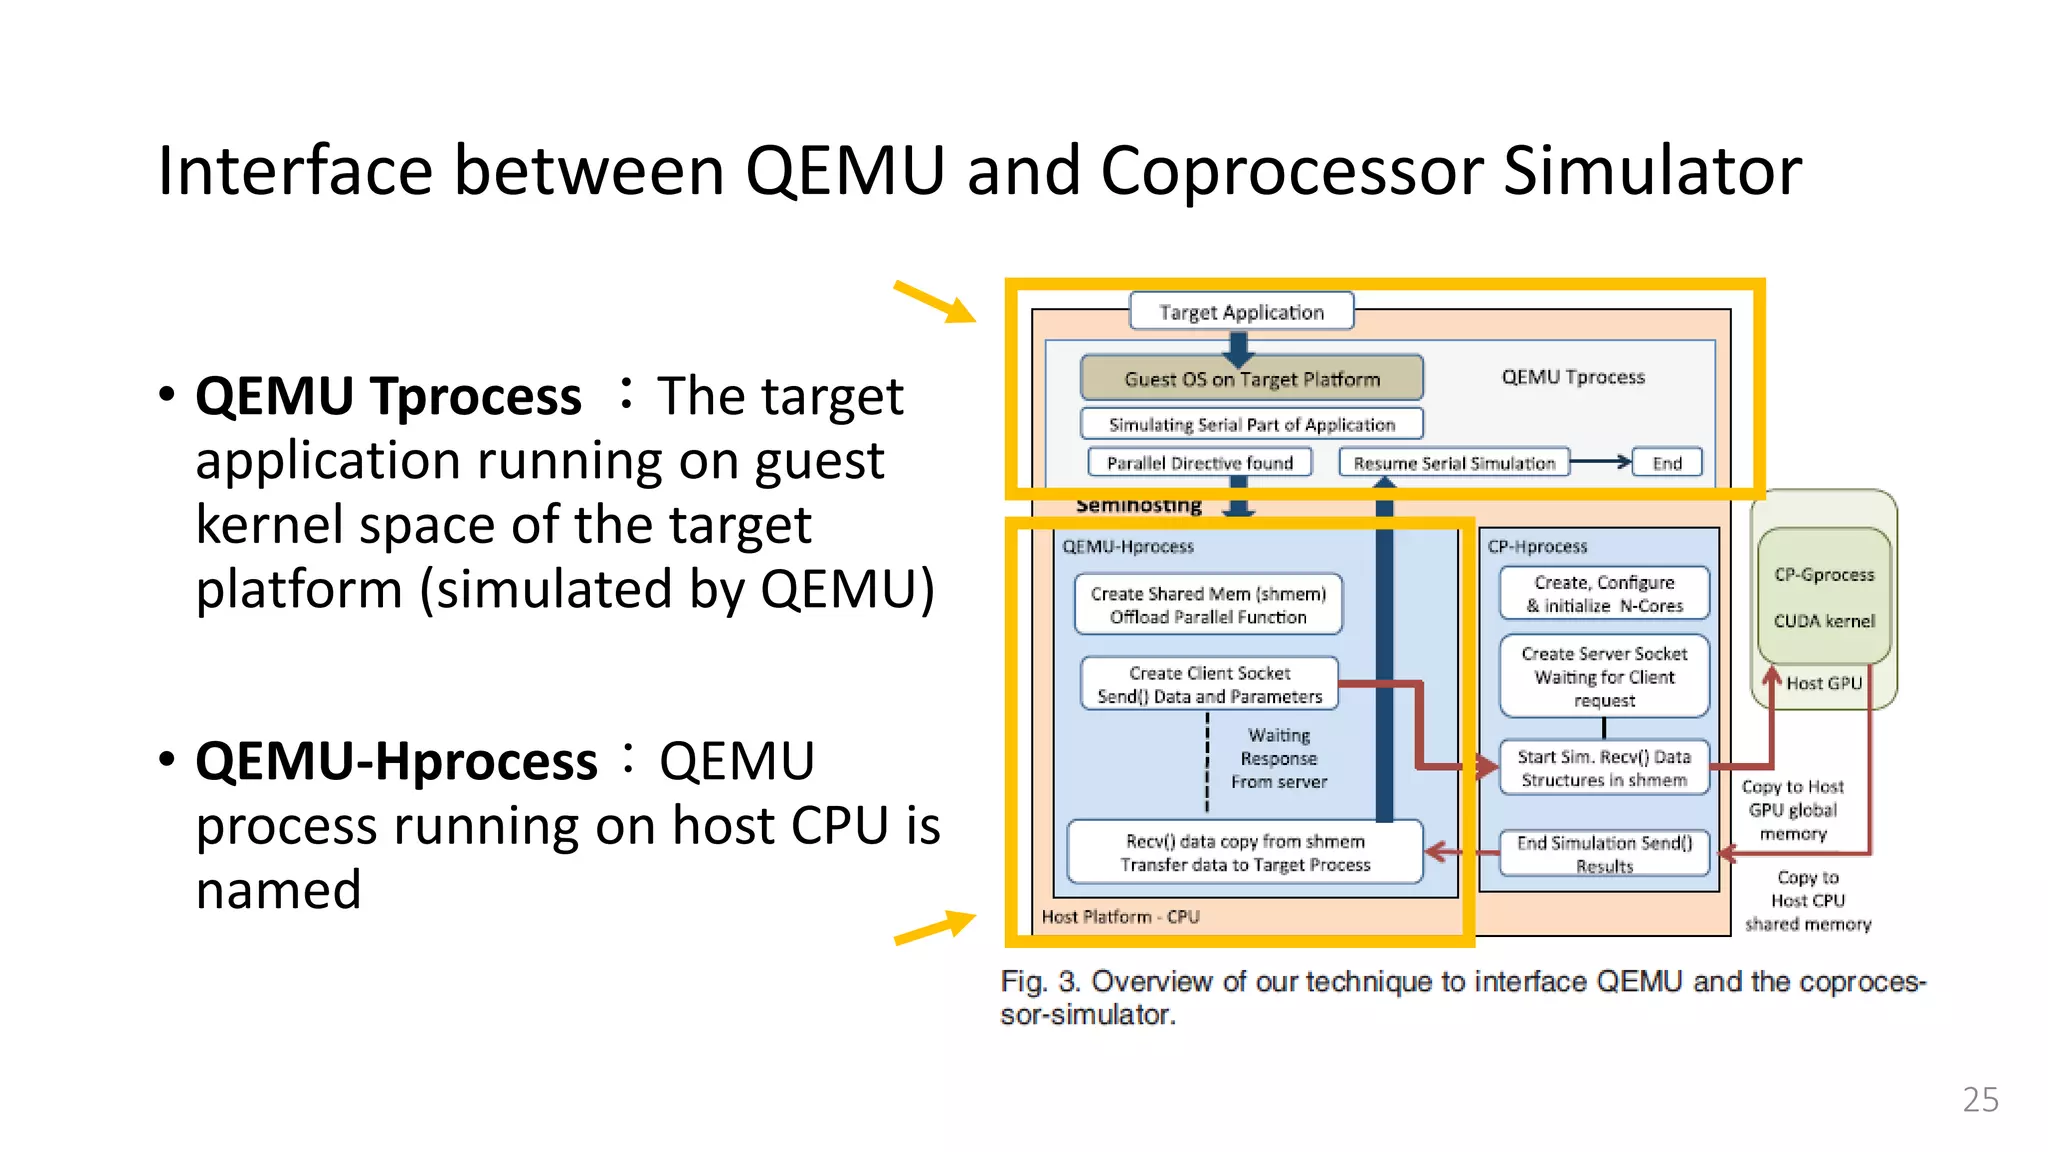
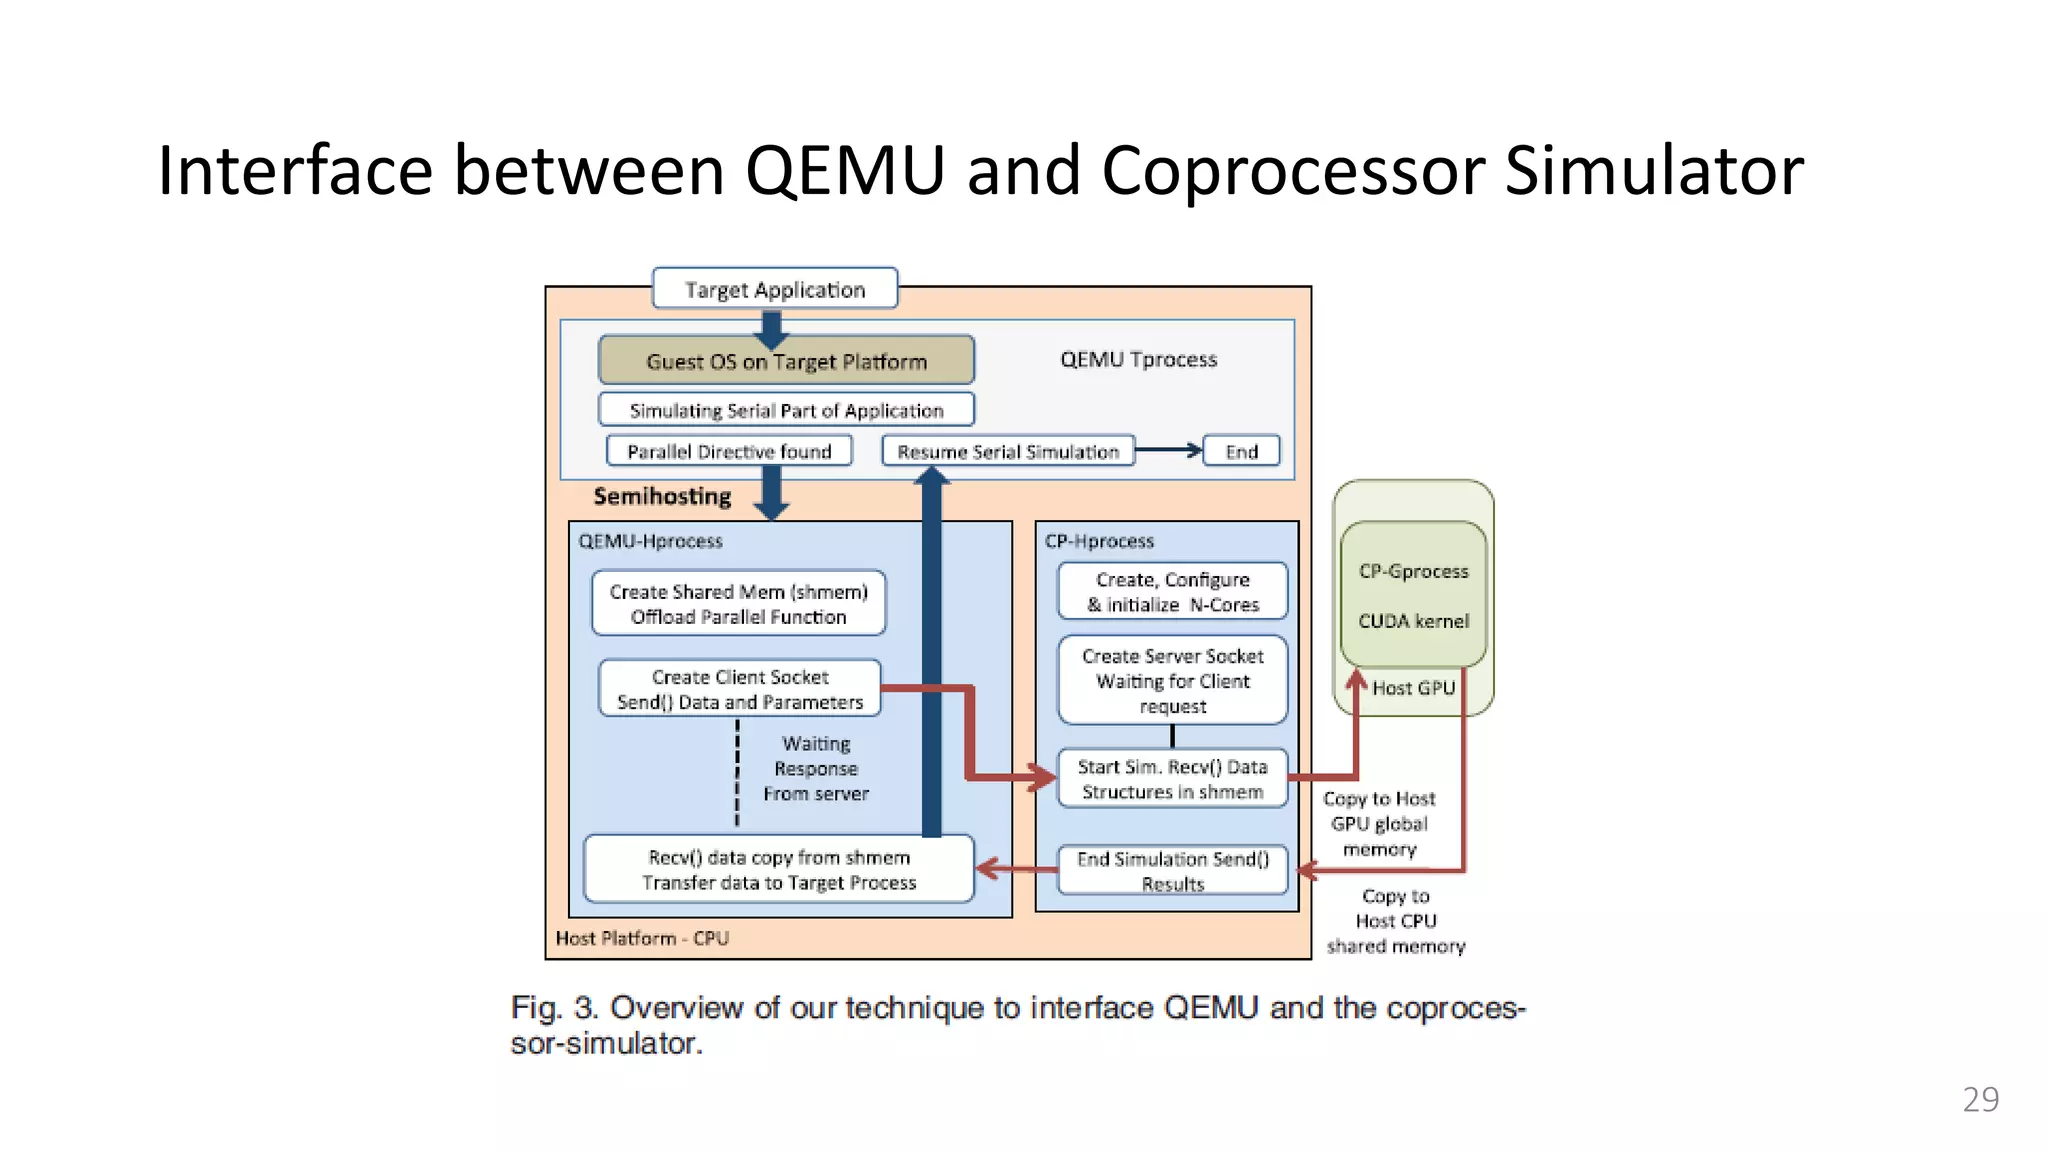
![Interface between QEMU and Coprocessor Simulator
• Target application needs to
forward requests (data structure
and parameters) between QEMU
and the coprocessor simulator.
• QEMU Tprocess →
QEMU-Hprocess → CP-Gprocess
• Use semihosting[25]
27](https://image.slidesharecdn.com/gpuaccelerationforsimulatingmassivelyparallelmany-coreplatforms-150505052639-conversion-gate01/75/Gpu-acceleration-for-simulating-massively-parallel-many-core-platforms-27-2048.jpg)
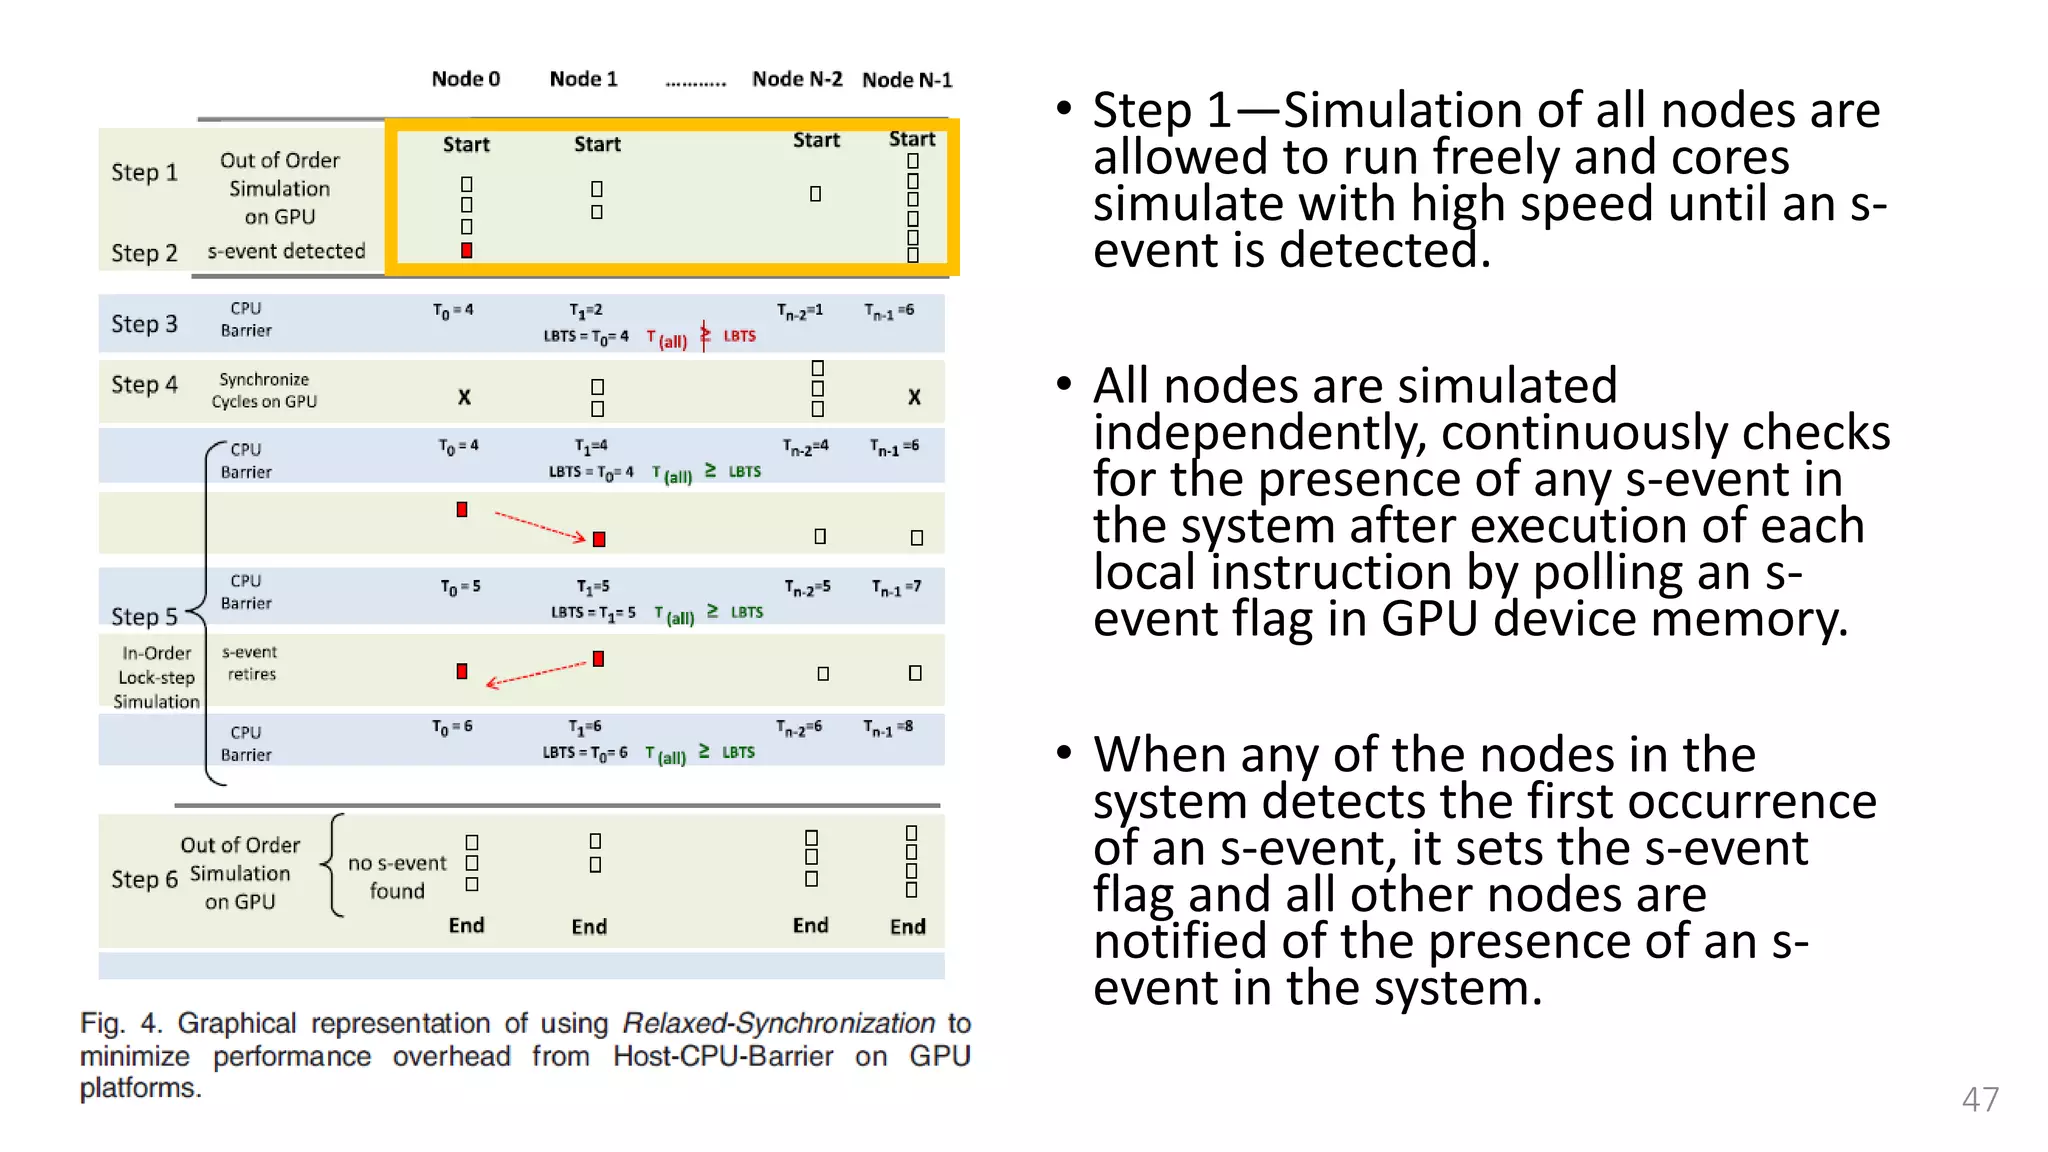
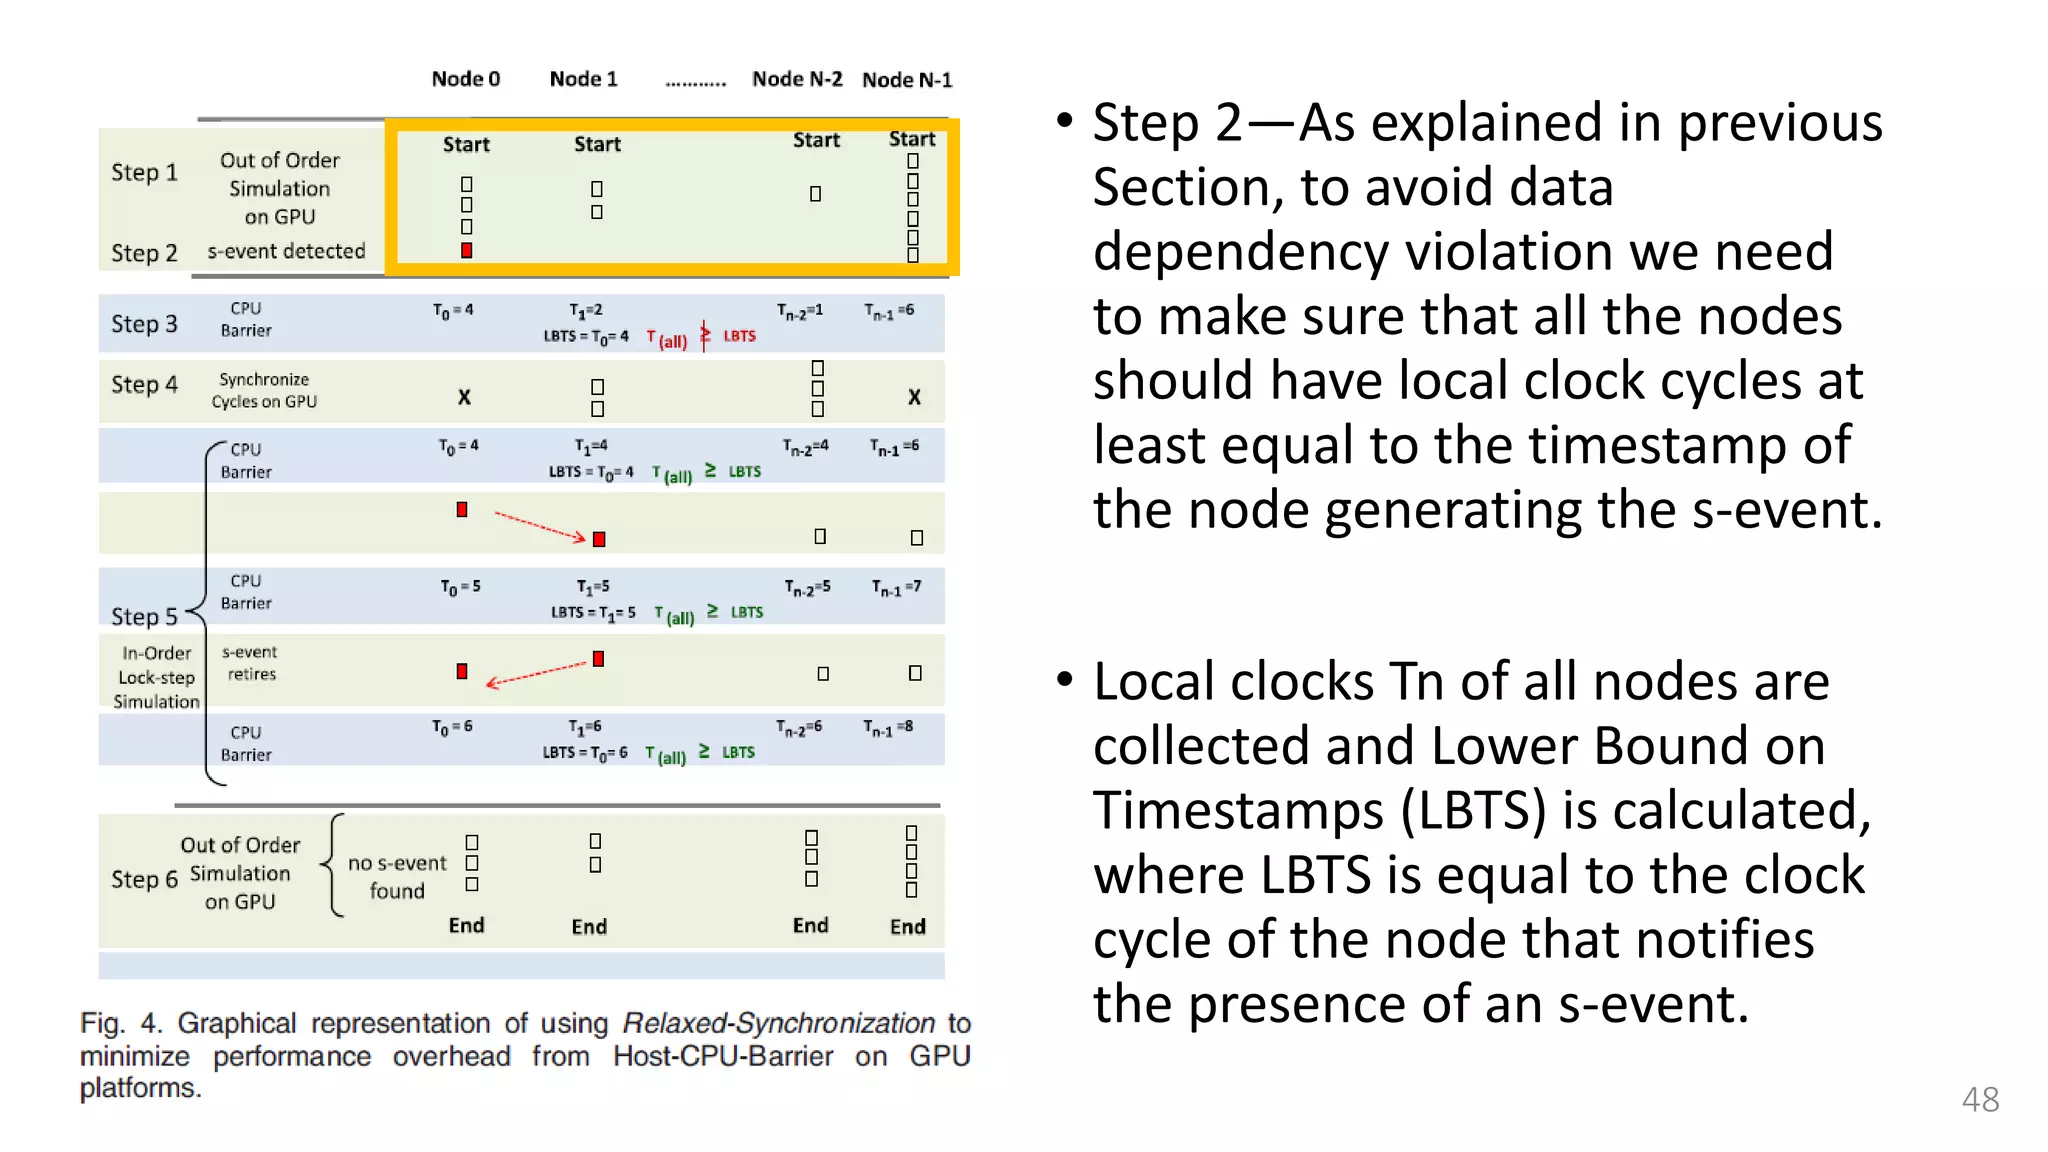
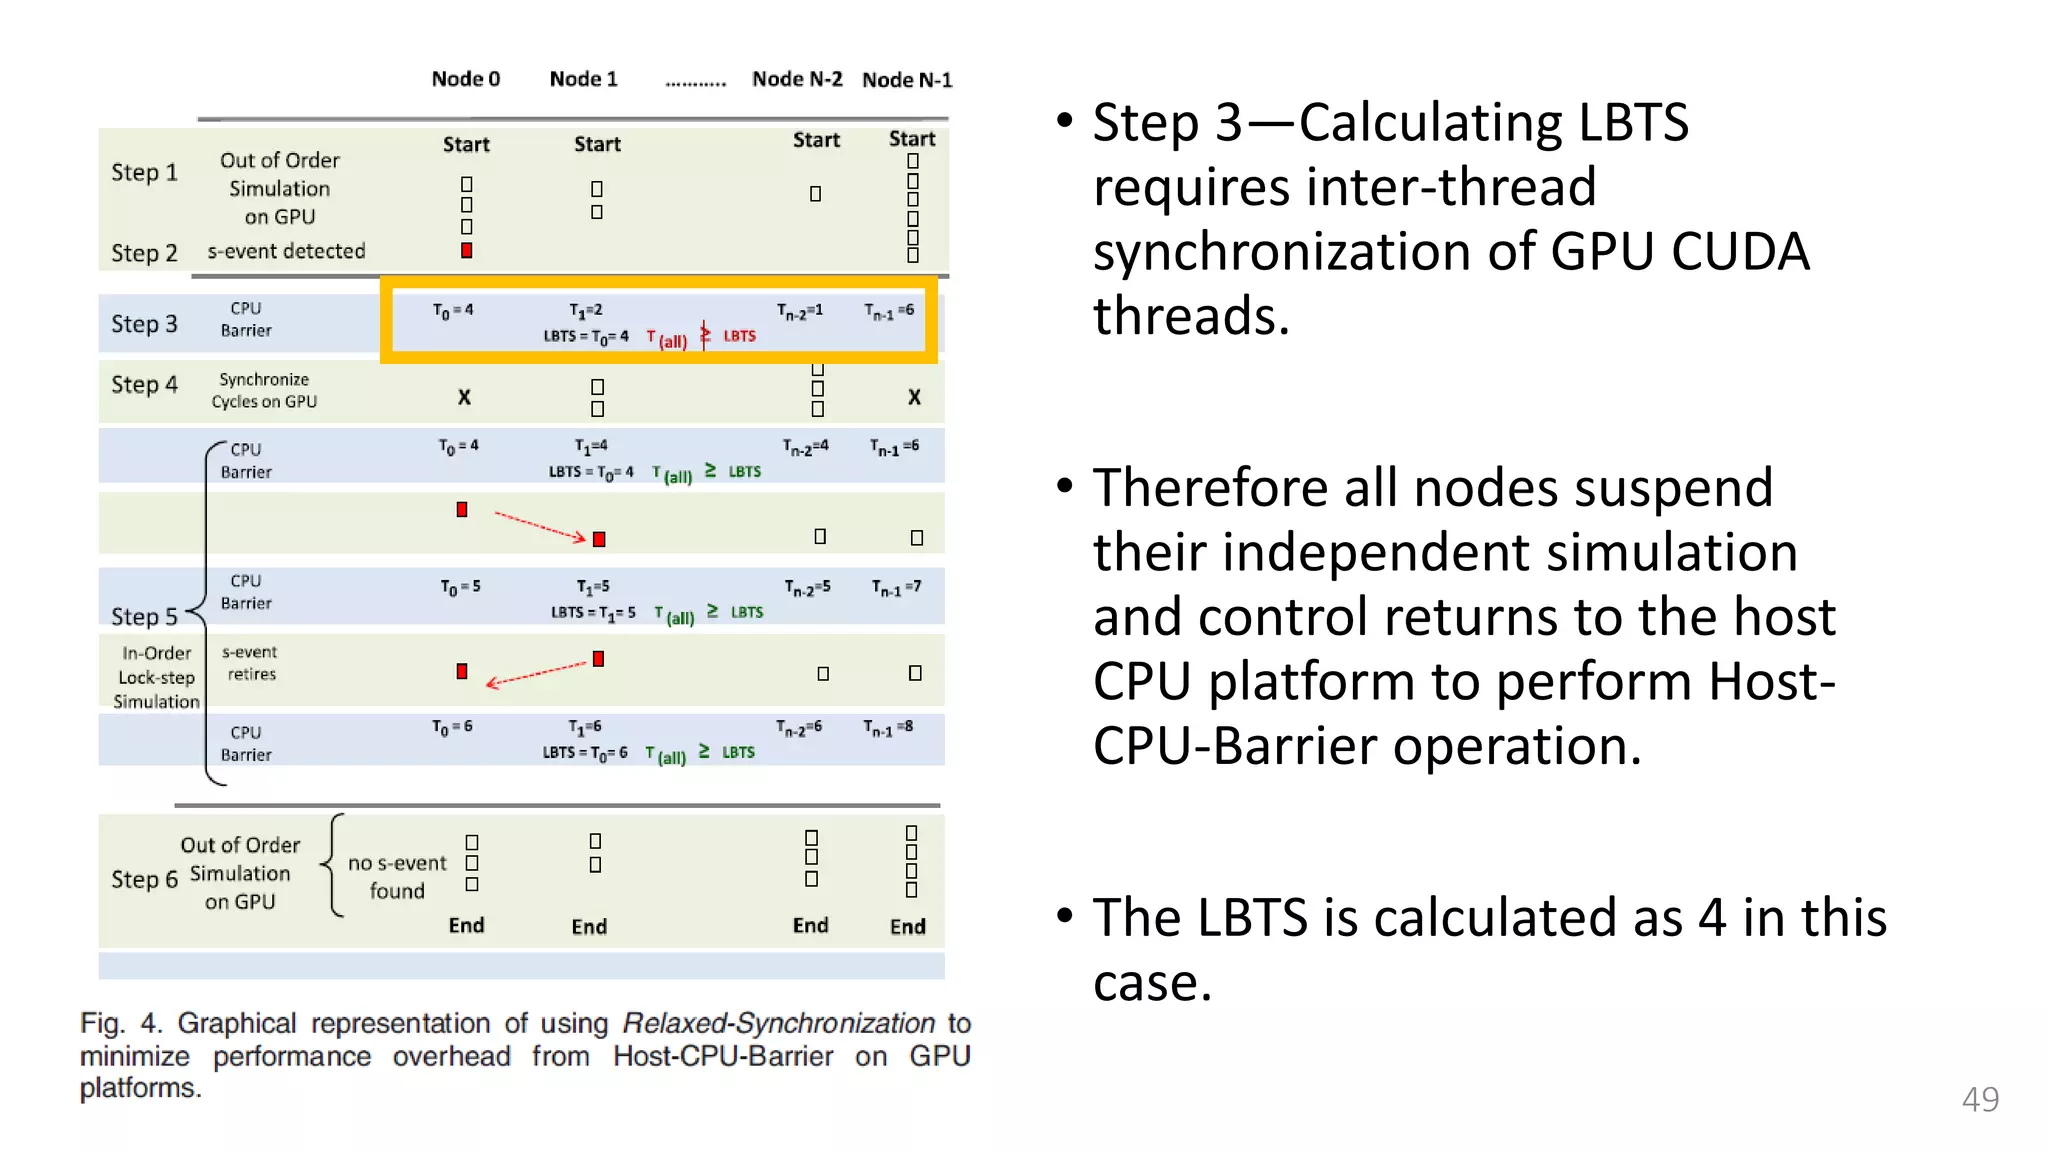
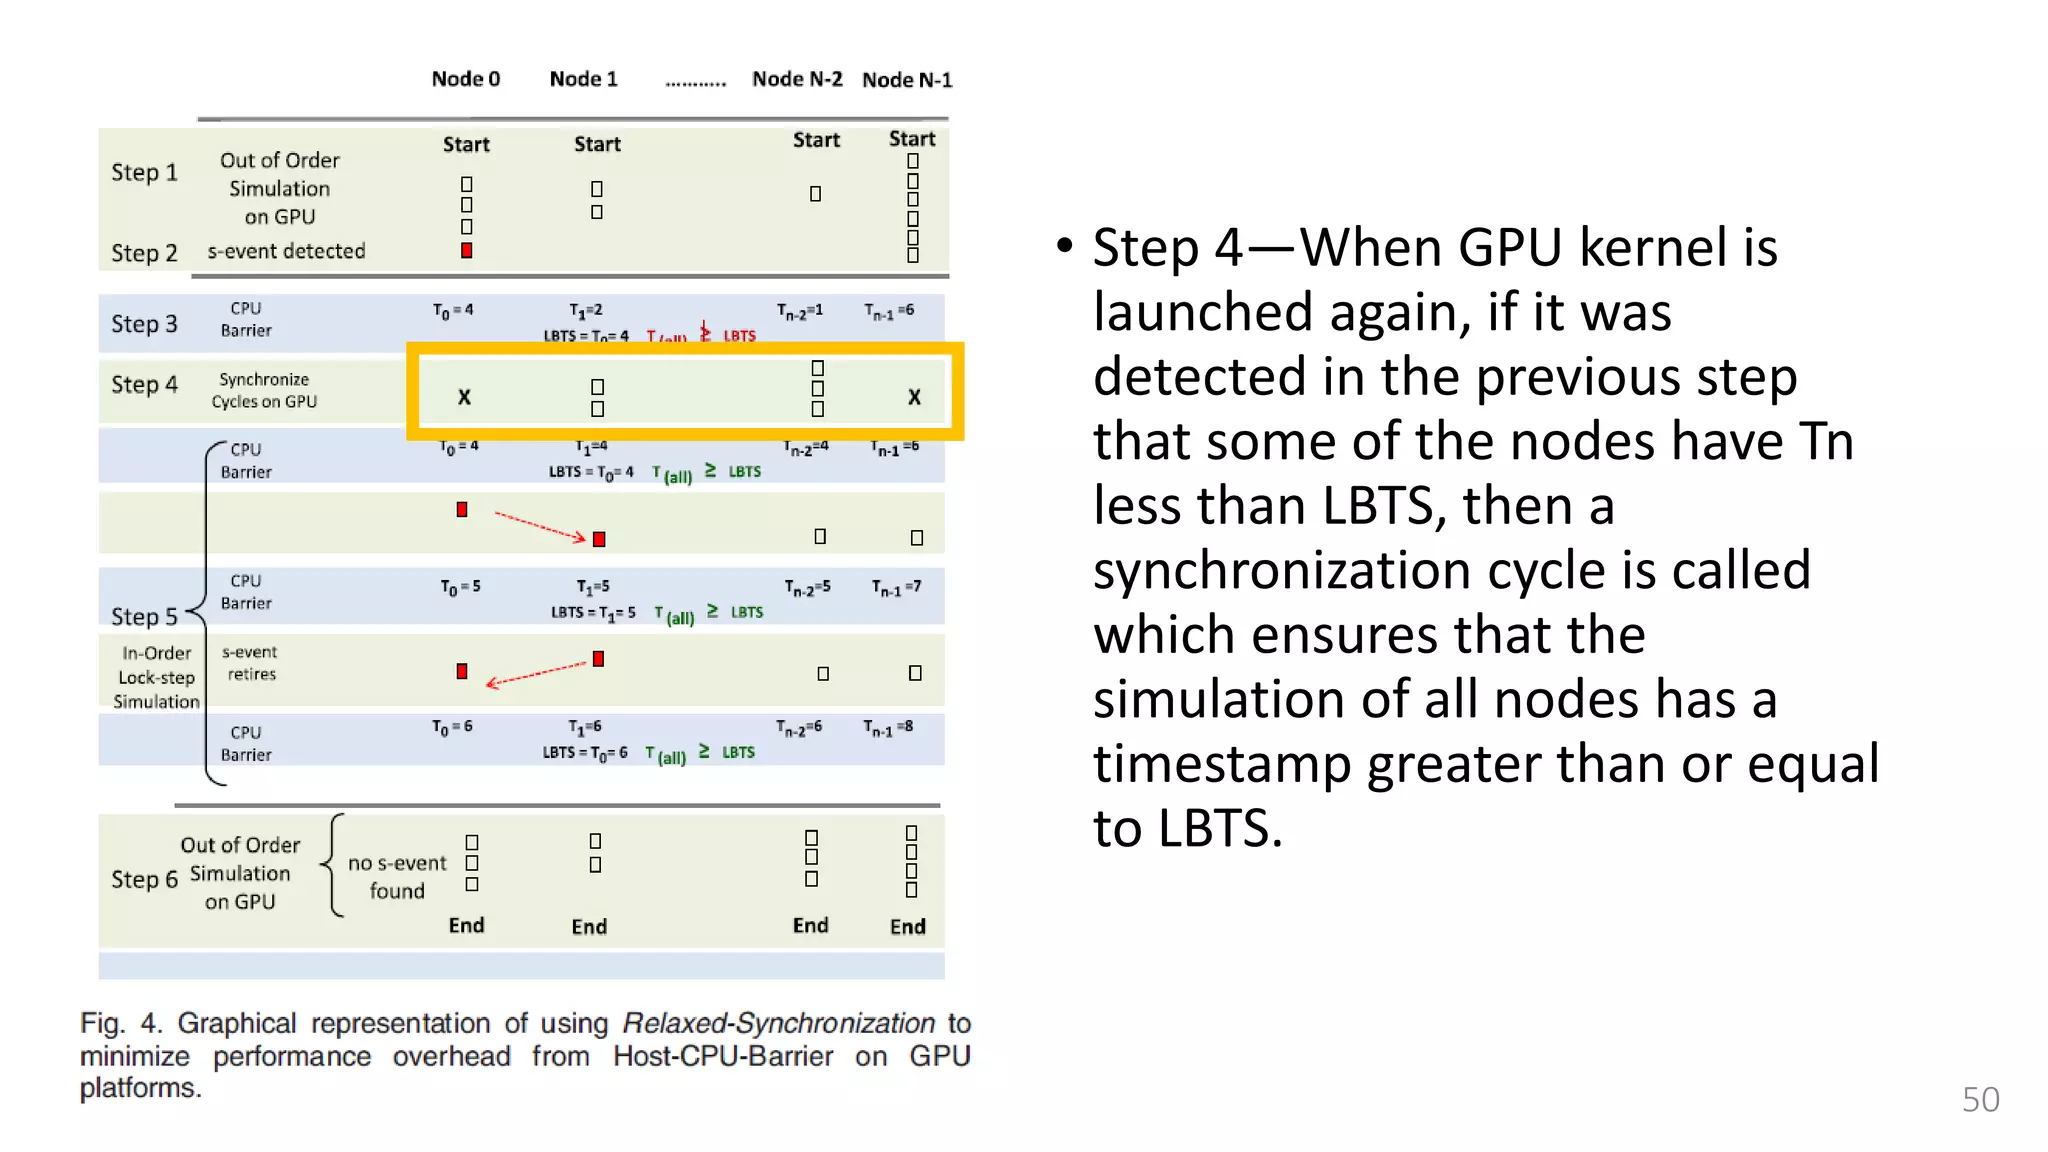
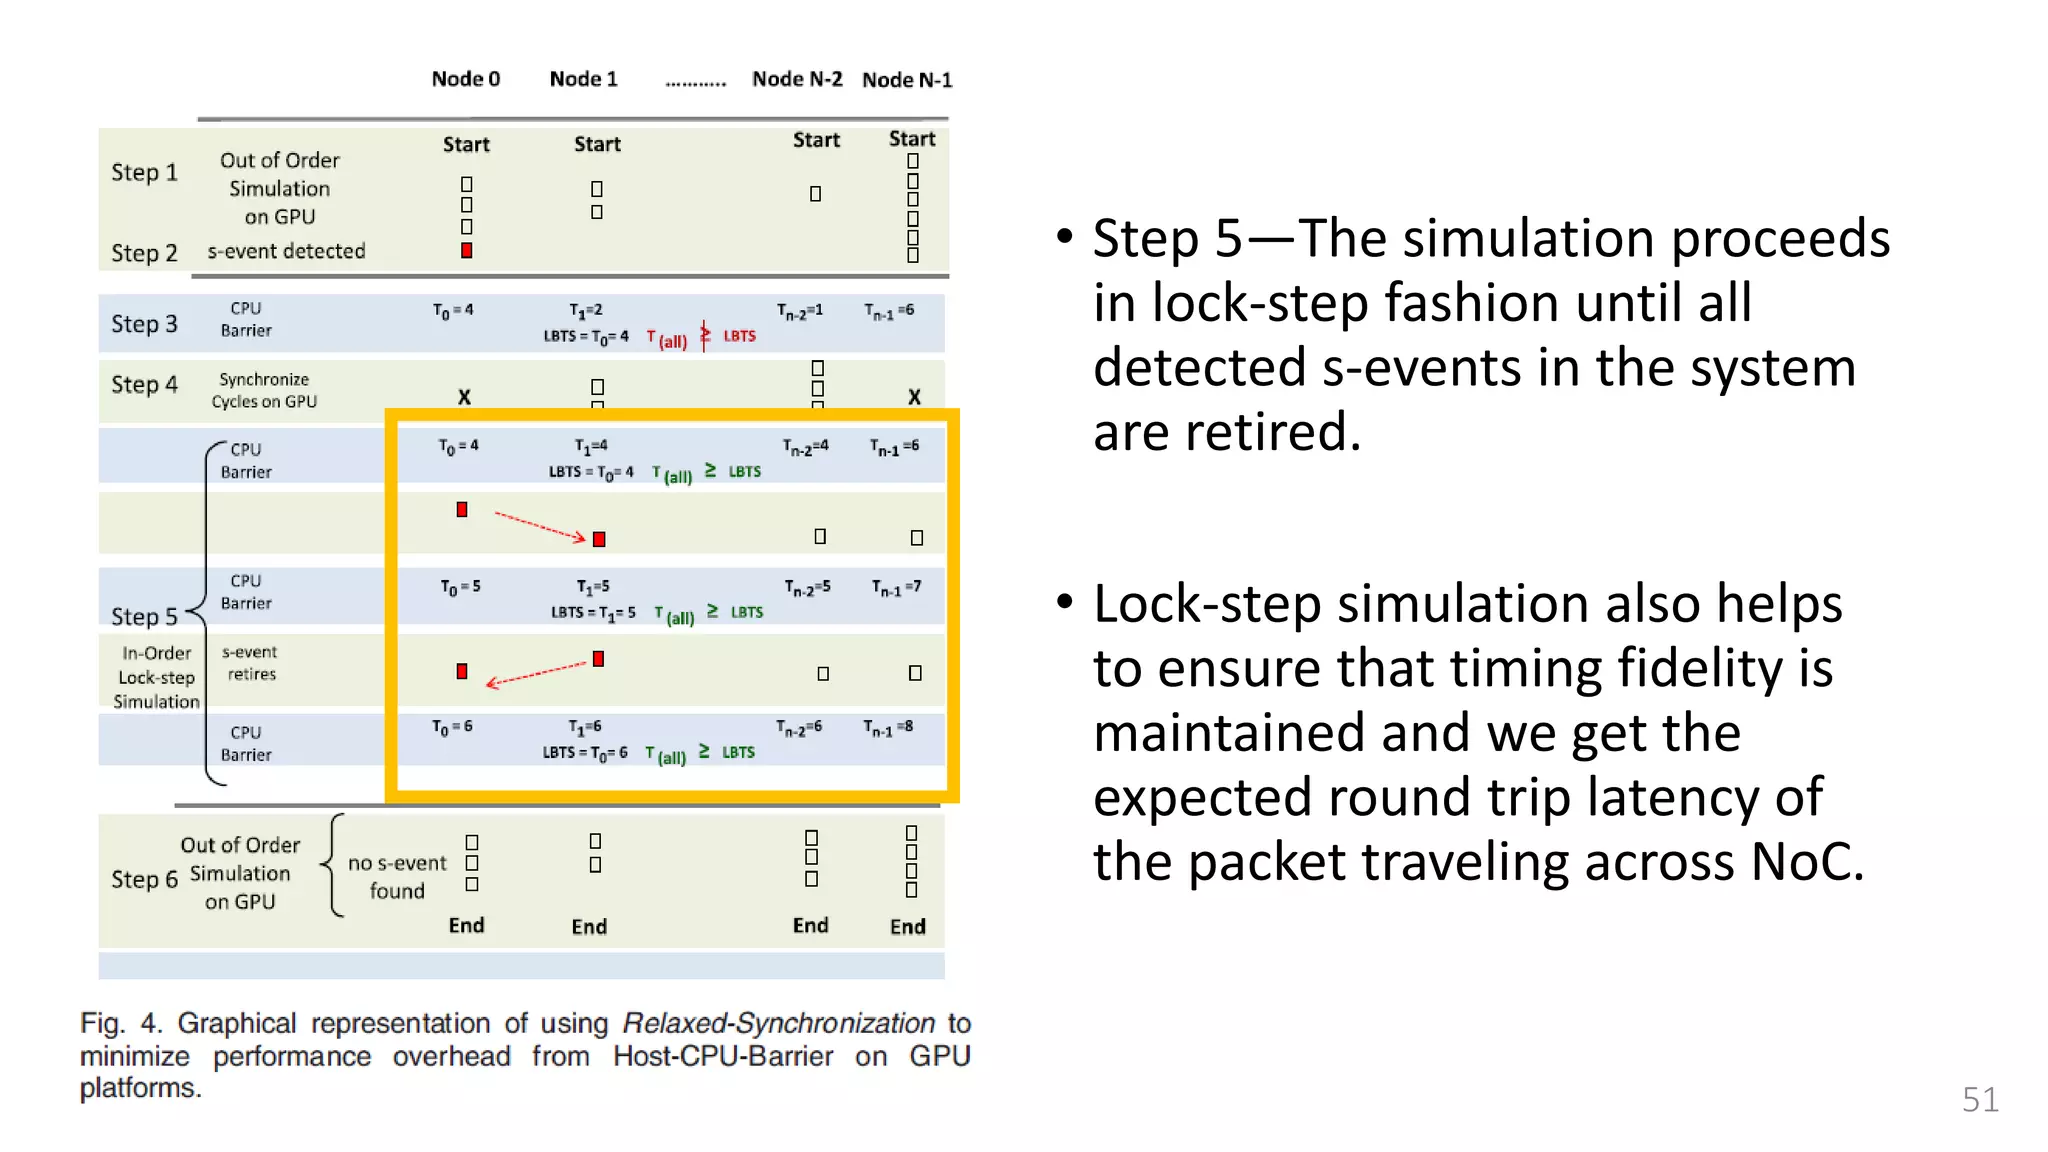
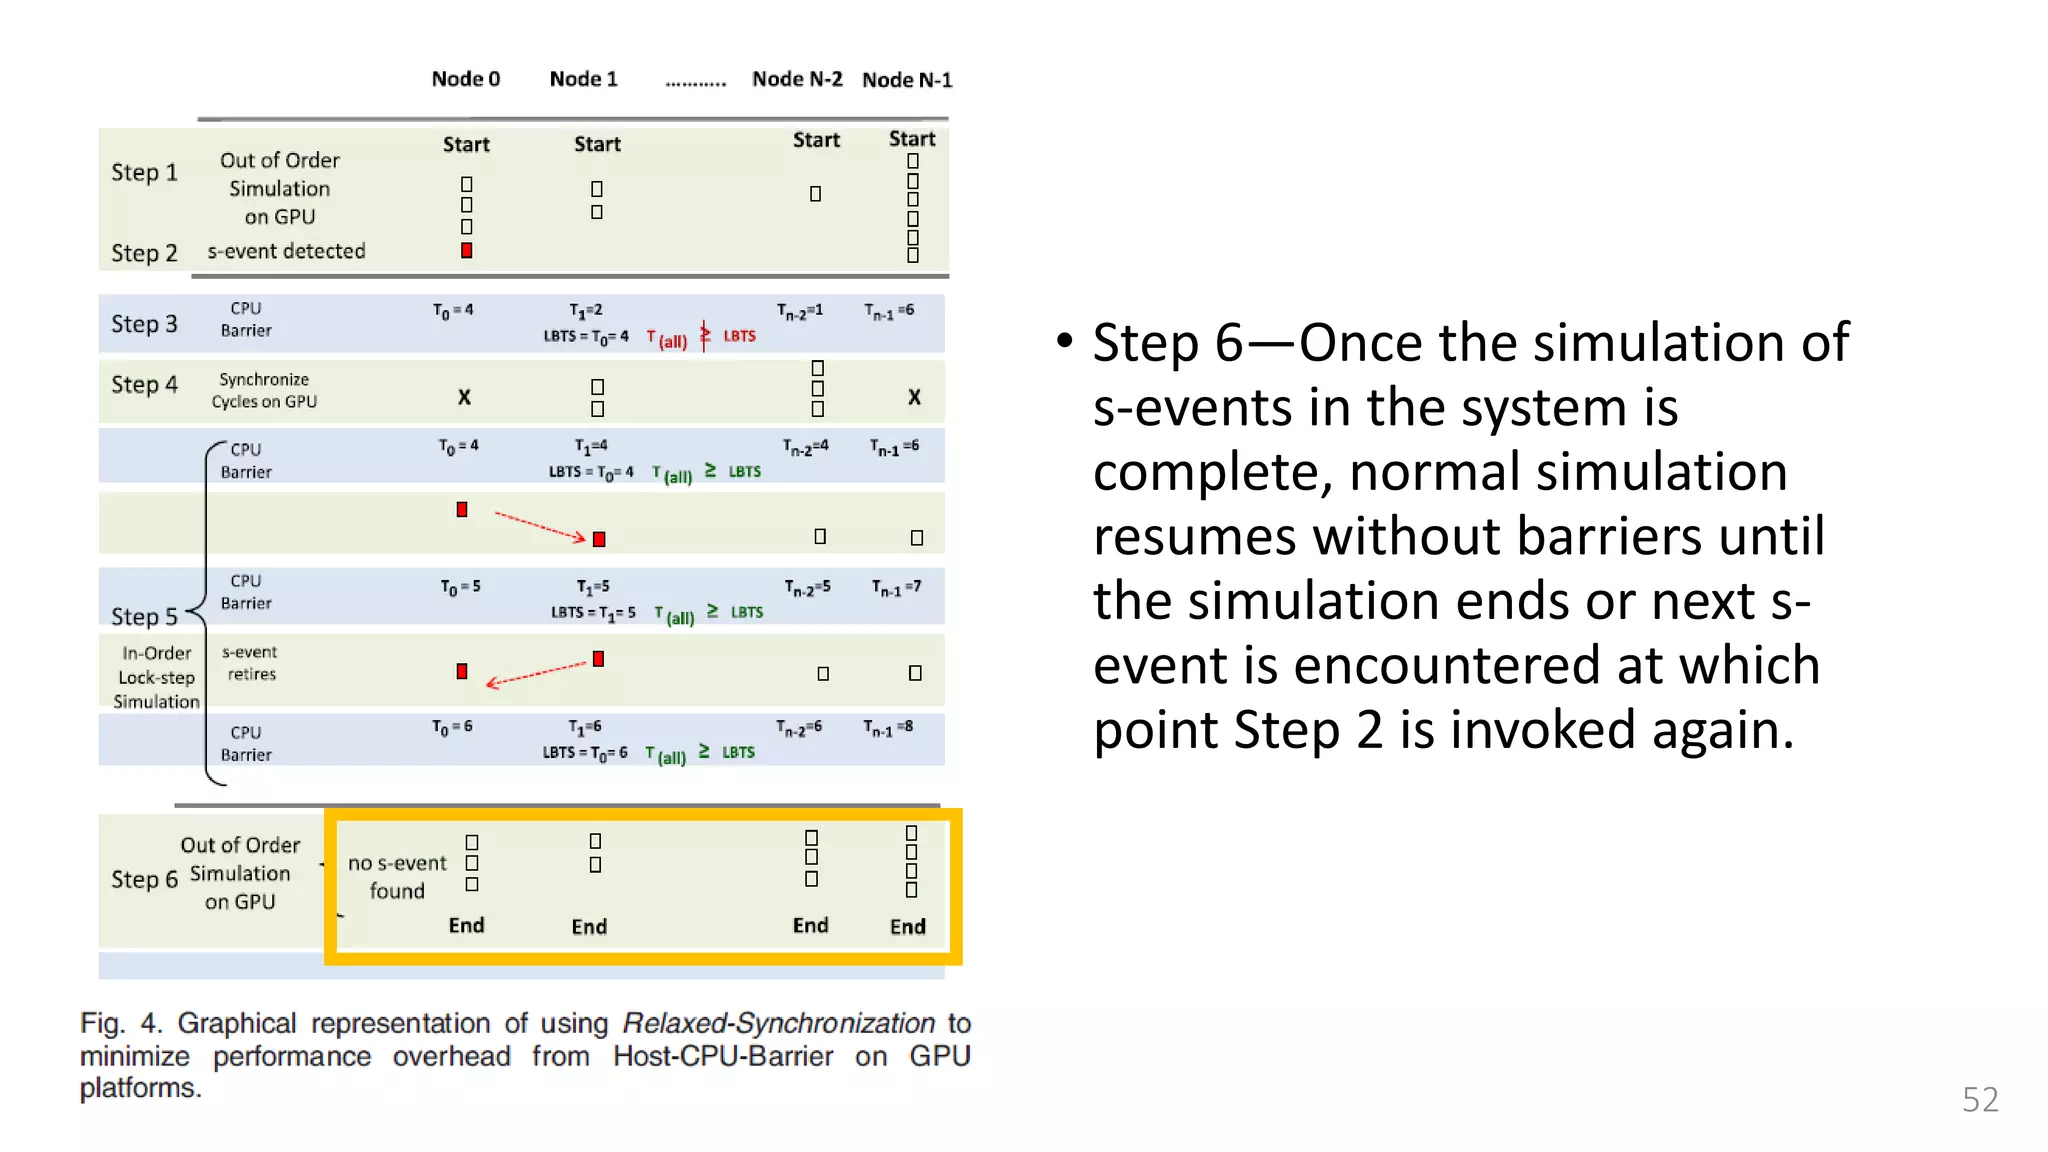
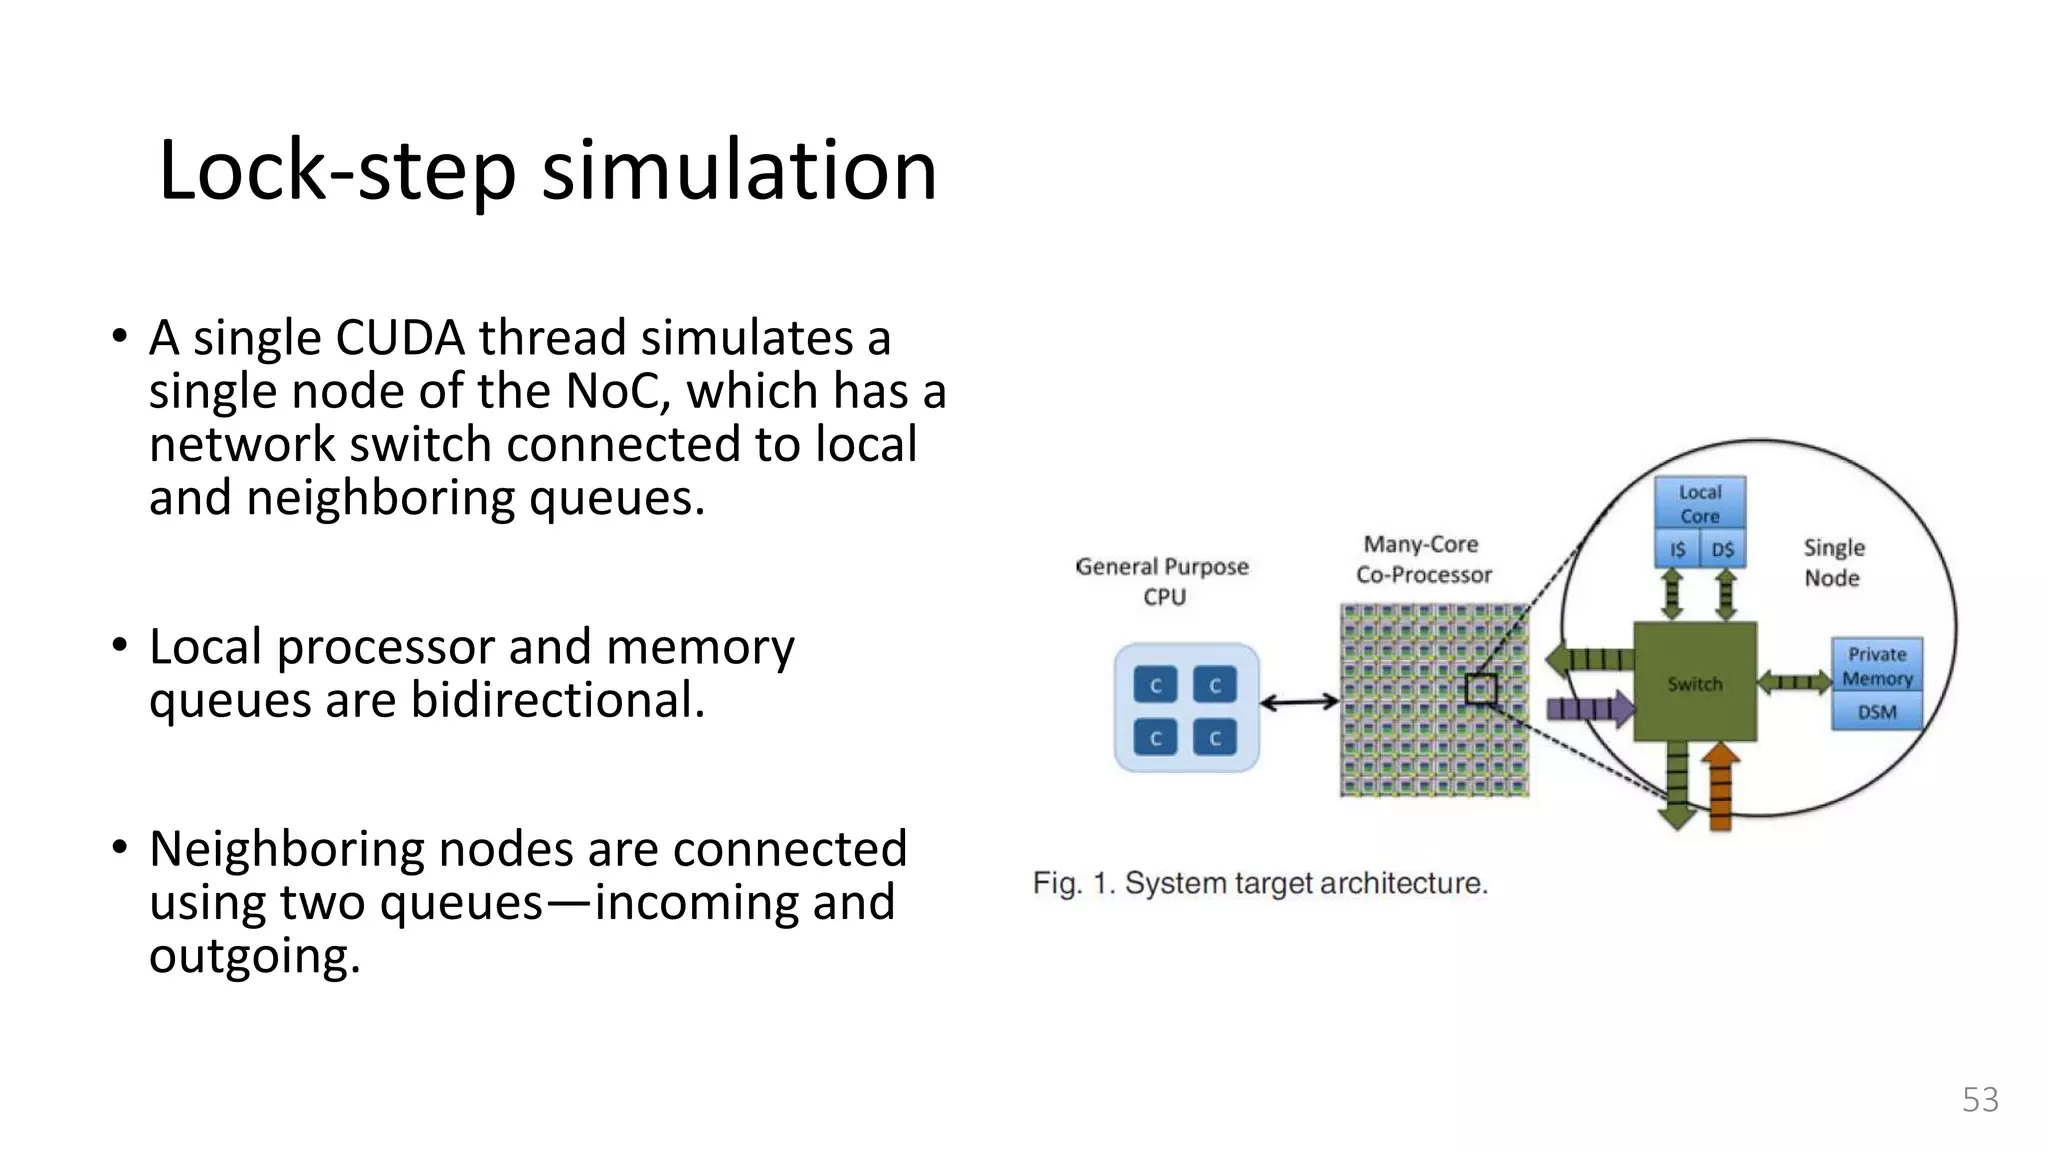
![Lock-step simulation
55
• This synchronization is done
using a combination of
• CPU barrier synchronization
• Lock-free fast barrier
synchronization [37]
• A single step between two CPU
Barrier Synchronization points is
further divided into a read and
writes cycles.](https://image.slidesharecdn.com/gpuaccelerationforsimulatingmassivelyparallelmany-coreplatforms-150505052639-conversion-gate01/75/Gpu-acceleration-for-simulating-massively-parallel-many-core-platforms-55-2048.jpg)
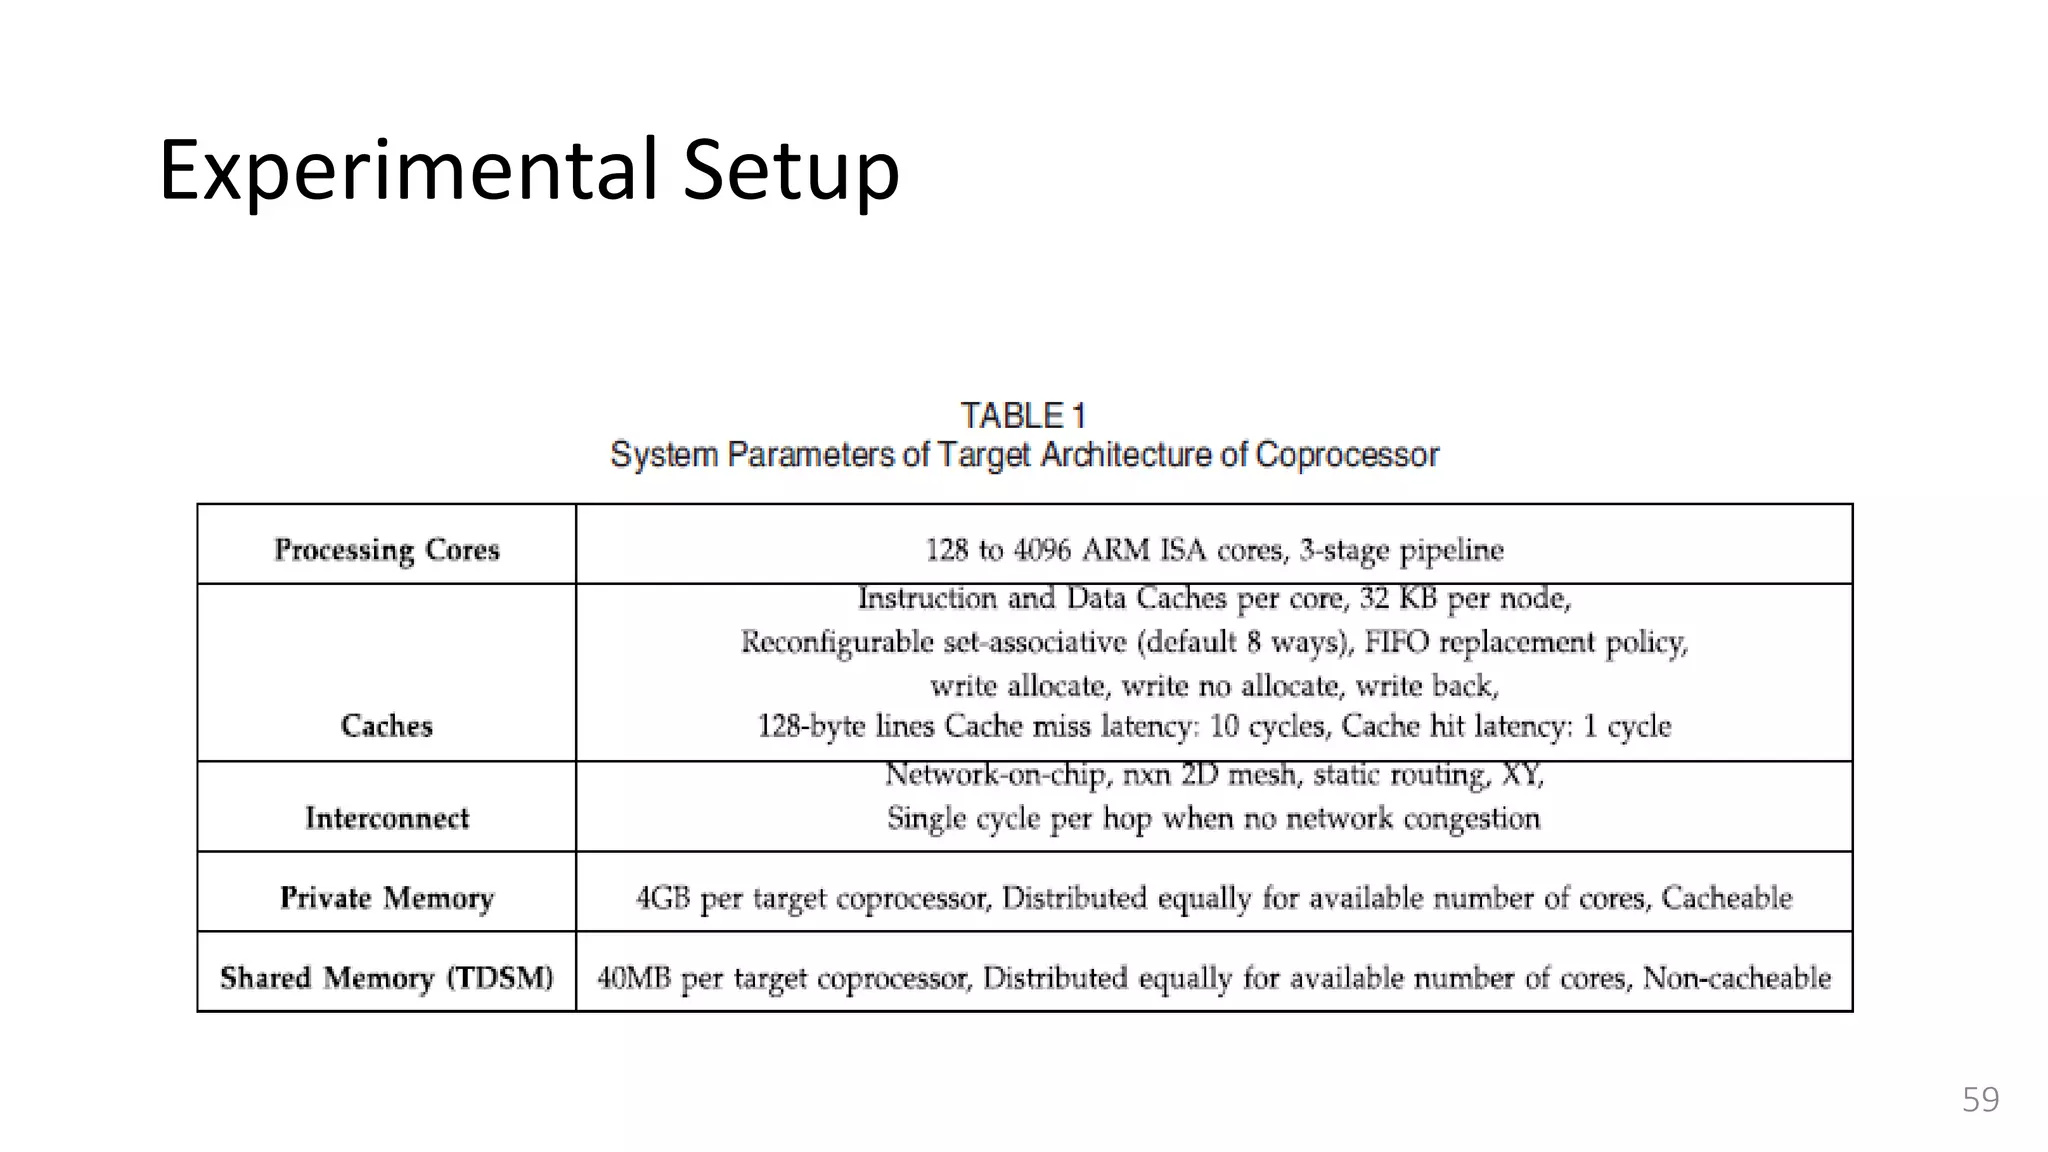
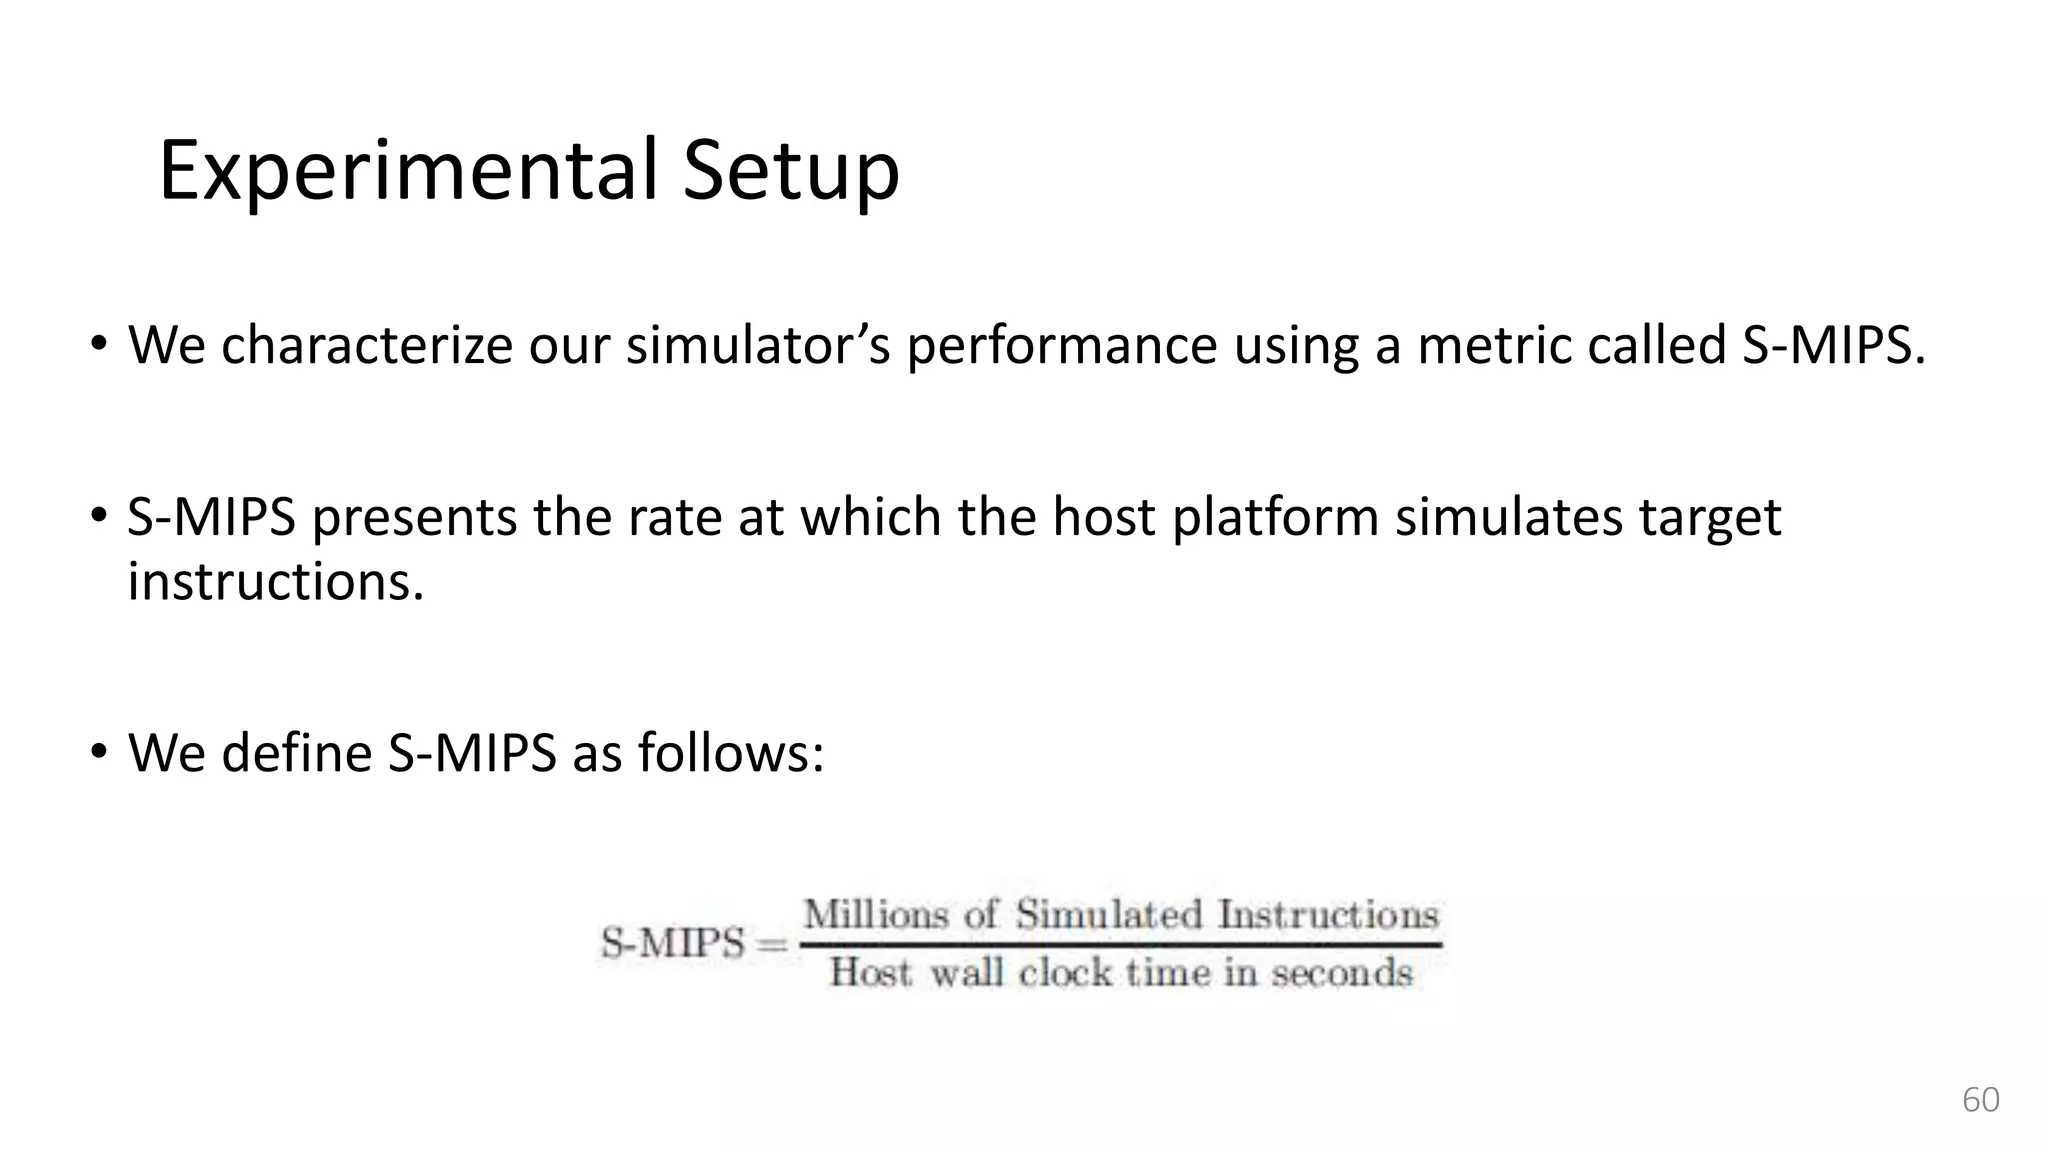
![Experimental Setup
• Target architecture for heterogeneous platforms,
• Simulate an ARM versatile baseboard with dual core ARM1136 CPU connected with
a many-core programmable coprocessor
• Target coprocessor has thousands of very simple in-order cores
• We use simple RISC32 cores (based on ARM instruction set architecture [25])
57](https://image.slidesharecdn.com/gpuaccelerationforsimulatingmassivelyparallelmany-coreplatforms-150505052639-conversion-gate01/75/Gpu-acceleration-for-simulating-massively-parallel-many-core-platforms-57-2048.jpg)
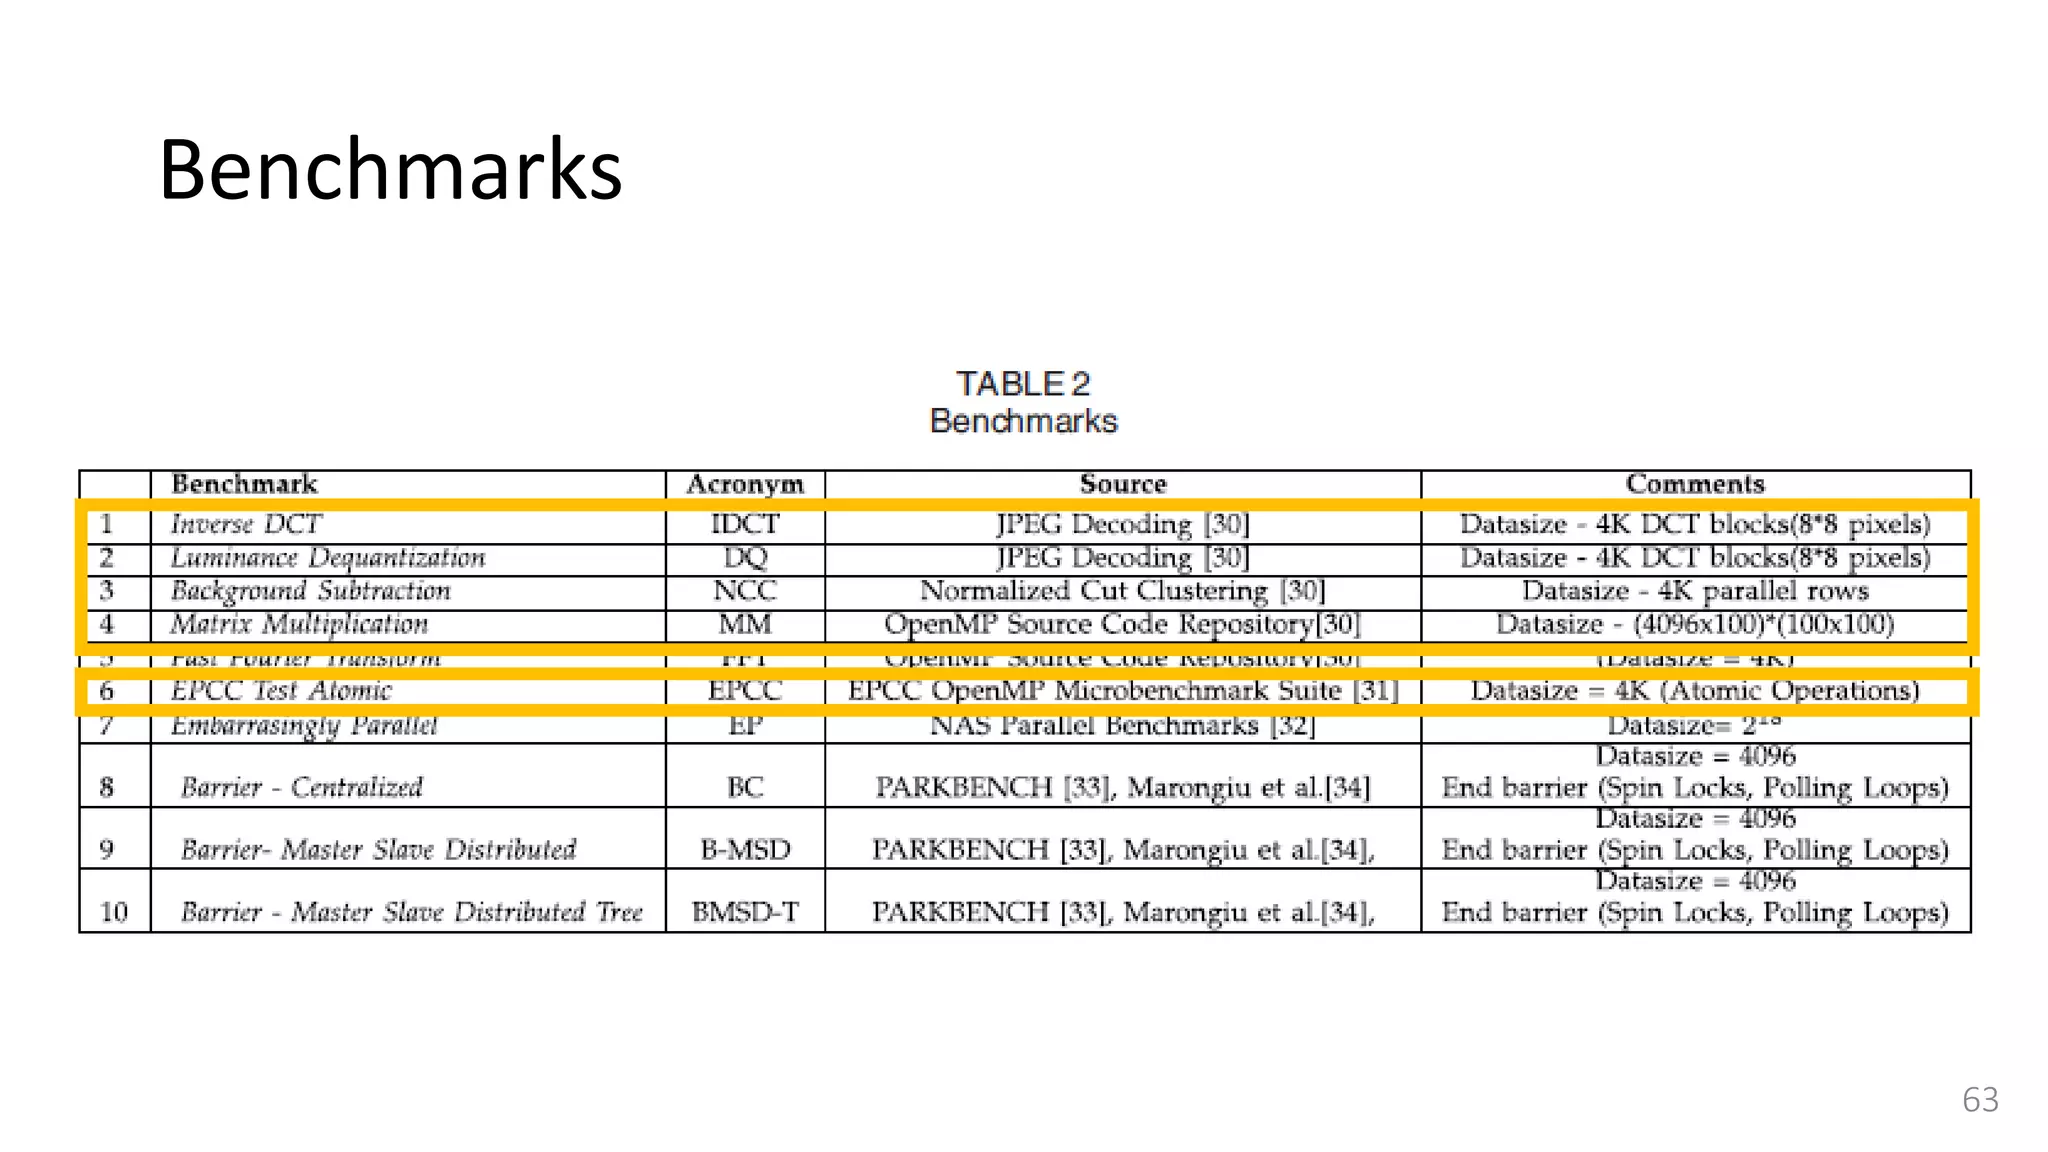
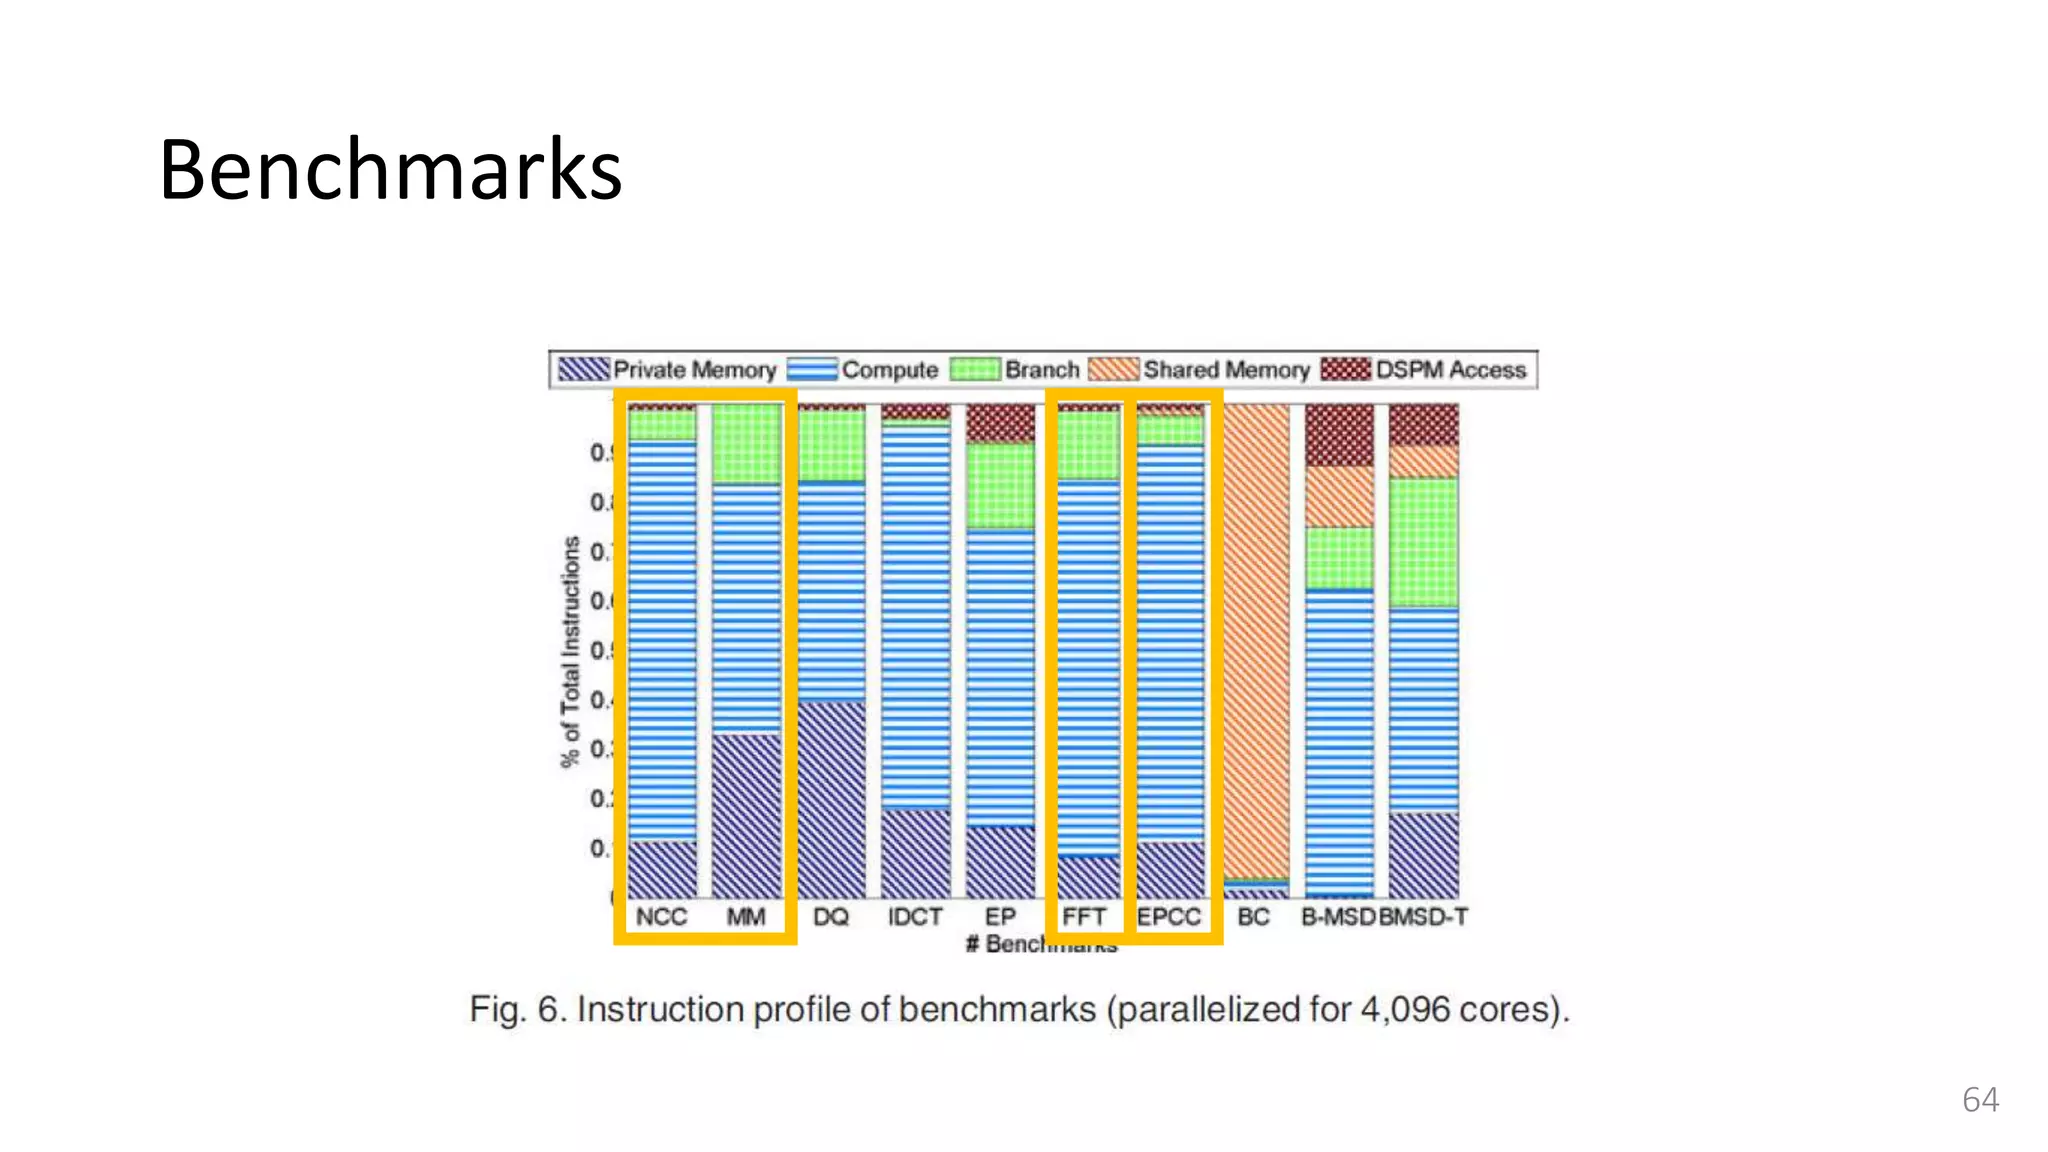
![Benchmarks - Synchronization
• Synchronization is an important feature for any shared memory programming
model and it is important to measure the overhead of using synchronization
primitives in a given workload.
• Selected a worst case scenario and used a barrier synchronization benchmark,
described in [33] and [34]
• Consists of a sequence of data-parallel tasks and a final barrier synchronization makes
threads wait for each other at the end of parallel region.
• Consider three different implementations of barrier algorithm to show that our
simulator can precisely capture the performance impact of software and
architectural design implementations.
65](https://image.slidesharecdn.com/gpuaccelerationforsimulatingmassivelyparallelmany-coreplatforms-150505052639-conversion-gate01/75/Gpu-acceleration-for-simulating-massively-parallel-many-core-platforms-65-2048.jpg)
![Benchmarks - Tree based distributed master-slave (BMSD-T)
• Using a tree based multi-stage synchronization mechanism (BMSD-T)
where cores are organized in clusters.
• The first core of each sub-cluster is master to all slave cores in that sub-cluster.
• When all slaves in a sub-cluster reach the barrier, they trigger top level
synchronization between local (cluster) masters [34].
• The tree-based implementation (BMSD-T) is better suited for a large
number of processors.
68](https://image.slidesharecdn.com/gpuaccelerationforsimulatingmassivelyparallelmany-coreplatforms-150505052639-conversion-gate01/75/Gpu-acceleration-for-simulating-massively-parallel-many-core-platforms-68-2048.jpg)


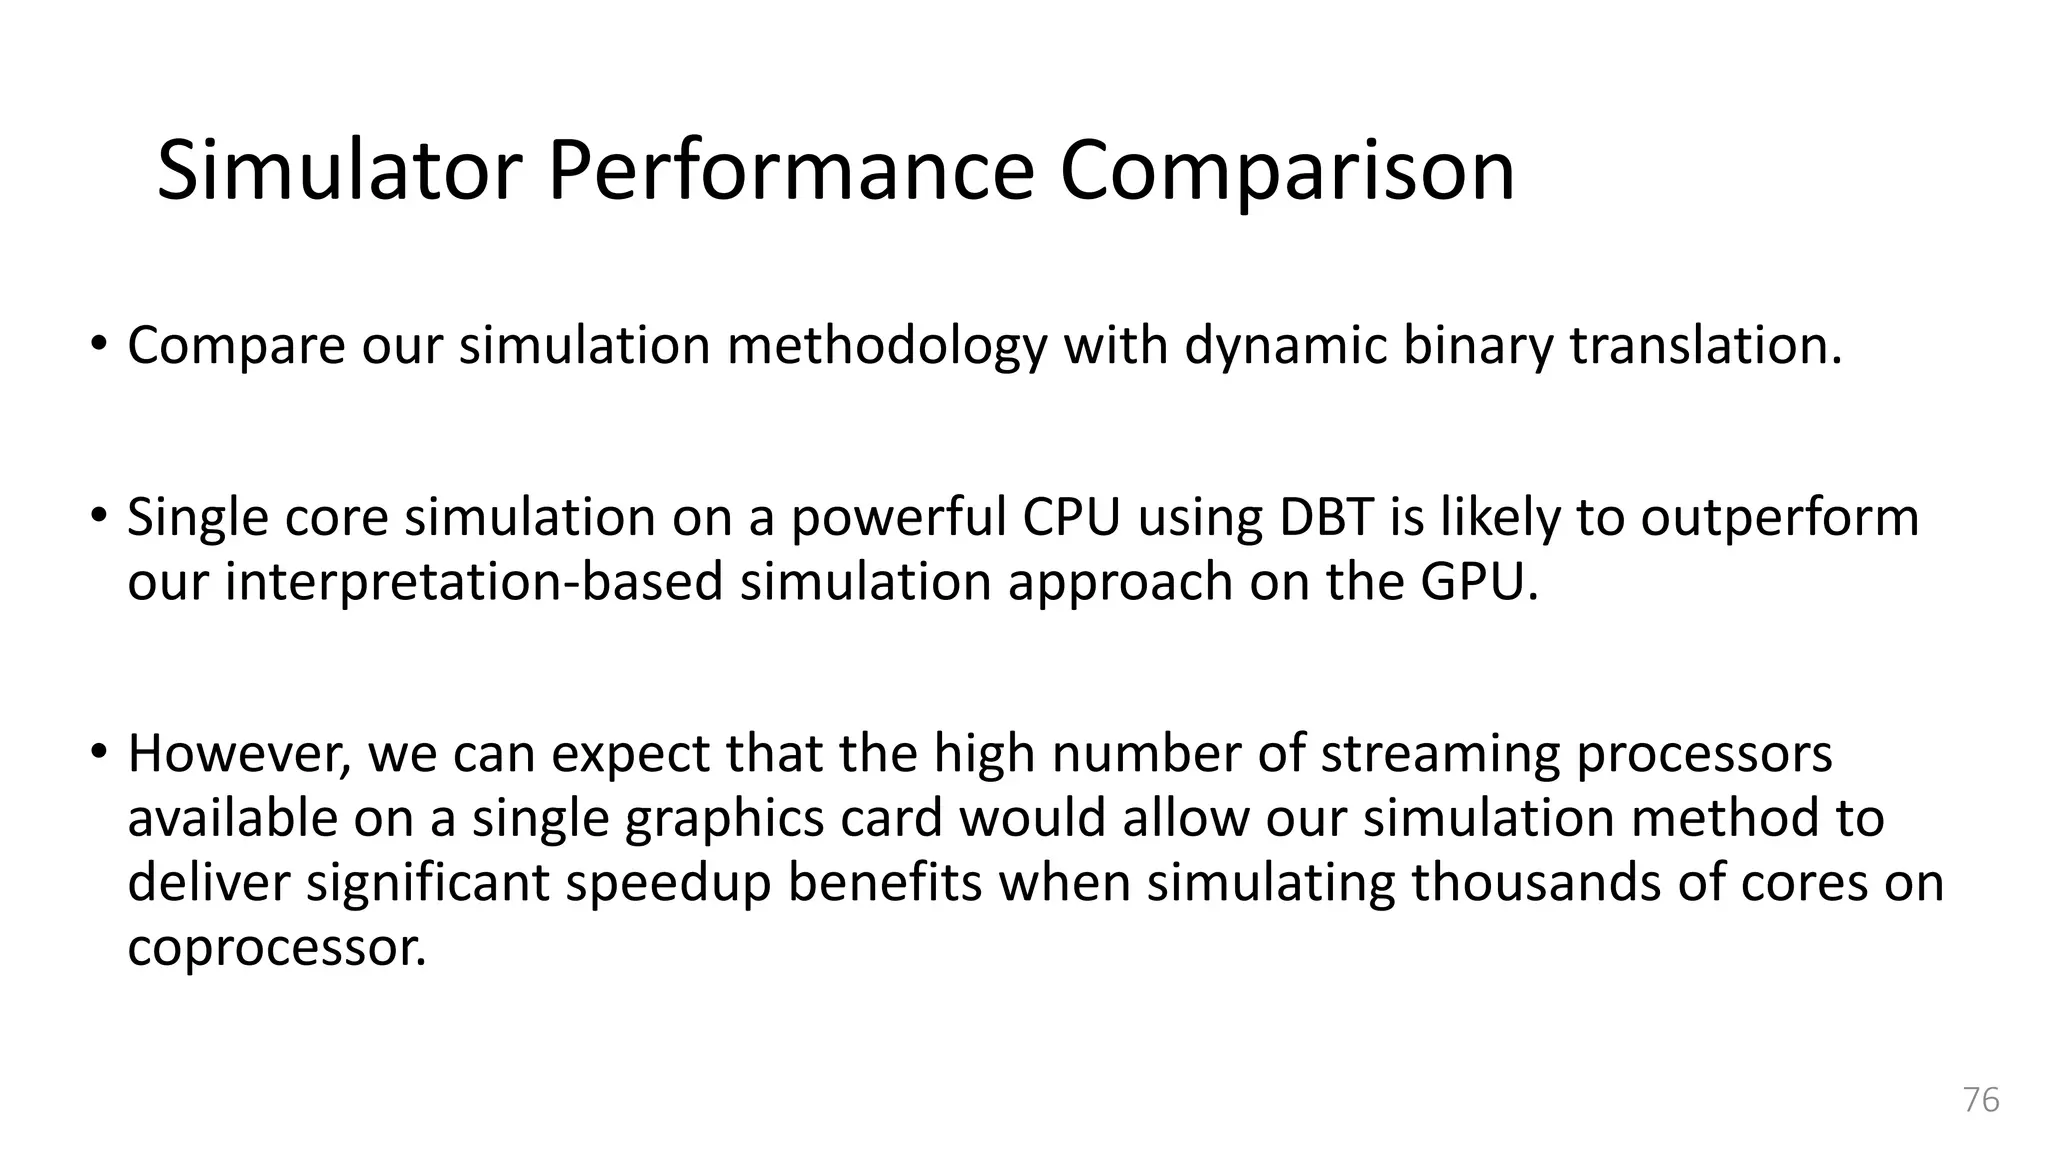
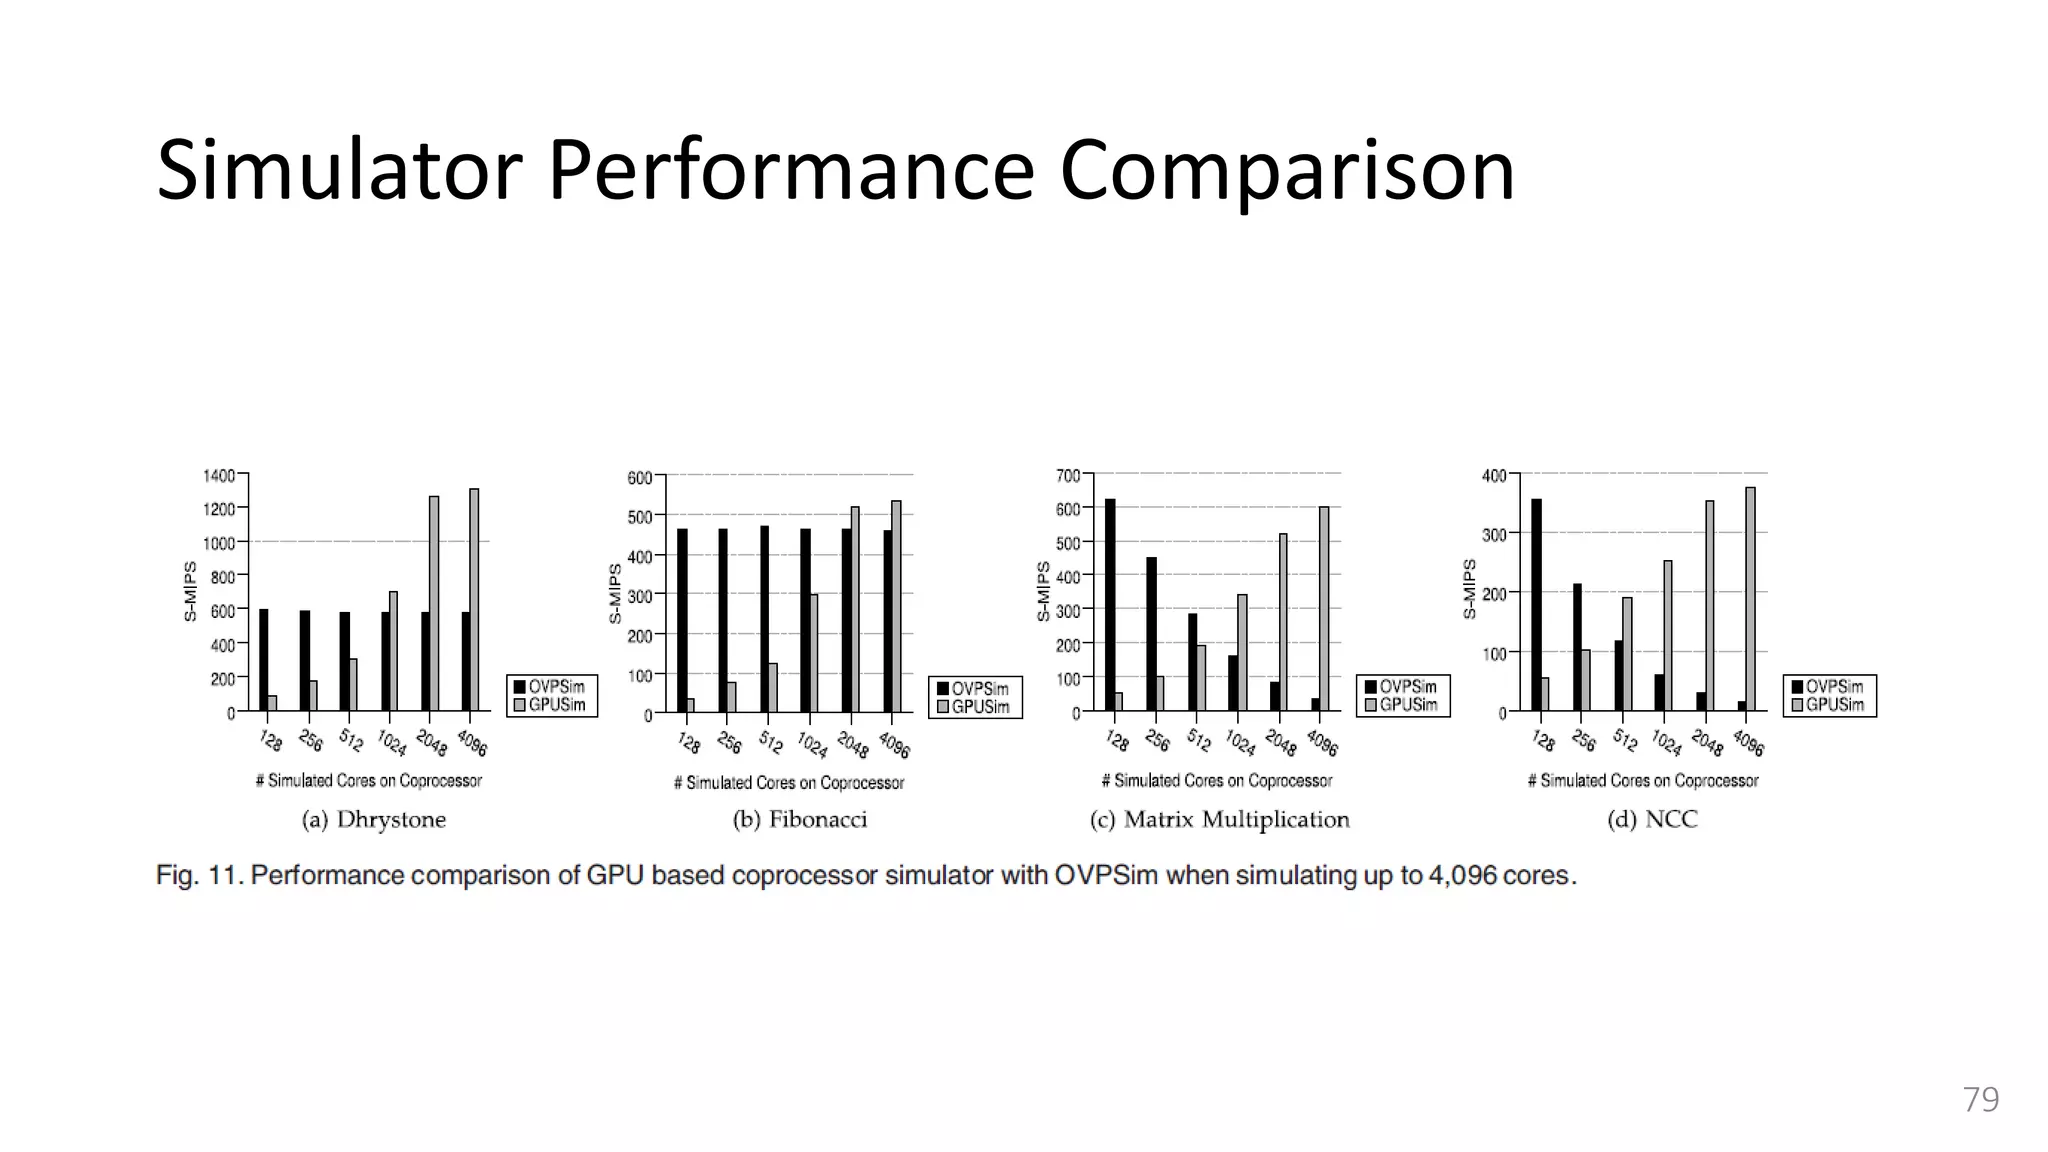
![Simulator Performance Comparison
• Selected OVPSim [35], which is a famous commercial state-of-the-art
simulation platform able to model architectures composed of thousands of
ARM-based cores.
• OVPSim is a sequential simulator where each core takes turn after certain
number of instructions
• it exploits the benefits of Just in Time Code Morphing and translation caching
system to accelerate the simulation
• The host platform used for running OVPSim is the same we use for our
QEMU-based target CPU simulator.
77](https://image.slidesharecdn.com/gpuaccelerationforsimulatingmassivelyparallelmany-coreplatforms-150505052639-conversion-gate01/75/Gpu-acceleration-for-simulating-massively-parallel-many-core-platforms-77-2048.jpg)


The document discusses GPU acceleration for simulating massively parallel many-core platforms, focusing on the challenges, methodologies, and innovations in simulation frameworks. It highlights the need for scalable simulation solutions to manage the complexity of modern heterogeneous architectures and presents a novel approach leveraging GPU capabilities for enhanced performance. Key techniques include a cycle-approximate performance prediction model and a relaxed-synchronization mechanism to reduce overhead and improve efficiency in simulations.


![[BDD 2025 - Full-Stack Development] The Modern Stack: Building Web & AI Appli...](https://cdn.slidesharecdn.com/ss_thumbnails/fs-themodernstackbuildingwebaiapplicationswithserverless-251124030844-388cf04f-thumbnail.jpg?width=640&height=640&fit=bounds)

![[BDD 2025 - Mobile Development] Exploring Apple’s On-Device FoundationModels](https://cdn.slidesharecdn.com/ss_thumbnails/md-exploringappleson-devicefoundationmodels-251124030840-d690542c-thumbnail.jpg?width=640&height=640&fit=bounds)


![[BDD 2025 - Full-Stack Development] PHP in AI Age: The Laravel Way. (Rizqy Hi...](https://cdn.slidesharecdn.com/ss_thumbnails/fs-phpinaiagethelaravelway-251125012602-ef9d330e-thumbnail.jpg?width=640&height=640&fit=bounds)
![Support, Monitoring, Continuous Improvement & Scaling Agentic Automation [3/3]](https://cdn.slidesharecdn.com/ss_thumbnails/agenticcommunityseries-day3-cfd-251120170304-ddef8112-thumbnail.jpg?width=640&height=640&fit=bounds)


![[BDD 2025 - Artificial Intelligence] AI for the Underdogs: Innovation for Sma...](https://cdn.slidesharecdn.com/ss_thumbnails/ai-aifortheunderdogsinnovationforsmallbusinesses-251124030839-72a599a4-thumbnail.jpg?width=640&height=640&fit=bounds)


