
Recommended
More Related Content
What's hot
What's hot (10)
Similar to Gopal chapter3
Similar to Gopal chapter3 (20)
More from vigneshwaran vignesh
Recently uploaded
Recently uploaded (20)
Gopal chapter3
- 1. 58 CHAPTER - 3 EXPERIMENTAL INVESTIGATION 3.1 Introduction In order to build and validate Time series analysis models using various physico-chemical parameters to forecast the water quality of Vellar estuary for the pre monsoon period, extensive experimental investigations were carried out during July 1996 to September 2000. The primary objective of the study was to assess water quality characteristics at almost no flow from the river to the estuary under conditions of limited land use. Also in the hot season, with no river flow the estuary becomes homogeneous though temperature may become important in producing density differences by surface heating. Five stations from the river mouth (down stream) to the upstream covering a stretch of 5 km were identified and water sampled. The analysis was carried out for different parameters. 3.2 Vellar Estuary Dyer and Ramamoorthy (1969) described the Vellar estuary in detail and stated the location as 11029'N Latitude and 79046'E Longitude. The river Vellar originates in Servarayan Hills of Salem District of Tamil Nadu. After passing about 480 km through areas of red sand leached and laterised black soil and loamy red soil, it opens into the Bay of Bengal at Parangipettai. The Vellar estuary is connected by backwater with the nearby Coleroon estuary to form Vellar- Coleroon estuarine complex. About 51 inlets of mangrove vegetation on the Coloroon side dominate the Southern part of the complex. Floodwaters of monsoon is the main freshwater source. The Vellar river widens its mouth and at other times, the freshwater flow is limited resulting in a formation of sand bar, which narrows down the river mouth.
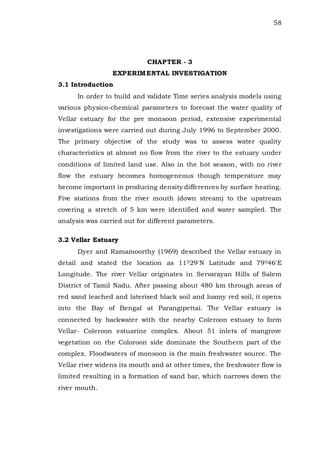
- 2. 59 In general, the mean tidal level in the estuary is 75 cm and maximum level is about 105 cm. The width of the estuary is 80 m close to the mouth and the maximum is about 565 m at a place called Lading Centre. The average depth is 2.5 m with a maximum depth being 4 m. The estuary shows semidiurnal tides and the tidal effect is felt up to 12 km upstream from the river mouth. The estuary also receives discharges from a number of irrigational channels such as Log channel, Dog channel, Buckingham channel and railway bridge channel. Both sides of the river Vellar are bordered with vast stretches of agricultural lands. These are mainly wetland areas of about 4000 hectares. There are three channels on the southern bank of the estuary and drainage from the adjoining agricultural lands, where application of improved techniques in agricultural management is followed to achieve higher production. The mine drains of the Neyveli Lignite Corporation Ltd. (50 km west of Parangipettai) are also indirectly drained into the river course, during the monsoon period due to surface land runoff. Parangipettai is mainly influenced by North East monsoon. Brief information on Vellar river basin is given in Table 3.1. Table 3.1. Brief information on Vellar river basin Total Catchment Area (km2 ) Population Water use Land use AmbientTemperature (degrees Centigrade) Industries (1) (2) (3) (4) (5) (6) 7472 18,00,000 Irrigation,Water supply,Fish cultivation, Industrial processing. Paddy Cultivation Animal husbandry Industry Average: high 41.1 low 21.0 Cement Ceramic Fertilizer Sago Sugar A map showing the Vellar estuary and the location of five sampling stations is given in Fig 3.1.
- 3. 60
- 4. 61 3.3 Sampling stations Details. For carrying out the experimental investigation, five sampling locations were selected from the river mouth to the upstream at convenient locations. The details of these sampling stations were presented in Table 3.2 Table 3.2. Location and Details of Sampling Stations Sampling Station No. Name Location 1 Auction Centre It is 0.5 km from the mouth of the river. 2 Marine Biology Centre It is 3 km from the mouth of the river. 3 Thonithurai It is 4 km from the mouth of the river. Residential area is on the left bank of the River. There is always movement of people from L.B to R.B through boats. 4 Buckingham Canal It is 5 km from the mouth of the river. Drainage water of the Parangipetti town drain at this point. 5 Railway Bridge It is across the Vellar estuary. It is the narrower portion in the estuary, This is at 6 km from the river mouth on the Villupuram – Mayiladuthurai Railway line. 3.4 Sample Collection details In this study, water samples from Vellar estuary at the chosen sampling stations were collected for five years from 1996 to 2000. Every year, samples were collected during July to September, the premonsoon period, on weekly basis (total of 60 weeks). The collecting time was during low tide period. A total of 300 samples were collected, adopting the standard sampling procedure.
- 5. 62 3.5 Analysis of water samples The 300 samples collected were analysed as per ‘Standard Methods for examination of water and wastewater – APHA’ for the parameters, Alkalinity, Calcium, Chloride, Electrical Conductivity, Fluoride, Hardness, Iron as Fe, Nitrate, pH value, Sulphate, Total Dissolved Solids and Turbidity. The analysis procedure of each parameter is given elaborately in the following sections. 3.5.1 ALKALINITY A.Procedure i) 50 mL of sample was taken in an Erlenmeyer flask. If the pH is 8.3 or above, 2drops of meta cresol purple indicator was added. It was titrated with N/50 H2SO4. At the end point the colour changes from pink to yellow. Titrate volume V2 was noted. V1 is the initial reading of the burette. ii) Titration was continued after adding 2 drops of Brom Cresol green indicator. At the end point (Blue to Yellow), titrate volume V3 is noted. iii) If the pH was less than 8.3 immediately after addition of meta cresol purple, end point was reached. Therefore V1 was equal to V2. Immediately afterwards Brom Cresol green indicator was added and titration was continued. B.Calculation (V2-V1) x 1000 Alkalinity, at 8.3 as CaCO3 mg/L = ----------------------- mL sample (V3-V1) x 1000 Alkalinity, at 4.5 (Total) as CaCO3 mg/L = ----------------------- mL sample
- 6. 63 C.Reagents S.No. Reagents Preparation 1. 0.02 N H2SO4 Diluted 10 mL 1 N H2SO4 TO 500 mL d.H2O 2. 1 N H2SO4 100 mL d.H2O in a 250 mL std flask was taken and added slowly 7 mL con. H2SO4 make upto 250 mL. 3. Metacresol purple indicator. Dissolved 100 mg metacresol purple in 100 mL d.H2O 4. Brom cresol green indicator Dissolved 100 mg. Brom Cresol green + 20 mg methyl red in 100 mL isopropylalcohol Note : PD – Polythene dropping bottle. 3.5.2 CALCIUM A.Procedure 50 mL or a portion of sample was taken and diluted to 50 mL. 1 mL 1 N HCl was then added. It was heated and boiled for 1 minute and cooled. 2-3 mL 1 N Na OH mix was then added. Also 0.21 g Eriochrome Blue Black – R Indicator was added. It was titrated against standard EDTA. The end point was noted when the colour changed from red to blue. B. Calcium mL EDTA x 1000 x 0.4 x C.F Ca mg/L = ---------------------------------------- mL sample Where C.F = correction factor.
- 7. 64 C. Reagents S.No Reagent Preparation 1. Na OH 1 N 10 g Na OH was dissolved in 250 mL of H2O. 2. Std EDTA 0.01 M 3.723 g EDTA was dissolved in d.H2O and make up to 1000 mL. 3. HCL 1 N 22 mL conc. HCl was diluted to 250 mL with dH2O. 4. Erichrome Blue Black – R Indicator (calcon) Grinded 200 mg powder dye + 100 g NaCl 3.5.3 CHLORIDE A. Procedure S.No Nature of sample Sample treatment Titration and end Point 1. Colourless and clear 100 mL was taken or a suitable portion diluted to 100 mL. 1 mL of K2Cr O4 indicator was added and titrated with standard Ag NO3, and end point was noticed as pinkish yellow. 2. Coloured and turned. 100 mL was taken or a suitable portion diluted to 100 mL. 3 mL Al (OH)3 suspension was added and then filtered. 1 mL of K2Cr O4 indicator was added and titrated with standard Ag NO3, and end point was noticed as pinkish yellow. 3. n presence of sulphide, sulphite or thiosulphate. 100 mL or a portion diluted to 100 ml. 1 mL H2O2 (30%) was added and stirred for 1 minute. 1 mL of K2Cr O4 indicator was added and titrated with standard Ag NO3, and end point was noticed as pinkish yellow.
- 8. 65 B.Calculation (A-B) x 1000 Chloride mg/L = ------------------- x C.F 2 x V Where A = mL. Litre volume for the sample. B = mL. Litre volume for the blank. V = Volume of the sample C.F = Correction Factor C. Reagent S.No Reagent Preparation 1. Standard Silver Nitrate (1 mL = 0.5 mgcl) 2.395 g Ag NO3 was dissolved in d.H2O and make upto 1000 mL. 2. Aluminium Hydroxide Suspension. Dissolved 12.5 g Al K (SO4)2, 12 H2O in 100 mL,d.H2O heated to 600C concentrated NH4OH, 5.8 mL was added slowly and stirred. After one hour precipitate was washed by through mixing and decanting with d. H2O. The suspension was then stored. 3. Potassium Chromate 12.5 g K2 CrO4 was dissolved in a little d.H2O. Ag NO3 solution was thenadded until a definite red precipitate was formed. It was kept for 12 hours and then filtered and diluted to 250 mL with d.H2O. 4. Hydrogen Peroxide H2O2. 30% 5. Std. Sodium chloride (1 mL=0.5 mgCl) 824 mg NaCl (dried at 1400C) was dissolved in d.H2O and make upto 1000 mL.
- 9. 66 Standardisation 10 mL std. NaCl was taken in a cesserol. 90 mL . d H2O was added. 1mL K2 CrO4 was also added then titrated with std. Ag NO3. End point was noticed as pinkish yellow colour (A) Similarly a reagent blank titration (B) was conducted. Correction factor = 10/A-B. 3.5.4 ELECTRICAL CONDUCTIVITY A. Procedure i) Standardision of meter : Distilled H2O was taken in two 50 mL beakers (marked as D1 and D2). Standard KCl (1413) is taken in two 50 mL beakers (marked as 1413 A and 1413 B). Conductivity cell was dipped in D1, D2, 1413A and 1413B in that order. When the cell was dipped in 1413B the meter was adjusted to read 1413 E.C. ii) Conductivity measurements for sample : Each sample is taken in two 50 mL beakers (the beakers are marked as nA and nB where ‘n’ is the sample number). First the conductivity cell was dipped in nA and then in nB. When the cell was dipped in nB conductivity value of the sample was observed. iii) Measuring conductivity of other standards : When any of the sample conductivity was higher than 2000 E.C, other standards each in 50 mL beakers was taken (marked as SA and SB where S is the value of standard). Conductivity cell is first dipped in SA and then in SB. When it is dipped in SB conductivity value was observed for that standard. (Each time before measuring the conductivity of the sample/ standard the conductivity cell was dipped in D1 and D2 in that order).
- 10. 67 B.Calculation Observed Conductivity Theoretical Conduct. Sample Value for sample X Value for standard KCl Conductivity= -------------------------------------------------------------------- mic. S/cm Observed Conductivity value for same standard. KCI. C. Reagent S.No Conductivity Value for std KCl. MicS/cm Conc in M Weight of the KCl dissolved and diluted to1 litre mg 1. 14.9 0.0001 7.456 2. 73.9 0.0005 37.28 3. 146.9 0.001 74.56 4. 717.5 0.005 372.8 5. 1412 0.01 745.6 6. 2765 0.02 1491.2 7. 6667 0.05 3728.0 8. 12890 0.1 7456.0 9. 24800 0.2 14912.0 10. 58670 0.5 37280.0 11. 111900 1.0 3.5.5 FLUORIDE (ION SELECTIVE ELECTRODE METHOD) A.Procedure 10 mL was taken and calibrated the meter with 1 mg/L and 10 mg/L standards (for calibration 10 mL std and 10 mL buffer) of sample and 10 ml buffer in a small beaker. Electrode was immersed and potential developed was measured while stirring. B. Calculation Fluoride mg/L = Measured reading x Dilution factor
- 11. 68 C. Reagents S.No Reagent Preparation 1. Fluoride buffer To 500 mL d.H2O in a 1 lit. beaker 57 mL of glacial acetic acid was added. 58 g NaCl, and 4 g.EDTA were also added. It was placed in a cool water bath and slowly 6 N NaOH was added (about 125 mL) with stirring until pH was between 5.3 and 5.5. It was then transferred to a 1 litre flask and diluted to 1 litre. 2. Stock Fluoride 1000 mg/L (1 mL= 1 mg F) 221 mg anhydrous NaF was dissolved in a d.H2O and make upto 100 mL. 3. Std. Fluoride I 10 mg/L (1mL=0.01 mg F) Diluted 10 mL stock to 1000 mL 4. Std. Fluoride II 1 mg/L (1mL=0.01 mgF). Diluted 100 mL standard Fluoride 1 to 1000 mL 5. NaOH 6N Dissolved 60 g. NaOH in 250 mL d.H2O. 3.5.6 HARDNESS A.Procedure 25 mL of sample or lesser volume of sample was taken and diluted to 50 mL. 1 mL of buffer 1 mL of Na2S inhibitor and 1 mL calmagite indicator were added. It is then titrated against standard EDTA. The end point was noted when the change of colour from pinkish red to blue. B. Calculation ` mL EDTA x 1000 Total hardness as CaCO3 mg/L = - ------------------------- x C.F mL sample Where C.F = Correction Factor
- 12. 69 C. Reagent S.No Buffer Reagent preparation 1. Buffer 11 mL conc.HCl with 80 mL d.H2O was mixed slowly with stirring 60 mL 2- amino ethanol was added. Then 1 g Mg salt of EDTA was added and diluted to 200 mL. 2. Inhibitor Dissolved 5 g Na2 S9H2O or 3.7 g Na2 S. 5H2O in 100 mL d.H2O 3. Calmagite indicator Dissolved 0.25 calmagite indicated in 250 mL.d.H2O. 4. Std.EDTA. 0.01 M Dissolved 3.723 g sodium salt of EDTA in d.H2O and make upto 1000 mL. 5. Std. Calcium (1 mL = 1 mg CaCO3) 250 mg anhydrous CaCO3 was taken in a beaker. Then 1+1 HCl added to dissolve CaCO3 50 mL of d.H2O was added and boiled for few minutes. After cooling 2 drops of methyl red indicator was added. Using 3N NH4 OH or 1+1 HCl adjusted to an intermediate orange colour and make upto 250 mL. 6. Methyl Red indicator 0.1 g methyl red is dissolved in 100 mL isopropyl alcohol. Correction factor : To 10 mL of calcium standard 1 mL buffer 1 mL inhibitor and 1 mL indicator were added. This was titrated against standard EDTA. End point was pinkish red to blue colour. Titrate value was then noted. 10 Correction Factor = ----------------------------------- mL Titrate volume of EDTA. 3.5.7. IRON as Fe PROCEDURE Ferrous Iron : In the field 50 mL of sample was collected in a bottle containing 1 mL. Conc.HCl. 20 mL of Phenanthroline solution and 10 mL. Am. Acetate solution was added. Stirring was carried out
- 13. 70 vigorously and diluted to 100 ml. O.D was measured at 510 nm within 5 to 10 minutes. Calculation O.D x slope x 100 Ferrous Iron = --------------------------- mL sample Calibration : 0,1,2,3,4,5 mL standard Iron was taken and make upto 50 ml with d.H2O 2ml conc.HCl and 1 ml NH2OH, HCl solution was added. The solution was heated and boiled and reduced to 20 ml. After cooling 10 mL Am. Acetate buffer and 4 mL phenanthroline solution were added and make upto 50 mL, O.D at 510 nm was measured and recorded the O.DS in the tabulation. C.Reagents S.No. Reagents Preparation 1. Conc. HCl - 2. NH2OH.HCl solution Dissolved 25 g NH2OH.HCl in 250 mL water. 3. Ammonium Acetate buffer Dissolved 250 g NH4C2H3O2 in 150 mL d.H2O. 700 mL glacial acetic acid was then added. 4. Phenanthroline Solution Dissolved 500 mg 1,10 phenanthroline mono hydrate in 500 mL. dH2O. 10 drops of Conc.HCl was added. 5. Stock Iron (1ml = 0.2 mg.Fe) To 5 mL Conc.H2SO4,12.5mL.d.H2O Was added and dissolved 0.351 g.Fe.Am.Sulphate. 0.1N KMnO4 added dropwise until a faint pink colour persists. Diluted to 250 mL. 6. Std.Iron (1mL=0.01 mg.Fe) 5mL stock Iron was diluted to 100 mL. 7. 0.1 N KMNO4 Dissolved 316 mg.KMNO4 in 100 mL.d.H2O.
- 14. 71 3.5.8 NITRATE (Electrode Method) Procedure Standard sample was prepared for potential measurement as under i) 10 mL d.H2O + 10 mL buffer. ii) 10 mL 10 mg/L std.NO3 + 10 mL buffer iii) 10 mL 100 mg/L std.NO3 + 10 mL buffer iv) 10 mL sample (or a portion diluted to 10 mL) + 10 mL buffer. Ion meter was standardized and the reading of the sample was noted. Calculation Nitrate as NO3 mg/L = Observed value x dilution factor in mg/L. Reagent S.No Reagent Preparation 1. Stock Nitrate (1 mL = 0.5 mg NO3) Dissolved 203.8 mg KNO3 (dried at 1050C for 24 hrs ) in 250 mL d.H2O. 2. 100 mg/L Std.NO3 50 mL stock was diluted to 250 mL 3. 10 mg/L Std.NO3 25 ml of 100 mg/l standard was diluted to 250 mL. 4. 1 mg/L Std.NO3 25 mL of 10 mg/L standard was diluted to 250 mL. 5. Buffer Dissolved 17.32. Al2(SO4)3 18 H2O,3.43g.Ag2SO4, 1.28g.H3BO3 and 2.52g. sulfamic acid (H2NSO3H) in about 800 mL.d.H2O. pH was adjusted to 3.0 by slowly adding 0.1N NaOH and diluted to 1000 mL. 6. Reference electrode filling solution. 0.53g (NH4)2 SO4 was dissolved in d.H2O and make upto 100 mL.
- 15. 72 3.5.9. pH VALUE A.Procedure Distilled H2O, 7.O pH buffer and 9.2 pH buffer were taken in a separate 50 mL beakers and they were accordingly be marked. First the pH electrode was dipped in distilled H2O, blot dried and then dipped in 7.00 pH . Meter knob was adjusted to read 7.00 pH. Again the electrode was dipped in distilled H2O, blot dried and then dipped in 9.2 pH and noted whether the reading was 9.2 +/- 0.1 which indicates that the instrument was functioning alright. Then each sample was taken in two beakers and marked them as nA and nB where n is the sample number. The electrode is dipped alternatively in nA and nB of successive samples. Every time the electrode is dipped in nA for 1 minute. The electrode is kept in the sample (nB) till the reading gets stablised. pH value of the sample was then recorded.(Dipping in nA was for rinsing electrode). B.Calculation pH. Value = Observed pH value for sample * slope. Note: When the meter indicates the correct values of pH for buffers 7.0 and 9.2, the slope =1. FORMULA FOR pH CALCULATION (observed pH value–7.0) If pH is > 7.0, pH for sample = 7.0+ ----------------------------- x 2.2 (observed pH value for 9.2 buffer – 7.0) (7.0 - observed pH value) If pH is < 7.0, pH for sample = 7.0- ------------------------------ x 3.0 (7.0 - observed pH value for 4.0 buffer)
- 16. 73 Reagent preparation S.No Reagent Preparation 1. pH buffer 4.0 Dissolved one pH 4.0 buffer tablet in 100 mL d.H2O 2. pH buffer 7.0 Dissolved one pH 7.0 buffer tablet in 100 mL d.H2O 3. pH buffer 9.2 Dissolved one pH 9.2 buffer tablet in 100 m d.H2O 4. pH buffer 3.557 Dissolved 5g KHC4H4O6 in 100 mL d.H2O 5. pH buffer 4.0004 Dissolved 1.012g KHC8H4O4 in 100 mL d.H2O 6. pH buffer 6.863 Dissolved 0.3387g KH2PO4 + 0.3353g Na2HPO4 in 100 mL d.H2O 7. pH buffer 7.415 Dissolved 0.1179g KH2PO4 + 0.43303g Na2HPO4 in 100 mL d.H2O 8. pH buffer 9.183 Dissolved 0.38g Na2B4O7.10H20 in 100 mL d.H2O 9. pH buffer 10.014 Dissolved 0.2092g NaHCO3 and 0.2640 g Na2CO3 in 100 mL d.H2O 10. pH buffer 12.454 Dissolved > 0.2g Ca(OH)2 in 100 mL d.H2O 11. pH buffer 1.679 Dissolved 1.261 g KH3C4O8.2H2O in 100 mL d.H2O Note : For preparation of buffer, freshly boiled and cooled H2O was used. 3.5.10 SULPHATE A. Procedure i) Distilled H2O was used for setting of nephelometer. ii) 100 NTU standard (used in turbidity test) was used for 100 setting of Nephelometer. iii) 50 mL of sample was taken in a 100 mL measuring cylinder with Penny head. 10 mL of buffer solution was added. Also 0.5 g BaCl2 was added and mixed well for 1 minute. After 5± 0.5 minutes NTU was measured.
- 17. 74 Calculation NTU for sample x slope x 50 Sulphate mg/L = ------------------------------------------ Volume of Sample Reagents S.No Reagent Preparation 1. Buffer Solution This mix consists of 30 g MgCl2 6H2O + 5 g. CH3COONa 3H2O + 1g KNO3 + 0.11 g Na2SO4 + 20 mL CH3COOH (99%) + 500 mL. D.H2O make upto 1000 mL. 2. Barium chloride crystal (20-30 mesh) --- 3. Stock SO4 (1 mL = 10 mg SO4) 1.479 g anhydrous Na2SO4 was dissolved in d.H2O and diluted to 100 mL. 4. Std.SO4 (1 mL = (0.1 mg SO4) 1 mL stock SO4 was diluted to 100 mL. Calibration 0, 5, 10, 15 and 20 mL standard SO4 was taken in a separate measuring cylinders with penny head and make upto 50 mL. The procedure (i) (ii) and (iii) cited was followed and NTU was measured and tabulated in the form. Volume of std.SO4 mL SO4 mg in 50 mL SO4 mg/L (y axis) NTU (x axis) Slope 0 0 0 5 0.5 10 10 1.0 20 15 1.5 30 20 2.0 4.0
- 18. 75 3.5.11 TOTAL DISSOLVED SOLIDS A.PROCEDURE 100 mL of sample was taken (if EC is less than 2000 micromho/ cm) or less volume (if EC is greater than 2000 micromho/cm) in a preweighed evaporating dish. It is dried over a water bath and kept at 1800C ± 20C for one hour. Then it is cooled in a desiccator and the final weight was taken. B. CALCULATION Final weight – Initial weight Total Dissolved Solids at 1800C = --------------------------------- x 1000 Volume of sample C. VERIFICATION OF RESULTS Measured TDS at 1800C i) -------------------------------- = 1.0 to 1.2 Calculated TDS Where calculated TDS = 0.6 Alkalinity + Na + K + Ca + Mg + Cl + SO4 +SiO3 + NO3 + F Measured TDS at 1800C ii) -------------------------------- = 0.55 – 0.70 E.C 3.5.12 TURBIDITY A.PROCEDURE The sample was thoroughly shaken for disappearances of air bubbles. Turbidity free d.H2O (blank) was taken, turbidity standard (100 NTU/400 NTU) and the sample (or diluted sample) were poured into three different Turbidity meter tubes.
- 19. 76 Turbidity free (blank) is set for ‘0’ value Turbidity standard tube is set for ‘100 NTU’ value. Then the turbidity value of the sample was measured. B. CALCULATION 1. Turbidity in NTU = Measured NTU value x Dilution factor. (when 100 NTU is set for 100). 2. Turbidity in NTU = Measured NTU value x 4 x Dilution factor. (when 400 NTU is set for 100). C. Reagents S.No Reagent Preparation 1. Turbidity Solution I 1 gram of Hydrazine sulphate in d.H2O was dissolved and make upto 100 mL. 2. Turbidity Solution II 10 gram of Hexamethylene Tetramine was dissolved and makeup upto 100 mL. 3. 400 NTU 25 mL of solution I + 25 mL of solution II in a 500 mL standard flask is taken. After 24 hours at 25 ± 30C it was diluted to 500 mL. 4. 100 NTU 25 mL was diluted. 400 NTU standard to 100 mL with d.H2O. 5. Turbidity free d.H2O d.H2O was passed through 0.2 micron membrane filter. (or good quality of commercial bottled demineralised water). 3.6 Results of Analyses The results of analyses carried out for the twelve parameters in the water samples collected for 60 weeks in each sampling station are presented in Tables 3.3 to 3.27.