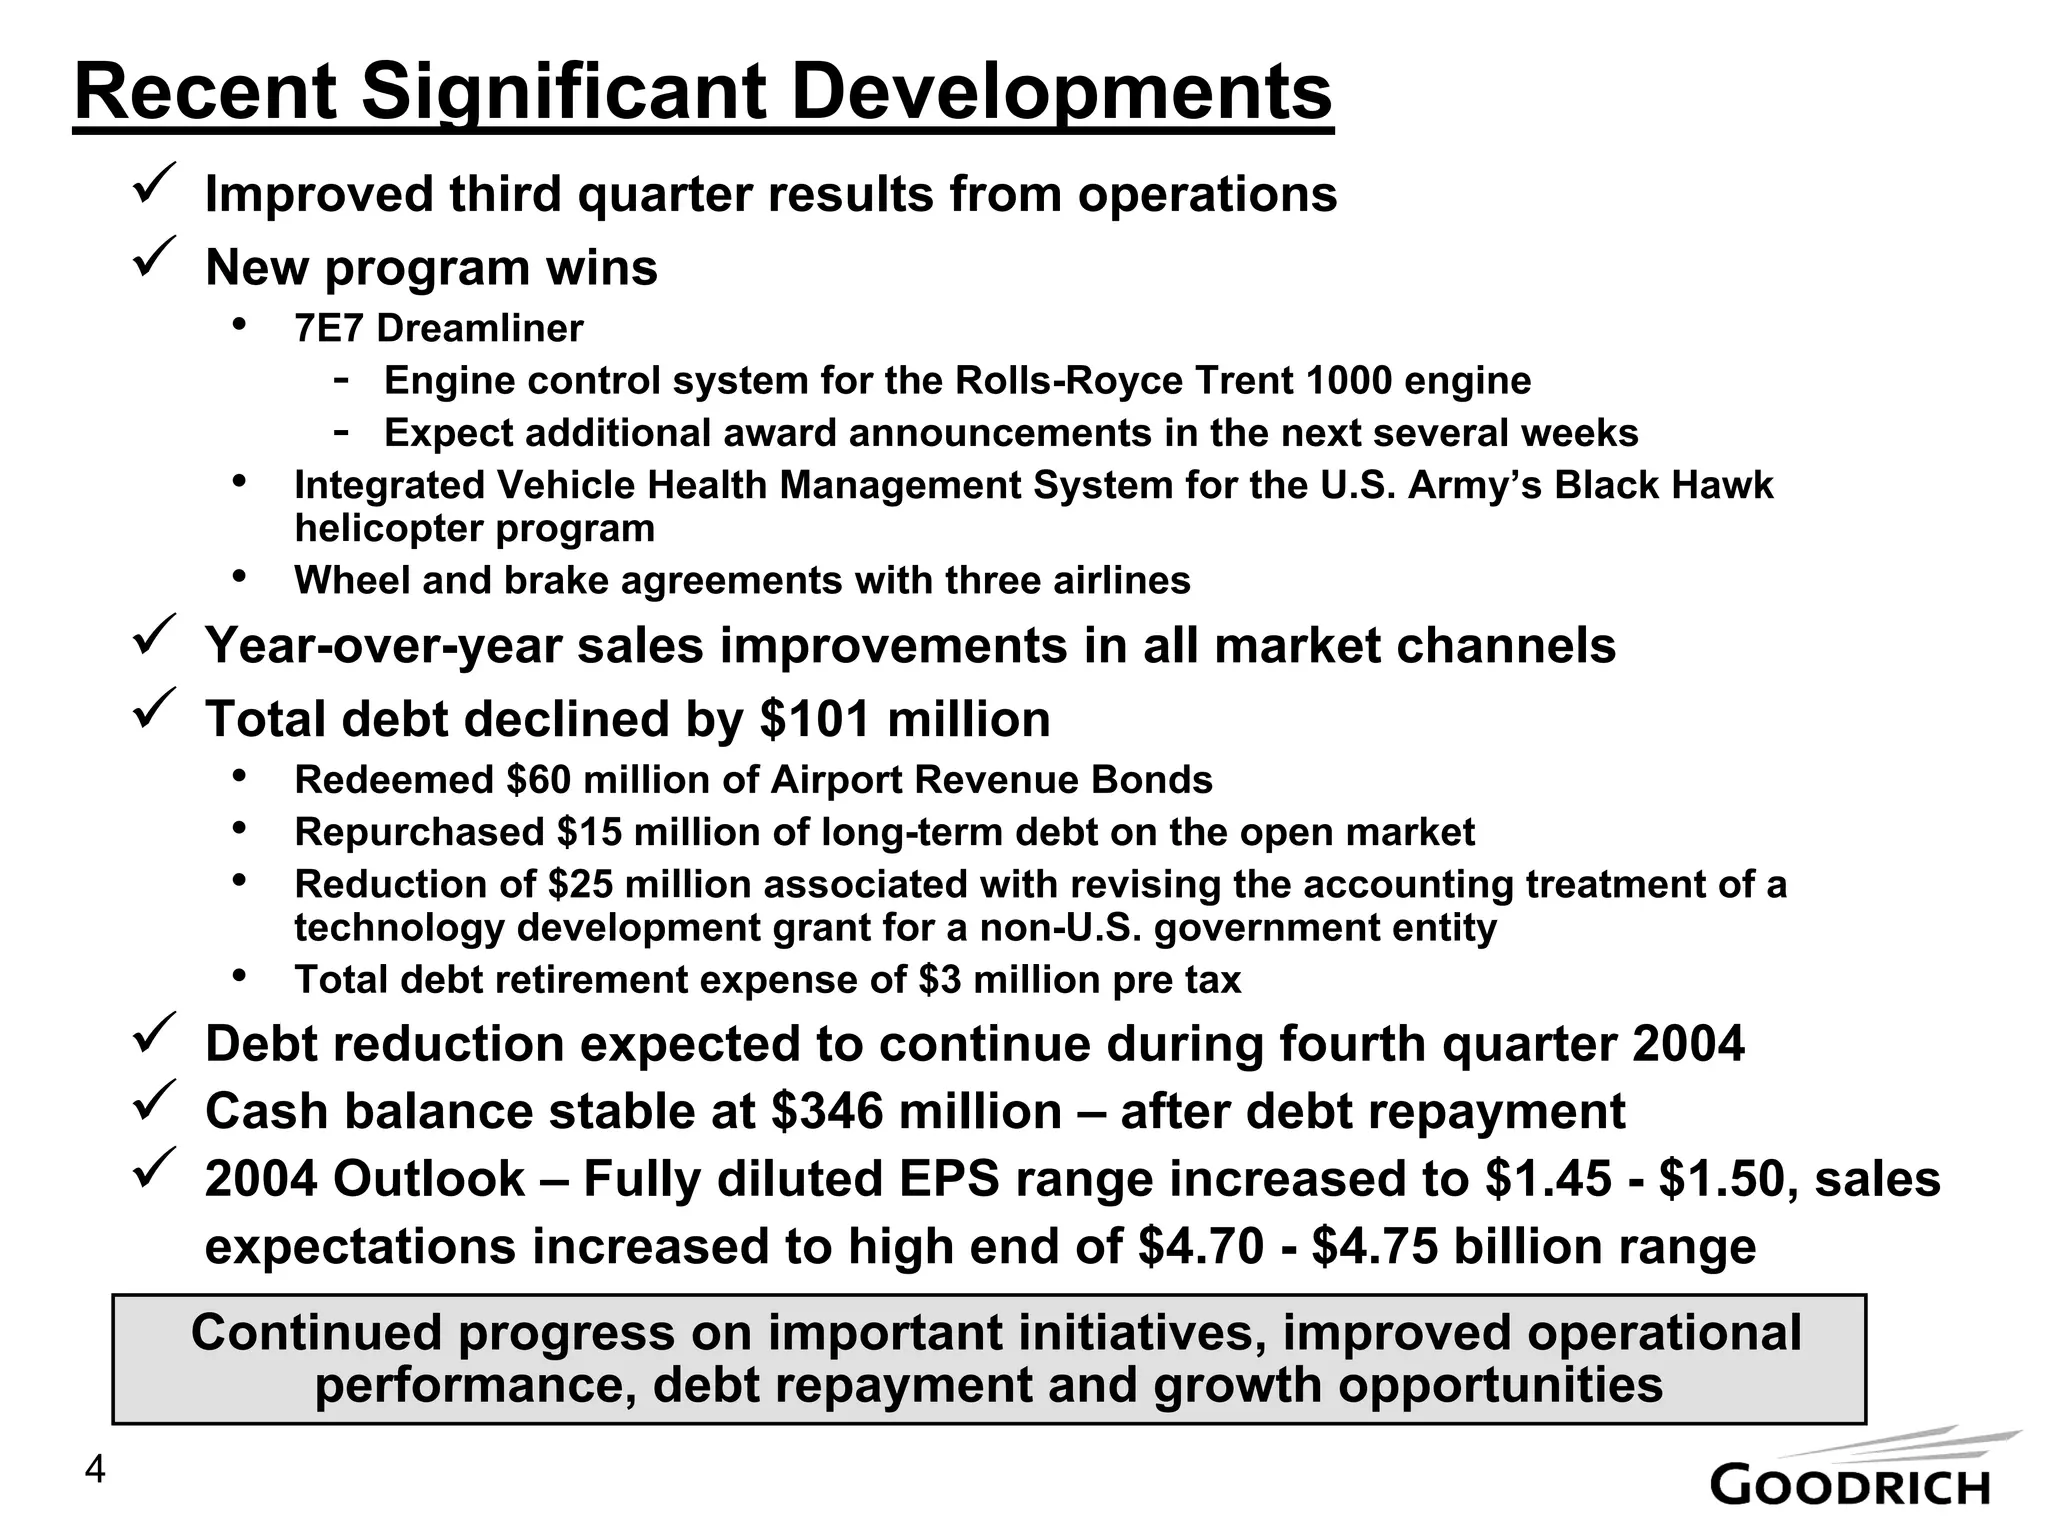
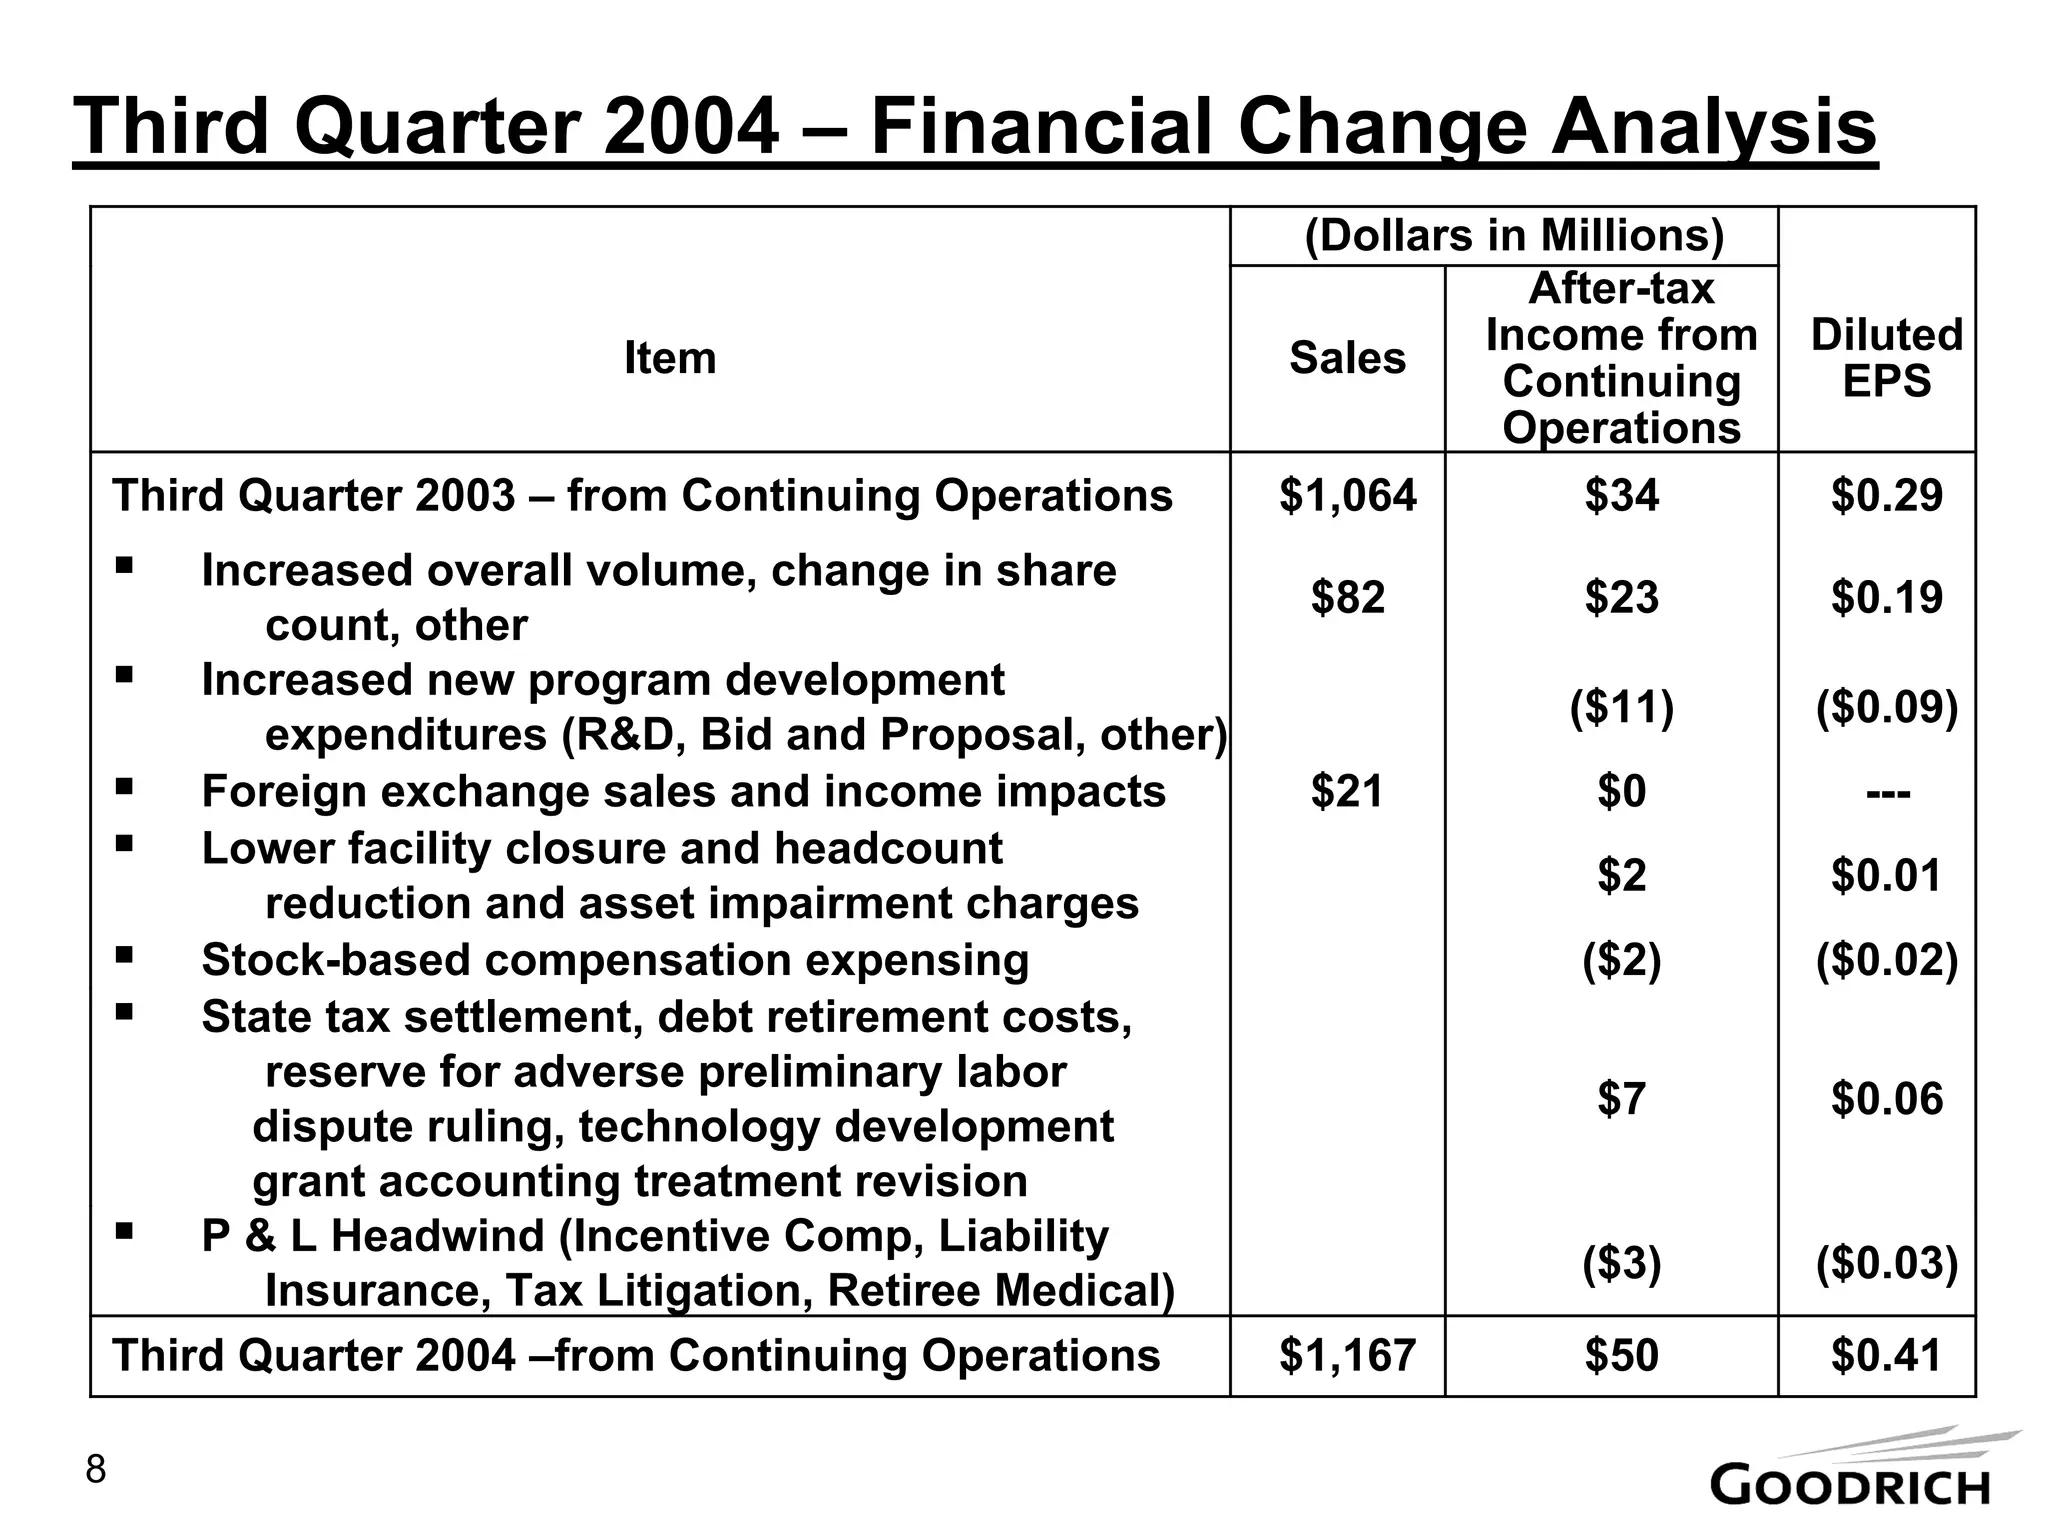
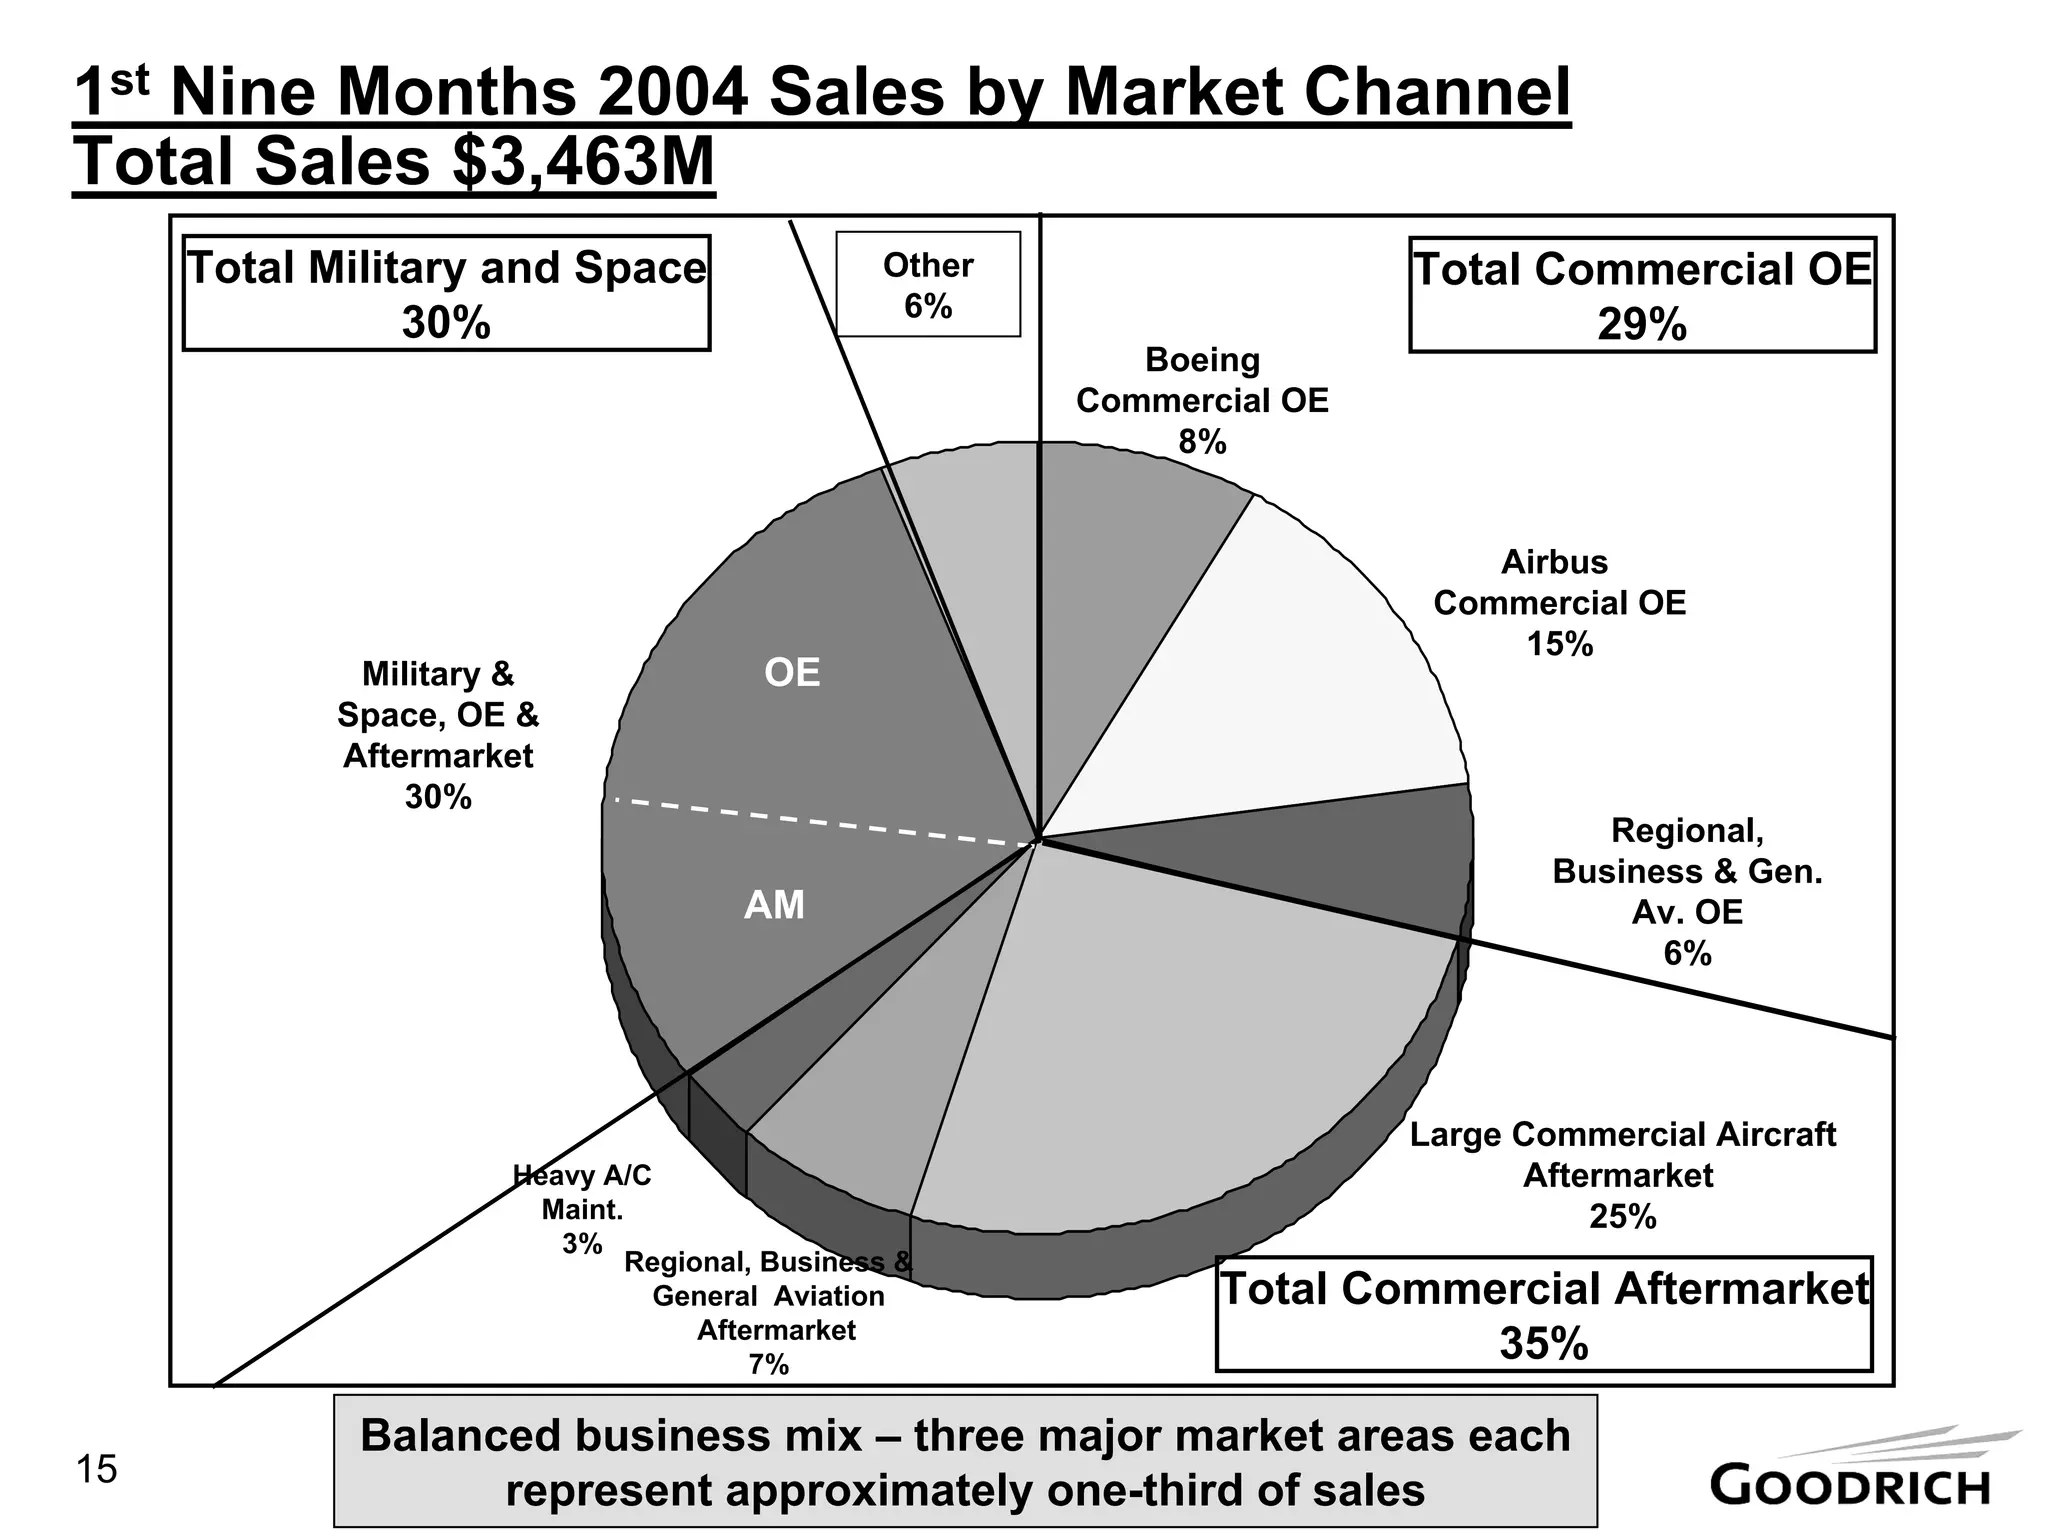
This document provides a summary of Goodrich Corporation's third quarter 2004 performance and financial results. Key points include:
- Sales increased 10% from Q3 2003 to $1.167 billion, with segment operating income up 12% to $132 million.
- New program wins included the Boeing 7E7 and U.S. Army Black Hawk helicopter.
- Total debt declined by $101 million through debt repayments and accounting adjustments.
- 2004 outlook for sales and EPS were increased based on improved performance.
- All market channels saw year-over-year sales growth in the first nine months of 2004.
- Goodrich Corporation reported strong financial results for the fourth quarter and full year 2004, with sales and earnings growth.
- Segment operating income increased 17% in the fourth quarter compared to 2003, driven by sales increases in all reportable segments.
- Full year 2004 sales grew 8% over 2003, with segment operating income increasing 56% due to higher volumes and efficiencies.
- The company reduced long-term debt by $131 million in the fourth quarter and continued strong cash generation with $298 million of cash on hand at year-end.
This document provides an overview of Goodrich Corporation's second quarter 2005 results. Some key points:
- Sales grew 20% compared to second quarter 2004, with increases across all market channels and segments.
- Net income per share grew 91% compared to second quarter 2004.
- The outlook for 2005 sales was increased to $5.2-5.3 billion, up from the prior outlook of $5.1-5.2 billion.
- The outlook for 2005 net income per share was increased to $2.00-$2.10, up from the prior outlook of $1.80-$1.95.
- Goodrich Corporation reported second quarter 2006 results, with sales growing 10% year-over-year and income from continuing operations increasing 30% to $81 million.
- The company raised its 2006 sales outlook to $5.75-5.85 billion and adjusted net income per diluted share outlook to $3.40-3.55 due to improved operational performance.
- Segment operating margins improved across all segments (Engine Systems, Airframe Systems, Electronic Systems), driven by higher commercial airplane original equipment and aftermarket sales as well as cost reductions.
- Major brands in the Consumer Foods segment that posted sales growth in Q4 FY06 included Blue Bonnet, Chef Boyardee, DAVID, Egg Beaters, Hebrew National, and Hunt's. Brands that posted sales declines included ACT II, Banquet, Healthy Choice, Peter Pan, Slim Jim, Snack Pack, and Van Camp's.
- Consumer Foods volume declined 2% in Q4 while Food and Ingredients volume increased 1%.
- Total depreciation and amortization for Q4 was approximately $85 million and approximately $353 million for all of FY06. Capital expenditures were approximately $92 million for Q4 and $288 million for FY
This document summarizes ConAgra Foods' earnings results for fiscal year 2005 (FY05) in a question and answer format. Some key details include:
- FY05 diluted EPS was $1.23, including $0.12 in expenses that impacted comparability.
- Major brands in the Retail Products segment that saw sales growth included ACT II, Banquet, and Blue Bonnet. Brands that saw declines included Armour and Butterball.
- Retail Products volume increased 2% while Foodservice Products volume decreased 2% in Q4.
- Total depreciation and amortization was approximately $351 million for FY05 and $90 million for Q4. Capital expenditures
The document provides earnings information for Raytheon Company for the fourth quarter and full year 2006. It summarizes key financial metrics including strong bookings, record backlog, increased sales and earnings per share, and record operating cash flow. It also provides Raytheon's financial outlook for 2007 with projections for sales, earnings per share, operating cash flow, and return on invested capital.
Major brands in the Retail Products segment that posted sales growth included ACT II, Blue Bonnet, Butterball, Kid Cuisine, Marie Callender's, Reddi-wip and Ro*Tel. Brands that posted sales declines included Armour, Banquet, Cook's, DAVID, Eckrich, Egg Beaters, Healthy Choice, Hebrew National, Hunt's, LaChoy, Orville Redenbacher, PAM, Parkay, Peter Pan, Slim Jim, Snack Pack, Swiss Miss, Van Camp's and Wesson. Retail Products volume declined 5% for the quarter while Foodservice Products volume increased 2%. Corporate expense for the quarter was approximately $103 million
The document provides financial information from ConAgra Foods' Q3 FY06 quarterly earnings call. Some key details include:
- Retail segment sales grew 4% and Foodservice grew 1% over the prior year. Several major brands posted sales growth while others declined.
- Gross margin was 24.8% and operating margin was 12.5% for the quarter.
- Net debt was $3.6 billion, down from $4.5 billion a year prior due to debt repayment of $500 million during the quarter.
- Capital expenditures for the quarter and fiscal year-to-date were below prior year levels. Projected fiscal year expenditures are up to $400
International Paper reported solid financial results for the first quarter of 2009 despite weak economic conditions. They achieved $96 million in synergies from the Industrial Packaging integration and $30 million from reduced overhead expenses. Operations performed excellently with 1.1 million tons of production without order downtime. The company also benefited from $124 million in lower input and freight costs compared to the previous quarter.
- Goodrich Corporation reported first quarter 2005 results, with sales growth of 10% and net income per share growth of 21% compared to first quarter 2004.
- The company increased its 2005 outlook with expected sales of $5.1-5.2 billion and net income per share of $1.80-$1.95.
- Segment operating income grew 28% in the first quarter due to increases in all market channels and reportable segments.
This document summarizes the Q1 FY2004 earnings results of a large packaged foods company. Key points include:
- Q1 EPS was $0.37 compared to $0.43 in Q1 FY2003, impacted by various one-time gains and losses.
- Packaged foods sales were down $168M excluding divested businesses, with a 5% volume decline.
- Several major brands saw growth, while others like Butterball declined.
- Corporate expenses increased due to litigation expenses from a past joint venture.
- The effective tax rate for FY2004 is estimated at 38%.
1) The document discusses Rohm and Haas' third quarter 2008 earnings results. Sales were up 12% to $2,471 million due to pricing actions, currency effects, acquisitions, and growth in rapidly developing economies, despite decreased demand in North America and Western Europe.
2) Adjusted earnings per share were up 3% to $0.90 due to cost controls and pricing actions offsetting deteriorating business conditions.
3) The Dow Chemical Company announced a definitive agreement to acquire Rohm and Haas for $78 per share in cash on July 10, 2008.
Weyerhaeuser Company reported earnings for the first quarter of 2004. Net income was $121 million compared to $92 million in the prior year quarter. Earnings per share were $0.54 compared to $0.41 in the previous year. The timberlands, wood products, and real estate segments saw increased operating earnings before special items, while pulp/paper and containerboard were lower. The company continued focusing on debt reduction, productivity improvements, and selling non-strategic assets. Management remains committed to meeting debt reduction goals.
This document summarizes an earnings conference call for Oshkosh Truck Corporation for the second quarter of fiscal year 2007. Sales increased 96.6% to $1.66 billion and operating income grew 69.1% to $134.8 million. For fiscal year 2007, the company estimates sales of $6.1-6.2 billion and operating income of $568-580 million. It also provides segment-level results and highlights for access equipment, defense, fire & emergency, and commercial.
- For fiscal year 2008, Disney reported EPS of $2.28, up slightly from $2.25 the prior year. Excluding certain items, EPS rose 18% to $2.27.
- Revenue increased 7% to $37.8 billion, with growth at Media Networks, Parks and Resorts, and Consumer Products.
- Segment operating income rose 8% to $8.5 billion, with double-digit increases at Media Networks and Parks and Resorts.
- However, Studio Entertainment operating income fell 9% on weaker home entertainment, and Broadcasting lost $150 million in the quarter.
This document summarizes the Q1 FY07 financial results of ConAgra Foods. Some key highlights include:
- Consumer Foods volume increased 1% and Food and Ingredients volume increased 2% in Q1.
- Gross margin was 24.7% and operating margin was 11.7% for the quarter.
- Net debt decreased to $2.88 billion from $3.97 billion in Q1 FY06.
- Restructuring charges totaled $39 million pre-tax, impacting costs in Consumer Foods and corporate expenses.
Goodrich Corporation reported fourth quarter 2007 results with the following highlights:
- Sales grew 12% to $1.668 billion compared to fourth quarter 2006, driven by strong commercial aftermarket sales.
- Segment operating income margin increased from 13.0% to 15.9% over the same period.
- Net income per diluted share increased 33% to $1.04, including $0.09 per share related to a settlement.
- For full year 2008, Goodrich expects sales growth of 11-13% to $7.1-7.2 billion and net income per diluted share growth of 10-14% to $4.15-$4.30, reflecting expected increases in commercial aircraft deliver
Raytheon reported strong financial results for the first quarter of 2006. Key highlights included earnings per share increasing 49% to $0.64, record backlog of $34.7 billion, and increased full-year guidance for EPS and operating cash flow. Segment results were positive across all business units. For the full year, Raytheon increased EPS guidance to $2.55-$2.65 and operating cash flow guidance to $1.9-$2.1 billion.
Goodrich Corporation reported first quarter 2008 results with sales growth of 13% and segment operating income margin increasing from 14.9% to 17.3%. Net income per diluted share increased 59% to $1.24, which includes $0.03 from discontinued operations. For full-year 2008, Goodrich increased its sales outlook to $7.2-7.3 billion (13-14% growth) and net income per diluted share outlook to $4.30-$4.45 (14-18% growth). Key drivers include strong demand for commercial aircraft and aftermarket services as well as defense programs.
This document provides information on Raytheon Company's fourth quarter and full-year 2007 earnings. Key highlights include record bookings of $9.2 billion in Q4 and $25.5 billion for the year. Sales were $6 billion in Q4 and $21.3 billion for the year, both up 8%. Earnings per share from continuing operations was $1.45 in Q4 and $3.80 for the year. The document also provides guidance for 2008, forecasting sales between $22.4-22.9 billion and EPS from continuing operations of $3.65-3.80.
Celanese Corporation reported strong financial results for the second quarter and first half of 2006, with net sales increasing 11% compared to the previous year. Operating profit rose 7% for the quarter and 17% for the first half, driven by continued strong demand across business segments. Adjusted earnings per share increased 34% for the quarter and 18% for the first half. All business segments saw higher sales and improved operating performance compared to the previous year.
Do you need quality construction craftsmen?Lee A. Clark
This document announces a research project between PayCrew, LLC and Clemson University's Construction Science Department to change how the construction industry recruits, trains, measures, and retains craftsmen. The project seeks participants from general contractors and subcontractors in all trades who are committed to the goals of establishing accurate production measurements, clear goals for employees, measuring talents based on standardized cost codes, developing an incentive system, and creating a historical database. Participants must be willing to share results and meet bi-weekly or quarterly. In exchange, participants will receive free use of PayCrew's daily production software and the shared historical database, along with publicity during the research project. Interested participants should contact Lee A. Clark.
"Improving the image of construction" - presentation delivered by Paul Wilkinson, chair of the CIPR's construction and property group (CAPSIG) to the Constructing Excellence annual members convention in London on Friday 14 November 2014.
This magazine article summarizes an interview with the Seattle-based solo musician Chris Mansfield, who performs under the name Fences. Some key details from the interview include that Fences cites Elliott Smith as a major musical influence and enjoys recording with other local artists. He drinks alcohol daily but does not do other drugs, and hopes to tour and release a full-length album if given the opportunity. Fences aims to convey emotion through his intimate folk songs and wants listeners to feel something when they listen to his music.
Respuestas de preguntas nucleo comun saber 11.yelsinsilva
Este documento presenta las preguntas y respuestas clave de varias materias de un examen de estado, incluyendo las áreas de matemáticas, lenguaje, biología, química, física, ciencias sociales y filosofía. Enumera cada pregunta con su número, componente temático evaluado y competencia evaluada.
Just-in-Time knowledge - easy access to knowledge using the webpwcom.co.uk Ltd
Just-in-Time knowledge - easy access to knowledge using the web - presentation to Institution of Civil Engineers Learned Societies Forum, London, 11 June 2013
"Behaviours4Collaboration" is a group looking at the behavioural changes needed to support collaborative working in general, and BIM (building information modelling) in particular. This presentation was delivered (Pecha Kucha style) at GreenBIM in Leeds on 3 December 2014
Pacific Aster is a native California perennial herb that grows 1-2 feet tall and spreads vigorously via rhizomes. It has thin, delicate foliage and droops back completely in dry summer months. From July to September, it produces small light purple, white, pink, or deeper purple daisy-like flowers that are very showy and attract native bees, butterflies, and seed-eating birds. Pacific Aster thrives in full sun to partial shade and any well-draining soil, making it a versatile choice for slopes, gardens, and habitat areas.
Flytraps are carnivorous plants that trap and digest insects for nutrients. They have hinged leaves with trigger hairs that snap shut when touched, trapping prey inside. Once triggered, the leaves will fully close in around three days and secrete enzymes to dissolve the trapped insect for nutrients. Venus flytraps have become rare due to habitat loss from draining of marshes.
What A Wonderful World By Louis Armstrong Obamabridgie308
The document contains the lyrics to the song "What a Wonderful World" by Louis Armstrong. In three sentences, the summary is:
The song expresses appreciation for the natural beauty of the world with references to green trees, red roses, blue skies, and white clouds. It also notes the diversity of people and their interactions, from rainbow colors to friends greeting each other. The singer reflects on how wonderful the world is throughout the song.
This document provides an autobiographical summary of the author's life experiences related to architecture. It describes how she was born in Sydney in 1973 and her family's connections to the opening of the Sydney Opera House. It details her family's move to Canberra in 1974 and her learning about Walter Burley Griffin and Marion Mahoney Griffin's role in designing Canberra. The document then summarizes her 1998 trip to the US to see famous works of architecture by Frank Lloyd Wright, Mies van der Rohe, and others. It concludes by outlining her 2008 trip to Europe to see buildings by Gehry, Gaudi, and other architects.
The QE index in Qatar declined 1.2% led by losses in the real estate and telecom indices. Vodafone Qatar and Salam International Investment Co. were the top losers falling 10% and 6.4% respectively. Trading volume rose by 6.9% but remained below the 30-day average. News articles discussed foreign direct investment increasing in Qatar's industrial sector to QR129 billion, the launch of a new airport lounge access program for QNB First credit card holders, and expectations for continued growth in Qatar's retail real estate sector.
The document compares the conventions used in the front cover and contents page of an existing pop music magazine to those used in the student's magazine. It discusses how the student incorporated typical conventions such as masthead, artist image, and barcode, but also developed conventions through choices like smaller text for the artist name and a unique main image. The student challenges some conventions by including only one front cover image and adding social media links to the contents page. Overall, the document demonstrates the student's understanding of magazine conventions and their creative adaptations and developments for their own publication.
- Goodrich Corporation reported strong financial results for the fourth quarter and full year 2004, with sales and earnings growth.
- Segment operating income increased 17% in the fourth quarter compared to 2003, driven by sales increases in all reportable segments.
- Full year 2004 sales grew 8% over 2003 and segment operating income increased 56%.
- The company reduced long-term debt by $131 million in the fourth quarter and made an additional $78 million in pension contributions, maintaining a strong cash balance of $298 million at year-end.
This document summarizes Goodrich's second quarter 2004 performance and provides an outlook for 2004. Key points include:
- Sales were up 4% in Q2 2004 versus Q3 2003 while net income increased 169% due to improved operational performance.
- For the first half of 2004, sales were up 5% and net income increased 95% year-over-year.
- Goodrich has paid down $904 million in debt since acquiring Aeronautical Systems in 2002 through strong cash flow.
- The outlook for 2004 anticipates sales of $4.70-4.75 billion and EPS of $1.30-1.40, representing growth over 2003.
- Goodrich has a balanced business mix across
This document summarizes Goodrich's second quarter 2004 performance and provides an outlook for 2004. Key points include:
- Sales were up 4% in Q2 2004 versus Q3 2003 driven by higher volume, though partially offset by foreign exchange impacts.
- Net income increased substantially due to improved operational performance and lower restructuring charges.
- Goodrich has paid down $904 million in debt since acquiring Aeronautical Systems and reduced net debt by $1.1 billion.
- Sales are expected to grow to $4.7-4.75 billion in 2004 with gains across various market channels.
- Goodrich Corporation reported second quarter 2006 results, with sales growing 10% year-over-year and income from continuing operations increasing 30% to $81 million compared to second quarter 2005.
- The company raised its 2006 sales outlook to $5.75-5.85 billion and adjusted net income per diluted share outlook to $3.40-3.55 due to improved operational performance.
- All business segments saw sales and operating income increases compared to second quarter 2005, driven by higher commercial airplane original equipment and aftermarket sales as well as cost improvements.
The document provides an overview of Goodrich Corporation's financial and operational performance in the first quarter of 2004. Key points include:
- Sales increased 6% to $1.162 billion compared to the same period in 2003.
- Segment operating income increased significantly to $118 million from $19 million due to lower restructuring charges and higher sales.
- New program wins on the 7E7 and A380 are expected to fuel future growth.
- Debt has been reduced by 29% since acquiring Aeronautical Systems in 2002.
- The outlook for 2004 is sales of $4.65-4.7 billion and diluted EPS at the upper end of $1.20-1.35 range.
1) Goodrich Corporation reported first quarter 2005 results with sales growth of 10% and net income per share growth of 21% compared to first quarter 2004.
2) Financial outlook for 2005 was increased with sales expected to be $5.1-5.2 billion and net income per share of $1.80-1.95.
3) Recent developments included higher sales and profits in all business segments, debt reduction of $100 million, and new contracts including providing nacelles for the Airbus A350.
Goodrich Corporation reported its second quarter 2005 results. Sales grew 20% compared to the second quarter of 2004, with increases across all market channels and reportable segments. Net income per share grew 91% compared to the same period last year. The company increased its 2005 sales and earnings per share outlook. However, results in the Airframe Systems segment were down 57% due to a $15 million charge for retrofitting redesigned parts for the A380 aircraft's actuation system.
The document provides a financial and operational performance review for the 4th quarter and full year of 2003. Some key points:
- Full year 2003 cash flow from operations was $553 million, up 6% from 2002, with sales of $4.4 billion and EPS of $0.93.
- EPS for 2004 is expected to be between $1.20-$1.35, including the impact of a contract accounting change and stock option expensing.
- The 4th quarter saw income from continuing operations of $33 million and net income of $33 million.
- Total debt has been reduced through debt retirement and increased cash holdings since acquiring Aeronautical Systems.
Goodrich Corporation announced third quarter 2004 results with net income of $50 million, up from $34 million in third quarter 2003. Sales increased to $1.167 billion from $1.064 billion. Goodrich increased its full year 2004 outlook with sales expected to be at the high end of $4.7-4.75 billion range and earnings per share expected to be $1.45-1.50, up from previous estimates. Goodrich saw increased sales across all market channels and gained new contracts for the Boeing 7E7 and Sikorsky UH-60M helicopter.
Goodrich Corporation reported third quarter 2005 results with the following highlights:
- Sales grew 18% compared to third quarter 2004, with double-digit increases in all market channels and reportable segments.
- Net income per diluted share grew 20% compared to third quarter 2004.
- Full year 2005 outlook for sales is approximately $5.3 billion, with net income per diluted share outlook unchanged at $2.00-$2.10.
Goodrich Corporation reported third quarter 2005 results. Sales grew 18% compared to third quarter 2004, with double-digit increases in all market channels and reportable segments. Net income per share grew 20%. The outlook for 2005 sales is approximately $5.3 billion, with the net income per share outlook unchanged at $2.00-$2.10. Fourth quarter 2005 is expected to have increased restructuring expenses, reduced Boeing sales and income, and a higher tax rate, reducing net income per share by approximately $0.08 compared to previous expectations.
The document provides an overview and analysis of Goodrich Corporation's fourth quarter and full year 2003 financial performance and outlook for 2004. Some key points:
- 2003 cash flow from operations was $553 million, up 6% from 2002. Sales were $4.383 billion and EPS was $0.93.
- Fourth quarter 2003 sales were $1.13 billion and EPS from continuing operations was $0.28.
- Full year sales growth is expected to be low single digits in 2004, and EPS is forecasted to be between $1.20-$1.35.
- Several factors are expected to create headwinds in 2004, including higher pension and healthcare costs, foreign exchange impacts
Goodrich Corporation announced its second quarter 2004 results, reporting a net income of $39 million compared to $14 million in the second quarter of 2003. Sales increased to $1,134 million from $1,095 million. Goodrich also increased its full year 2004 outlook, expecting sales between $4.7-4.75 billion and fully diluted earnings per share between $1.30-1.40. The increased outlook was due to improving conditions in commercial aerospace aftermarket and military and space markets.
Goodrich Corporation announced its second quarter 2004 results, reporting a net income of $39 million compared to $14 million in the second quarter of 2003. Sales increased to $1,134 million from $1,095 million. Goodrich also increased its full year 2004 outlook, expecting sales between $4.7-4.75 billion and fully diluted earnings per share between $1.30-1.40, up from its previous outlook. The increased outlook was due to better than expected commercial aerospace aftermarket and military and space sales.
The document provides the quarterly and annual financial results for a company. Some key highlights include:
- Several consumer brands posted sales growth for the quarter including Banquet, Blue Bonnet, and Chef Boyardee, while others like ACT II and Eckrich saw declines.
- Total depreciation and amortization was around $93 million for the quarter and $352 million for the fiscal year.
- Capital expenditures were around $106 million for the quarter and $352 million for the fiscal year.
- Net interest expense was $80 million for the quarter and $275 million for the fiscal year.
- Corporate expenses were around $95 million for the quarter and $342 million
Paul Gifford, Vice President of Investor Relations at Goodrich, presented at the Gabelli 10th Annual Aircraft Supplier Conference in New York on September 9, 2004. Goodrich reported improved financial results in the first half of 2004, with sales up 5% and segment operating income up 146% compared to the first half of 2003. Goodrich also continues to pay down debt and has a balanced mix of sales across commercial, military, and aftermarket channels. New program wins such as the 7E7 Dreamliner and Joint Strike Fighter are expected to add balanced future growth.
Vice President Paul Gifford presented at the Gabelli 10th Annual Aircraft Supplier Conference in New York on September 9, 2004. He discussed Goodrich's company overview and financial results for the first half of 2004, noting sales increased 5% to $2.296 billion compared to the first half of 2003. Segment operating income increased 146% to $245 million or 10.7% of sales, up from 4.5% in the prior year. Goodrich continues to pay down debt from its acquisition of Aeronautical Systems in 2003, having redeemed $60 million in bonds in August 2004.
Raytheon reported strong financial results for the fourth quarter and full year 2005. Fourth quarter sales increased 9% to $6.2 billion and income from continuing operations grew 15% to $282 million. For the full year, sales rose 8% to $21.9 billion and income from continuing operations increased 115% to $942 million. Raytheon also reduced its net debt by $1.3 billion in 2005 to $3.3 billion, the lowest level in ten years, and generated $2.1 billion in free cash flow from continuing operations for the full year. Looking ahead, Raytheon expects 2006 sales between $23.1-23.6 billion and earnings per share from continuing operations of $
Robert G. Bohn, Chairman, President and CEO of Oshkosh Truck Corporation, and Charles L. Szews, Executive VP and CFO, reported record financial results for the first quarter of fiscal year 2006. Sales increased 22.5% to $790.3 million and operating income grew 28.6% to $87 million. EPS increased 28.6% to $0.72. For fiscal year 2006, the company estimates sales between $3.3-3.4 billion, operating income between $316.5-329 million, and EPS between $2.55-2.65, representing growth of 17-21.6%.
1) Oshkosh reported record second quarter fiscal year 2006 results with sales up 25.6% and operating income up 27.3% driven by strong performance in the defense segment.
2) The defense segment results nearly doubled compared to the previous year due to growth in remanufactured and new truck sales, however challenges remain in locating used vehicle carcasses for remanufacturing.
3) The fire and emergency segment saw a temporary dip in earnings as anticipated due to heavily weighted airport product sales in the second half of the year and two component issues that delayed revenue recognition.
Robert G. Bohn, Chairman, President and CEO of Oshkosh Truck Corporation, discussed the company's strong third quarter fiscal year 2006 results and provided an outlook for fiscal years 2006 and 2007. Some highlights included record sales and operating income for Q3 2006. The company also announced two acquisitions, AK Specialty Vehicles and Iowa Mold Tooling, expected to be accretive to earnings in fiscal 2007. For fiscal 2006, Oshkosh estimates sales growth of 14.9-16.6% and EPS growth of 24-26%. Fiscal 2007 estimates include sales of $3.65-$3.75 billion and EPS of $3.05-$3.15.
Oshkosh Truck Corporation presented an investor presentation on its proposed acquisition of JLG Industries, Inc. The presentation discussed Oshkosh's track record of successful acquisitions and shareholder value creation. It also outlined the objectives of acquiring JLG to support growth above 15%, diversify into the fast-growing aerial work platform market, and execute its long-term acquisition strategy. Finally, the presentation provided an overview of Oshkosh Truck Corporation and its proven strategy of new product leadership, operational excellence, and strategic acquisitions that have fueled strong sales and earnings growth.
Robert Bohn, Chairman of Oshkosh Truck Corporation, discussed the company's strong fiscal 2006 financial results and outlook for fiscal 2007. Key points include:
1) Fiscal 2006 sales increased 15.8% and operating income grew 22%, with EPS up 26.6%.
2) The acquisition of JLG Industries was announced, which will diversify the company and support growth of over 15%.
3) Fiscal 2007 stand-alone estimates include sales of $3.65-$3.75 billion and EPS of $3.05-$3.15, with the JLG acquisition expected to be modestly accretive.
In this earnings call, Oshkosh Truck Corporation discusses its first quarter 2007 results. Sales increased 27.4% to $1.01 billion due to the acquisition of JLG Industries. Operating income decreased 3.9% to $83.6 million and EPS decreased 23.6% to $0.55. The company increased its full-year 2007 EPS estimate range to $3.15 to $3.25 per share. JLG is meeting expectations and integration is progressing well. Defense sales were lower compared to strong prior year results while fire and emergency and commercial saw strong performance.
1) Oshkosh reported strong third quarter 2007 results with sales increasing 108% to $1.85 billion and operating income up 133% to $192.7 million.
2) Access equipment and defense led the growth in sales and operating income. The acquisition of JLG was accretive to EPS by $0.35 per share.
3) For fiscal year 2007, Oshkosh estimates sales between $6.3-6.35 billion and EPS between $3.35-3.40, and for fiscal year 2008 estimates sales between $7-7.2 billion and EPS between $4.15-4.35.
The document summarizes Oshkosh Truck Corporation's fourth quarter fiscal 2007 earnings conference call. It discusses record sales and operating income for fiscal 2007. Projections are provided for fiscal 2008, estimating sales between $7.1-7.3 billion and operating income between $690-715 million. Segment performances are reviewed, with access equipment and defense highlighted as key growth drivers. Estimates are also given for interest expense, tax rates, capital expenditures and debt levels for fiscal 2008.
Oshkosh Corporation held an earnings conference call to discuss its first quarter fiscal year 2008 results. Sales increased 49% to $1.5 billion due to strong growth in access equipment and defense, while earnings per share declined 9.1% to $0.50. For fiscal year 2008, the company estimates revenue of $7.1-7.3 billion, operating income of $675-700 million, and earnings per share of $4.15-4.35. Challenging economic conditions are impacting commercial and fire & emergency segments, but global initiatives and cost reductions will support the full-year outlook.
The document summarizes Oshkosh Corporation's earnings conference call for the second quarter of fiscal year 2008. Key highlights include sales increasing 6.7% to $1.8 billion and operating income rising 24.8% to $168.2 million. EPS grew 42.6% to $0.97. While access equipment and defense saw strong demand, commercial and fire & emergency faced challenging market conditions. The company maintained its fiscal year 2008 EPS estimate range of $4.15 to $4.35.
The document summarizes Oshkosh Corporation's earnings conference call for the third quarter of fiscal year 2008. It discusses increases in sales revenue but decreases in operating income and earnings per share compared to the previous year. Several initiatives are mentioned to manage costs and cash flow in changing market conditions. Business segment results are provided, with strength in access equipment and defense but challenges in commercial and fire & emergency sectors.
This document is the transcript from Oshkosh Corporation's earnings conference call for the fourth quarter of fiscal year 2008. It discusses Oshkosh's financial results for Q4 and fiscal year 2008, including sales, operating income, earnings per share, and debt reduction. It also provides an outlook for fiscal year 2009, estimating revenues of $6.3-6.7 billion, operating income of $350-400 million, and EPS of $1.65-2.05. The transcript reviews performance and outlook for each of Oshkosh's business segments and discusses its financing plans.
Robert Bohn and David Sagehorn of Oshkosh Corporation gave a presentation at the Goldman Sachs Conference in November 2008. They discussed Oshkosh's strong financial position and actions taken to reduce costs and debt. While market conditions were volatile due to the economic downturn, Oshkosh was well positioned with backlogs in defense, fire, and refuse collection vehicles. The presentation outlined Oshkosh's segments and strategies to manage through the difficult economy.
1) The document is from a presentation given by Oshkosh executives Charles Szews and David Sagehorn at the R.W. Baird Industrial Conference on November 12, 2008.
2) Oshkosh reported sales increased 13.2% to $7.1 billion in fiscal 2008, with international sales reaching $2.1 billion. However, operating income decreased 1.5% and EPS decreased 5.9% due to non-cash impairment charges.
3) Oshkosh recently secured multiple defense contracts and sees opportunities in the domestic refuse collection vehicle market, but the current market volatility and credit crisis make fiscal 2009 projections difficult given exposure to construction and municipal spending.
Charles Szews, President and COO of Oshkosh Corporation, presented at the Cowen and Company Aerospace & Defense Conference on February 5, 2009. He discussed Oshkosh's business segments, products, competitive advantages, challenges, and actions taken in response to the economic downturn. Key points included reduced revenues and earnings in Q1 2009, cost reduction efforts, and focus on core businesses with strong backlogs like defense and fire apparatus that have gained market share.
Oshkosh Corporation held an earnings conference call to discuss its first quarter fiscal year 2008 results. Sales increased 49% to $1.5 billion due to strong growth in access equipment and defense, while earnings per share declined 9.1% to $0.50. For fiscal year 2008, the company estimates revenue of $7.1-7.3 billion, operating income of $675-700 million, and earnings per share of $4.15-4.35. Challenging economic conditions are impacting commercial and fire & emergency segments, but global initiatives and cost reductions will support the full-year outlook.
The document summarizes Oshkosh Corporation's earnings conference call for the second quarter of fiscal year 2008. Key highlights include sales increasing 6.7% to $1.8 billion and operating income rising 24.8% to $168.2 million. EPS grew 42.6% to $0.97. While access equipment and defense saw strong demand, commercial and fire & emergency faced challenging market conditions. The company maintained its fiscal year 2008 EPS estimate range of $4.15 to $4.35.
This document contains the transcript from Oshkosh Corporation's earnings conference call for the third quarter of fiscal year 2008. Key highlights include a 6.6% increase in quarterly sales to $1.97 billion but a 5.9% decrease in operating income to $181.2 million. EPS for the quarter decreased 1.7% to $1.19. Oshkosh revised its estimate for full year 2008 EPS to a range of $3.15 to $3.30.
This document summarizes an earnings conference call for Oshkosh Corporation for the fourth quarter of fiscal year 2008. It discusses the company's financial results including a 5.8% increase in sales to $1.9 billion but a 32% decrease in operating income to $122 million. The document also provides an overview of Oshkosh's fiscal year 2008 results and discusses challenges faced in various business segments due to economic conditions. It notes actions taken by the company to reduce costs and debt. An outlook is given for fiscal year 2009 noting market volatility and a plan to drive over $500 million in debt reduction. Business segment results and outlooks are also summarized.
The document outlines an annual investor conference for Goodrich Corporation to be held on October 30, 2003. The morning session will include introductory comments by Marshall Larsen and a financial review by Rick Schmidt. Breakout sessions will cover Airframe Systems, Engine Systems, and Electronic Systems with a panel Q&A. The afternoon will include an informal lunch and company and market overviews by Marshall Larsen.
In a tight labour market, job-seekers gain bargaining power and leverage it into greater job quality—at least, that’s the conventional wisdom.
Michael, LMIC Economist, presented findings that reveal a weakened relationship between labour market tightness and job quality indicators following the pandemic. Labour market tightness coincided with growth in real wages for only a portion of workers: those in low-wage jobs requiring little education. Several factors—including labour market composition, worker and employer behaviour, and labour market practices—have contributed to the absence of worker benefits. These will be investigated further in future work.
Fabular Frames and the Four Ratio ProblemMajid Iqbal
Digital, interactive art showing the struggle of a society in providing for its present population while also saving planetary resources for future generations. Spread across several frames, the art is actually the rendering of real and speculative data. The stereographic projections change shape in response to prompts and provocations. Visitors interact with the model through speculative statements about how to increase savings across communities, regions, ecosystems and environments. Their fabulations combined with random noise, i.e. factors beyond control, have a dramatic effect on the societal transition. Things get better. Things get worse. The aim is to give visitors a new grasp and feel of the ongoing struggles in democracies around the world.
Stunning art in the small multiples format brings out the spatiotemporal nature of societal transitions, against backdrop issues such as energy, housing, waste, farmland and forest. In each frame we see hopeful and frightful interplays between spending and saving. Problems emerge when one of the two parts of the existential anaglyph rapidly shrinks like Arctic ice, as factors cross thresholds. Ecological wealth and intergenerational equity areFour at stake. Not enough spending could mean economic stress, social unrest and political conflict. Not enough saving and there will be climate breakdown and ‘bankruptcy’. So where does speculative design start and the gambling and betting end? Behind each fabular frame is a four ratio problem. Each ratio reflects the level of sacrifice and self-restraint a society is willing to accept, against promises of prosperity and freedom. Some values seem to stabilise a frame while others cause collapse. Get the ratios right and we can have it all. Get them wrong and things get more desperate.
Discover the Future of Dogecoin with Our Comprehensive Guidance36 Crypto
Learn in-depth about Dogecoin's trajectory and stay informed with 36crypto's essential and up-to-date information about the crypto space.
Our presentation delves into Dogecoin's potential future, exploring whether it's destined to skyrocket to the moon or face a downward spiral. In addition, it highlights invaluable insights. Don't miss out on this opportunity to enhance your crypto understanding!
https://36crypto.com/the-future-of-dogecoin-how-high-can-this-cryptocurrency-reach/
South Dakota State University degree offer diploma Transcriptynfqplhm
办理美国SDSU毕业证书制作南达科他州立大学假文凭定制Q微168899991做SDSU留信网教留服认证海牙认证改SDSU成绩单GPA做SDSU假学位证假文凭高仿毕业证GRE代考如何申请南达科他州立大学South Dakota State University degree offer diploma Transcript
Understanding how timely GST payments influence a lender's decision to approve loans, this topic explores the correlation between GST compliance and creditworthiness. It highlights how consistent GST payments can enhance a business's financial credibility, potentially leading to higher chances of loan approval.
Falcon stands out as a top-tier P2P Invoice Discounting platform in India, bridging esteemed blue-chip companies and eager investors. Our goal is to transform the investment landscape in India by establishing a comprehensive destination for borrowers and investors with diverse profiles and needs, all while minimizing risk. What sets Falcon apart is the elimination of intermediaries such as commercial banks and depository institutions, allowing investors to enjoy higher yields.
[4:55 p.m.] Bryan Oates
OJPs are becoming a critical resource for policy-makers and researchers who study the labour market. LMIC continues to work with Vicinity Jobs’ data on OJPs, which can be explored in our Canadian Job Trends Dashboard. Valuable insights have been gained through our analysis of OJP data, including LMIC research lead
Suzanne Spiteri’s recent report on improving the quality and accessibility of job postings to reduce employment barriers for neurodivergent people.
Decoding job postings: Improving accessibility for neurodivergent job seekers
Improving the quality and accessibility of job postings is one way to reduce employment barriers for neurodivergent people.
How Does CRISIL Evaluate Lenders in India for Credit RatingsShaheen Kumar
CRISIL evaluates lenders in India by analyzing financial performance, loan portfolio quality, risk management practices, capital adequacy, market position, and adherence to regulatory requirements. This comprehensive assessment ensures a thorough evaluation of creditworthiness and financial strength. Each criterion is meticulously examined to provide credible and reliable ratings.
Independent Study - College of Wooster Research (2023-2024) FDI, Culture, Glo...AntoniaOwensDetwiler
"Does Foreign Direct Investment Negatively Affect Preservation of Culture in the Global South? Case Studies in Thailand and Cambodia."
Do elements of globalization, such as Foreign Direct Investment (FDI), negatively affect the ability of countries in the Global South to preserve their culture? This research aims to answer this question by employing a cross-sectional comparative case study analysis utilizing methods of difference. Thailand and Cambodia are compared as they are in the same region and have a similar culture. The metric of difference between Thailand and Cambodia is their ability to preserve their culture. This ability is operationalized by their respective attitudes towards FDI; Thailand imposes stringent regulations and limitations on FDI while Cambodia does not hesitate to accept most FDI and imposes fewer limitations. The evidence from this study suggests that FDI from globally influential countries with high gross domestic products (GDPs) (e.g. China, U.S.) challenges the ability of countries with lower GDPs (e.g. Cambodia) to protect their culture. Furthermore, the ability, or lack thereof, of the receiving countries to protect their culture is amplified by the existence and implementation of restrictive FDI policies imposed by their governments.
My study abroad in Bali, Indonesia, inspired this research topic as I noticed how globalization is changing the culture of its people. I learned their language and way of life which helped me understand the beauty and importance of cultural preservation. I believe we could all benefit from learning new perspectives as they could help us ideate solutions to contemporary issues and empathize with others.
Optimizing Net Interest Margin (NIM) in the Financial Sector (With Examples).pdfshruti1menon2
NIM is calculated as the difference between interest income earned and interest expenses paid, divided by interest-earning assets.
Importance: NIM serves as a critical measure of a financial institution's profitability and operational efficiency. It reflects how effectively the institution is utilizing its interest-earning assets to generate income while managing interest costs.
2. Forward Looking Statements
Certain statements made in this presentation are forward-looking statements within the meaning
of the Private Securities Litigation Reform Act of 1995 regarding the Company's future plans,
objectives, and expected performance. The Company cautions readers that any such forward-
looking statements are based on assumptions that the Company believes are reasonable, but are
subject to a wide range of risks, and actual results may differ materially.
Important factors that could cause actual results to differ include, but are not limited to: the extent
to which the Company is successful in integrating Aeronautical Systems in a manner and a
timeframe that achieves expected cost synergies and operating synergies; demand for and market
acceptance of new and existing products, such as the Airbus A380, the Boeing 7E7, the Joint
Strike Fighter, the Embraer 190 and the Boeing 717; and other factors discussed in the Company's
filings with the Securities and Exchange Commission, including in the Company's Annual Report
on Form 10-K for the year ended December 31, 2003.
The Company cautions you not to place undue reliance on the forward-looking statements
contained in this presentation, which speak only as of the date on which such statements were
made. The Company undertakes no obligation to release publicly any revisions to these forward-
looking statements to reflect events or circumstances after the date on which such statements
were made or to reflect the occurrence of unanticipated events.
2
4. Recent Significant Developments
Improved third quarter results from operations
New program wins
• 7E7 Dreamliner
- Engine control system for the Rolls-Royce Trent 1000 engine
- Expect additional award announcements in the next several weeks
• Integrated Vehicle Health Management System for the U.S. Army’s Black Hawk
helicopter program
• Wheel and brake agreements with three airlines
Year-over-year sales improvements in all market channels
Total debt declined by $101 million
• Redeemed $60 million of Airport Revenue Bonds
• Repurchased $15 million of long-term debt on the open market
• Reduction of $25 million associated with revising the accounting treatment of a
technology development grant for a non-U.S. government entity
• Total debt retirement expense of $3 million pre tax
Debt reduction expected to continue during fourth quarter 2004
Cash balance stable at $346 million – after debt repayment
2004 Outlook – Fully diluted EPS range increased to $1.45 - $1.50, sales
expectations increased to high end of $4.70 - $4.75 billion range
Continued progress on important initiatives, improved operational
performance, debt repayment and growth opportunities
4
5. Sales Trends
Sales ($ in Millions)
$1,400
$1,200
$1,000
$800
$1,237
to
$600 $1,162 $1,167
$1,157 $1,134
$1,130
$1,095
$1,094 $1,064 $1,287
$400
$200
$0
Q4 2002
Q1 2003
Q2 2003
Q3 2003
Q4 2003
Q1 2004
Q2 2004
Q3 2004
Estimate
Q4 2004
Highest quarterly aerospace sales in our history during third quarter
2004; sales expected to increase during fourth quarter 2004
5 Note: All sales restated to reflect discontinued operations
6. Third Quarter 2004 – Financial Summary
3rd Qtr 3rd Qtr
(Dollars in Millions, excluding EPS) 2004 2003 Change
Sales $1,167 $1,064 10%
Segment operating income $132 $118 12%
- % of Sales 11.3% 11.1% +0.2%
Income
- Continuing Operations and Net $50 $34 47%
Income
Diluted EPS
- Continuing Operations and Net $0.41 $0.29 41%
Income
6
7. First nine months 2004 – Financial Summary
First nine First nine
(Dollars in Millions, excluding EPS) months months Change
2004 2004
Sales $3,463 $3,253 6%
Segment operating income $377 $217 73%
- % of Sales 10.9% 6.7% +4.2%
Income
- Continuing operations $119 $16 NM
- Net income $136 $78 74%
Diluted EPS
- Continuing operations $1.00 $0.13 NM
- Net income $1.13 $0.66 71%
7
8. Third Quarter 2004 – Financial Change Analysis
(Dollars in Millions)
After-tax
Income from Diluted
Item Sales
Continuing EPS
Operations
Third Quarter 2003 – from Continuing Operations $1,064 $34 $0.29
Increased overall volume, change in share
$82 $23 $0.19
count, other
Increased new program development
($11) ($0.09)
expenditures (R&D, Bid and Proposal, other)
Foreign exchange sales and income impacts $21 $0 ---
Lower facility closure and headcount
$2 $0.01
reduction and asset impairment charges
Stock-based compensation expensing ($2) ($0.02)
State tax settlement, debt retirement costs,
reserve for adverse preliminary labor
$7 $0.06
dispute ruling, technology development
grant accounting treatment revision
P & L Headwind (Incentive Comp, Liability
($3) ($0.03)
Insurance, Tax Litigation, Retiree Medical)
Third Quarter 2004 –from Continuing Operations $1,167 $50 $0.41
8
9. Third Quarter 2004 - Airframe Systems Segment
3rd Quarter 3rd Quarter Change
Dollars in Millions $ %
2004 2003
Sales $400 $374 $26 7%
Segment OI $28 $18 $10 55%
% Sales 6.9% 4.8%
Included above:
Facility Closure and $0 ($2) $2 N/A
Headcount
Reductions/Asset
Impairment
Major Variances:
• Sales
- The increase was primarily due to:
– Increased sales of aircraft wheels and brakes, actuation systems, airframe heavy
maintenance services and engineered polymer products.
– Foreign currency translation of non-U.S. dollar sales.
• Segment Operating Income
- Improved results for wheels and brakes and airframe heavy maintenance.
- Pre tax benefit of $6 million for the revision of the accounting treatment of a technology
development grant from a non-US government entity.
- Higher new program research and development expenditures, primarily for actuation products.
- $2 million pre tax reserve for an adverse preliminary administrative ruling in a labor dispute.
- Reduced asset impairment, facility closure and headcount reduction charges of $2 million.
9
10. Third Quarter 2004 - Engine Systems Segment
3rd Quarter 3rd Quarter Change
Dollars in Millions $ %
2004 2003
Sales $475 $420 $55 13%
Segment OI $65 $63 $2 3%
% Sales 13.7% 15.0%
Included Above:
Facility Closure and ($2) ($2) --- N/A
Headcount Reductions/Asset
Impairment
Major Variances:
• Sales
- Increased commercial aircraft original equipment and aftermarket sales of aerostructures and
cargo systems products.
- Increased sales of fuel nozzle and injector components to the U.S. military and to engine
manufacturers for regional jets.
- Increased commercial and military component maintenance, repair and overhaul services sales.
- Increased sales of engine controls components to both the U.S. and various European military
customers and increased sales for nacelle development programs for the U.S. military.
- Favorable currency translation on non-U.S. dollar sales, primarily in the engine controls
business.
• Segment Operating Income
- Increased operating income was primarily due to the sales increases noted above, and a
favorable mix of sales.
- Partially offsetting these increases were higher new program research and development
expenditures.
10
11. Third Quarter 2004 - Electronic Systems Segment
3rd Quarter 3rd Quarter Change
Dollars in Millions $ %
2004 2003
Sales $293 $270 $23 8%
Segment OI $39 $37 $2 5%
% Sales 13.3% 13.7%
Included Above:
Facility Closure and Headcount ($2) ($2) --- N/A
Reductions/Asset Impairment
Major Variances:
• Sales
- Increased sales volume of regional and business jet aircraft original equipment and aftermarket
products for the De-Icing & Specialty Systems, Sensor Systems and Aircraft Lighting
businesses.
- Increased military and space sales for optical space systems products.
- Increased military spares sales in our propulsion products business.
- Decreases in sales in the commercial aftermarket products for Boeing & Airbus programs, due
to higher spares offset by lower retrofits and overhaul and repair activity.
• Segment Operating Income
- Increased sales volume noted above.
- Unfavorable mix of increased regional and business original equipment and decreased
commercial aftermarket sales.
- Increased research and development costs for new programs and bid and proposal costs
incurred in an effort to win new programs.
11
12. Summary Cash Flow Information
Item 3rd Qtr 3rd Qtr
(Dollars in Millions) 2004 2003
Net income from continuing operations $50 $34
Net restructuring and consolidation, asset impairments ($4) ($6)
Depreciation and Amortization $55 $55
Working Capital – (increase)/decrease – defined
($78) ($16)
as the sum of A/R, Inventory and A/P
Other current assets and other non-current assets and
$87 $60
liabilities, deferred income taxes and taxes payable
Cash Flow from Operations $110 $127
Cash Payments for Restructuring ($8) ($17)
Capital Expenditures ($32) ($28)
Pension Contributions ($9) ($6)
Major Variances – third quarter 2004 compared to third quarter 2003:
• Working capital – primarily due to:
- Increased non-product inventory for new product development
- Increased product inventory to support increased sales in fourth quarter 2004 and 2005
- Increased accounts receivable associated with late third quarter sales
- Accounts payable was a source of cash
12
13. Debt Retirement Progress Since Acquisition
of Aeronautical Systems
Total
Debt
$3,500 +
$ in Millions
Total
QUIPS
Debt
$3,039
$3,000 +
Total Total
Total
Cash $146 QUIPS Total
Debt Debt
Debt
$2,638 Debt
+ +
+
(includes Total
QUIPS QUIPS
$2,500 Total
QUIPS
Cash $150
Total
QUIPS) Debt
$2,261 $2,275 Debt
$2,262 $2,215 Debt
$2,153 $2,135
$2,034
Cash $186 Cash $268 Cash $326
$2,000 Net Debt Cash $378 Cash $330 Cash $356
+ QUIPS Cash $346
$2,893 Net Debt
+ QUIPS
$1,500 Net Debt
Net Debt
Net Debt Net Debt
$2,488 Net Debt
+ QUIPS
+ QUIPS
+ QUIPS (includes Net Debt
$1,823 Net Debt
$1,949
$1,994
$2,075 QUIPS) $1,779
$1,000 $1,688
$1,837
$500
$0
10/1/02 12/31/02 03/31/03 06/30/03 09/30/03 12/31/03 03/31/04 06/30/04 09/30/04
Proforma
Total debt + QUIPS reduced $1,005M or 33%; Net debt + QUIPS reduced $1,205M or 42%
Note: See page 22 for definitions of Total Debt and Net Debt and a detailed calculation of these measures as of the dates indicated.
13
15. 1st Nine Months 2004 Sales by Market Channel
Total Sales $3,463M
Total Military and Space Total Commercial OE
Other
6%
30% 29%
Boeing
Commercial OE
8%
Airbus
Commercial OE
15%
OE
Military &
Space, OE &
Aftermarket
30%
Regional,
Business & Gen.
AM Av. OE
6%
Large Commercial Aircraft
Aftermarket
Heavy A/C
Maint. 25%
3%
Regional, Business &
Total Commercial Aftermarket
General Aviation
Aftermarket
35%
7%
Balanced business mix – three major market areas each
15
represent approximately one-third of sales
16. Sales by Market Channel
2004 Change Analysis
Actual GR Change Comparisons
Primary Market First 9 Months
Market Channel 3rd Qtr 2004 vs.
Drivers 2004 vs. First 9
3rd Qtr 2003
months 2003
Military and Space – US, UK Defense
6% 5%
OE and Aftermarket Budgets
Boeing and Airbus – Aircraft
1% 5%
OE Production Deliveries
Regional, Business & General Aircraft
>10% >10%
Aviation - OE Deliveries
Aftermarket – Large ASMs, Age,
9% 14%
Commercial and Regional, Cycles, Fleet
Business and GA size
Heavy Airframe Maintenance Aircraft aging,
1% 10%
Parked Fleet
Other Various 5% >10%
Goodrich Total Sales 6% 10%
16
18. Expectations for Goodrich 2004 Sales
Average Expected Growth
2003 Sales
Sales by Market Channel Mix 2003 Actual 2004 Expected
Change* Change
Military and Space –
30% 10% 10%
OE and Aftermarket
Boeing and Airbus –
24% (10%) 5%
OE Production
Regional, Business & General
5% (18%) >10%
Aviation - OE
Aftermarket – Large Commercial
32% (3%) Around 6%
and Regional, Business and GA
Heavy Airframe Maintenance 3% (27%) 10%
Other 6% (13%) 5%
Goodrich Total Sales $4.4B (4%) $4.70 - $4.75B
* Compared to 2002 pro-forma sales, including full year contribution of Aeronautical Systems,
excluding discontinued operations. $3,809M as reported, plus $756M for Aeronautical Systems during
first 9 months of 2002.
18
19. Goodrich Strategic Imperatives
Balanced Growth
• Faster than the overall market
• Win key positions on new aircraft (e.g. 7E7)
• Migrate commercial products/technologies to military
applications
Leverage the Enterprise
• Resource allocation
• Technology/Innovation
• Enterprise-wide initiatives
• Customer alignment/focus
Operational Excellence
• Lean manufacturing/Six Sigma
• Make/Buy analysis
• Cost reduction
Successful implementation will enable Goodrich to
compete/win in all business environments
19
20. Summary - Goodrich Attributes and Actions
Top tier aerospace supplier
Diversified, balanced business mix
Proprietary, flight critical products
Strong cash flow
Enterprise-wide initiatives
Experience managing operations in challenging
markets
Committed to maintaining a conservative
financial profile and investment grade ratings
Focused on what we can control
20
21. What Investors Should Expect from Goodrich
Continued commitment to integrity and safety
No significant acquisitions
Focused on the business
• “Blocking and Tackling”
- Cash flow
- Margin improvement
- Actuation business operational improvement
- Working capital management
- Cost reduction
• New product development
- Continue investing in new products and systems
Reduce leverage to target levels
Transparency of financial results and disclosure
Accountable to all stakeholders
21
22. Supplemental Information
Goodrich Corporation
Reconcilliation of Debt Retirement to GAAP Financial Measures
Adjustments Pro-forma
9/30/2002 to get to Pro-forma* 10/1/2002 12/31/2002 3/31/2003 6/30/2003 9/30/2003 12/31/2003 3/31/2004 06/30/04 09/30/04
Pre-positioned
Elements of Total Debt Cash Bridge Loan
Short-term bank debt $ 284.0 $ (200.0) $ 1,500.0 $ 1,584.0 $ 379.2 $ - $ - $ - $ 2.7 $ 2.7 $ 2.0 $ 1.0
Current maturities of long-term
debt and capital lease
obligations $ 3.5 $ - $ - $ 3.5 $ 3.9 $ 3.6 $ 3.5 $ 4.3 $ 75.6 $ 9.6 $ 63.4 $ 2.3
Long-term debt and capital
lease obligations $ 1,326.5 $ - $ - $ 1,326.5 $ 2,129.0 $ 2,132.1 $ 2,133.2 $ 2,144.1 $ 2,136.6 $ 2,140.7 $ 2,069.9 $ 2,030.6
Total Debt $ 1,614.0 $ (200.0) $ 1,500.0 $ 2,914.0 $ 2,512.1 $ 2,135.7 $ 2,136.7 $ 2,148.4 $ 2,214.9 $ 2,153.0 $ 2,135.3 $ 2,033.9
Adjustments:
Manditory redeemable preferred
securities of trust (QUIPS) -
current $ - $ - $ - $ - $ - $ - $ - $ 63.0 $ - $ - $ - $ -
Manditory redeemable preferred
securities of trust (QUIPS) $ 125.3 $ - $ - $ 125.3 $ 125.4 $ 125.5 $ 125.6 $ 63.5 $ - $ - $ - $ -
Total debt + QUIPS $ 1,739.3 $ (200.0) $ 1,500.0 $ 3,039.3 $ 2,637.5 $ 2,261.2 $ 2,262.3 $ 2,274.9 $ 2,214.9 $ 2,153.0 $ 2,135.3 $ 2,033.9
Cash and cash equivalents $ 346.3 $ (200.0) $ - $ 146.3 $ 149.9 $ 185.8 $ 267.8 $ 325.9 $ 378.4 $ 329.5 $ 356.4 $ 345.5
Net Debt + QUIPS** $ 1,393.0 $ - $ 1,500.0 $ 2,893.0 $ 2,487.6 $ 2,075.4 $ 1,994.5 $ 1,949.0 $ 1,836.5 $ 1,823.5 $ 1,778.9 $ 1,688.4
* In late September 2002, the company utilized short-term debt of $200 million to preposition certain funds necessary for the acquisition of TRW
Aeronautical Systems. This short-term debt was repaid on October 1, 2002 with a portion of the proceeds from the $1.5 billion bridge loan secured to
finance the entire purchase. Accordingly, on October 1, 2002, cash was reduced by $200 million.
**Total Debt (defined as short-term debt plus current maturities of long-term debt and capital lease obligations plus long-term debt and capital lease
obligations) and Net Debt (defined as Total Debt minus cash and cash equivalents) are non-GAAP financial measures that the Company believes
are useful to rating agencies and investors in understanding the Company’s capital structure and leverage. Because all companies do not calculate
these measures in the same manner, the Company's presentation may not be comparable to other similarly titled measures reported by other
companies.
*** QUIPS included in Current maturities of long-term debt and capital lease obligations as of December 31, 2003.
22