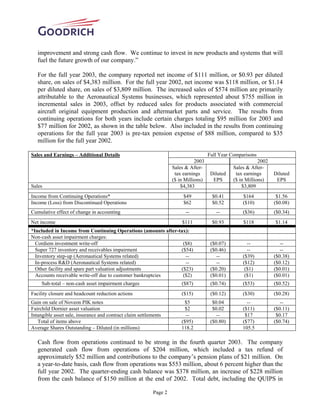
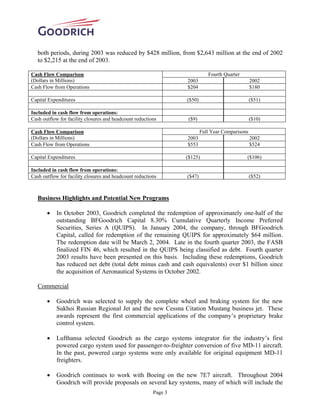
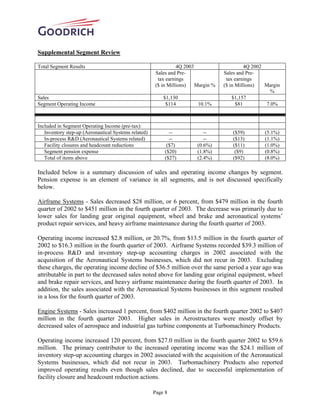
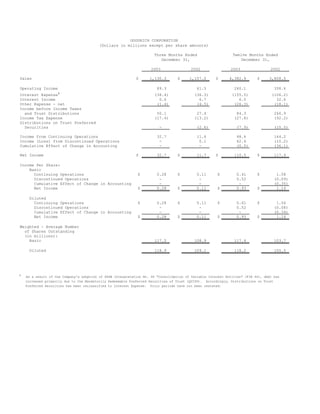
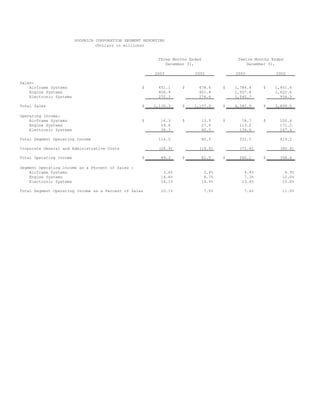
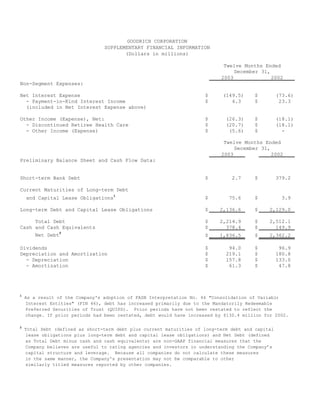
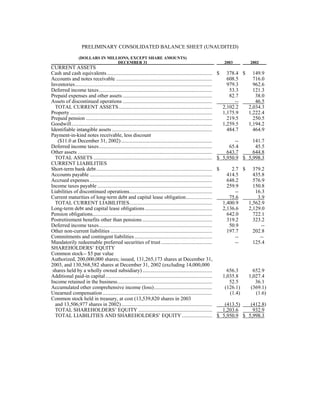
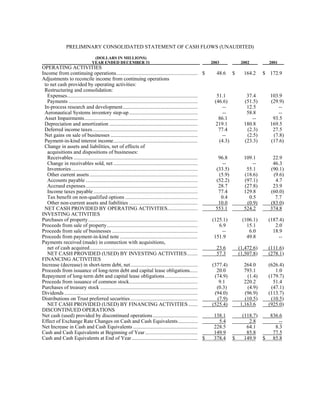
Goodrich Corporation reported financial results for the 4th quarter and full year of 2003. Net income for the 4th quarter was $33 million, up from $12 million the previous year. Sales were $1.13 billion, down 2% from the prior year. For the full year, net income was $111 million on sales of $4.38 billion, up from $118 million on $3.81 billion in sales the previous year. Cash flow from operations for the 4th quarter was $204 million and $553 million for the full year. Goodrich also redeemed some QUIPS and reduced its total debt by $428 million for the year.
Goodrich Corporation announced its second quarter 2004 results, reporting a net income of $39 million compared to $14 million in the second quarter of 2003. Sales increased to $1,134 million from $1,095 million. Goodrich also increased its full year 2004 outlook, expecting sales between $4.7-4.75 billion and fully diluted earnings per share between $1.30-1.40. The increased outlook was due to improving conditions in commercial aerospace aftermarket and military and space markets.
Goodrich reported solid first quarter 2004 results with sales of $1.162 billion and net income of $46 million. The company saw growth in its military, space, and commercial aftermarket businesses. Goodrich updated its full year 2004 outlook with sales expected to be between $4.65-4.70 billion and diluted EPS at the upper end of $1.20-1.35, driven by new program wins on aircraft like the Boeing 7E7 and Airbus A380. Significant factors impacting results include foreign exchange rates, stock compensation expensing, and contract accounting changes.
Goodrich Corporation announced its financial results for the fourth quarter and full year 2004. Net income for 2004 was $172 million, a 68% increase over 2003. Sales in 2004 increased 8% to $4.725 billion. For the fourth quarter, net income was $37 million on sales of $1.262 billion. The company reiterated its outlook for 2005, expecting sales growth of 6-8% and earnings per share growth of 23-38% over 2004. Key business highlights included new contracts for the Boeing 787 Dreamliner worth over $7 billion through 2028.
Goodrich Corporation announced third quarter 2004 results with net income of $50 million, up from $34 million in third quarter 2003. Sales increased to $1.167 billion from $1.064 billion. Goodrich increased its full year 2004 outlook with sales expected to be at the high end of $4.7-4.75 billion range and earnings per share expected to be $1.45-1.50, up from previous estimates. Goodrich saw increased sales across all market channels and gained new contracts for the Boeing 7E7 and Sikorsky UH-60M helicopter.
Danaher Corporation announced record third quarter results for 2008. Net earnings from continuing operations increased 11% to $372 million compared to $335 million in the third quarter of 2007. Sales increased 17.5% to $3.21 billion. For the first nine months of 2008, net earnings from continuing operations increased 13.2% to $1.01 billion compared to $894 million for the same period in 2007. Sales for the first nine months increased 20.5% to $9.51 billion. The company's president stated they delivered strong performance in the quarter and expect to continue outperforming during challenging economic times due to their portfolio of businesses and operational excellence initiatives.
The document provides an earnings review for 2004 and outlook for 2005 from Duke Energy Corporation. Some key points:
- 2004 ongoing earnings per share were $1.38, exceeding the target of $1.20. Several business units performed well while DENA losses were lower than expected.
- Goals for 2005 include ongoing earnings per share of $1.60, ongoing segment EBIT growth across most business units, and further reducing debt and risks.
- DENA is expected to post a $150 million ongoing segment EBIT loss for 2005 as it focuses on defining a sustainable long-term business model.
Raytheon reported strong financial results for the fourth quarter and full year 2006. Quarterly sales increased 12% to $5.7 billion due to growth at Integrated Defense Systems, Missile Systems, and Network Centric Systems. Earnings per share from continuing operations increased 27% to $0.65 for the quarter. For the full year, sales increased 7% to $20.3 billion and earnings per share from continuing operations increased 37% to $2.46. Raytheon also provided guidance for 2007, forecasting earnings per share from continuing operations between $2.85 to $3.00 on sales between $21.4 to $21.9 billion.
The document provides the quarterly and annual financial results for a company. Some key highlights include:
- Several consumer brands posted sales growth for the quarter including Banquet, Blue Bonnet, and Chef Boyardee, while others like ACT II and Eckrich saw declines.
- Total depreciation and amortization was around $93 million for the quarter and $352 million for the fiscal year.
- Capital expenditures were around $106 million for the quarter and $352 million for the fiscal year.
- Net interest expense was $80 million for the quarter and $275 million for the fiscal year.
- Corporate expenses were around $95 million for the quarter and $342 million
Raytheon Reports 2004 First Quarter Resultsfinance12
Raytheon reported first quarter earnings for 2004. Revenue increased 11% year-over-year to $4.676 billion, driven by double-digit growth at IDS, IIS, and SAS. Operating income increased 9% to $372 million excluding pension adjustments. Strong bookings resulted in a record backlog of $31.2 billion. The company reiterated its full-year guidance for revenue over $20 billion, GAAP EPS from continuing operations of $1.30-1.40, and free cash flow over $1 billion.
Digital realty 3 q17 earnings presentation finalir_digitalrealty
This document contains a summary of financial forecasts and metrics for Q3 2017 including:
- Global GDP growth is forecasted to be 3.5% in 2017 and 3.7% in 2018.
- US GDP growth is forecasted to be 2.2% in 2017 and 2.3% in 2018.
- Net income available to common stockholders was $119.8 million for Q3 2017.
- Funds from operations (FFO) per share was $4.16 for Q3 2017.
The document provides a financial and operational performance review for the 4th quarter and full year of 2003. Some key points:
- Full year 2003 cash flow from operations was $553 million, up 6% from 2002, with sales of $4.4 billion and EPS of $0.93.
- EPS for 2004 is expected to be between $1.20-$1.35, including the impact of a contract accounting change and stock option expensing.
- The 4th quarter saw income from continuing operations of $33 million and net income of $33 million.
- Total debt has been reduced through debt retirement and increased cash holdings since acquiring Aeronautical Systems.
The document provides supplemental financial schedules for Occidental Petroleum for 4Q 2008, 4Q 2007, and full year 2008 and 2007. It shows reported net income and core results, with reconciling items between the two. Some key figures:
- 4Q 2008 reported net income was $443 million, core results were $957 million
- 4Q 2007 reported net income was $1,452 million, core results were $1,464 million
- Full year 2008 reported net income was $6,857 million, core results were $7,348 million
- Full year 2007 reported net income was $5,400 million, core results were $4,405 million
Citigroup reported record net income of $15.28 billion for 2002, an 8% increase over 2001. Net income per share also rose 8% to $2.94. Core income for the year was a record $13.65 billion, or $2.63 per share. However, fourth quarter net income declined 37% to $2.43 billion due to a $1.55 billion legal settlement charge. Core income fell 32% to $2.44 billion. Revenue grew 7% for the full year to $75.76 billion but was flat in the fourth quarter at $18.93 billion.
hess 1/28/2009 Estimated Results for the Fourth Quarter of 2008finance8
Hess Corporation reported a net loss of $74 million for Q4 2008 compared to net income of $510 million for Q4 2007. Key factors included after-tax dry hole costs of $86 million and foreign exchange losses of $84 million. Oil and gas production was 379,000 barrels per day, down 11,000 barrels from Q4 2007 due to hurricanes. Proved reserves increased to 1.432 billion barrels at the end of 2008, replacing 171% of 2008 production. Marketing and Refining earnings were $152 million, up from $31 million in Q4 2007.
Citigroup reported quarterly financial results, with net income of $3.92 billion for 3Q 2002, a 23% increase over 3Q 2001. Core income, which excludes certain items, was $3.79 billion for 3Q 2002, up 17% from the prior year. Diluted earnings per share on net income were $0.76 for the quarter, rising 25% year-over-year, while diluted EPS on core income increased 19% to $0.74. Citigroup operates as a global financial services company with over 200 million customer accounts in more than 100 countries.
Danaher Corporation announced record results for the second quarter and first half of 2005. Net earnings for the second quarter increased 25.5% compared to 2004, and sales increased 19%. For the first six months, net earnings increased 27.5% and sales increased 19%. The company's president stated that growth from existing businesses accounted for 5.5% sales growth in the quarter and that the company saw broad-based strength across its businesses.
This document provides quarterly financial data for Citigroup, including:
1) Income statements for Citigroup's major business segments broken down by product and region, showing revenues, expenses, profits.
2) Key metrics for Citigroup as a whole, including revenues, income, earnings per share, assets, equity.
3) Specific data on performance of Citigroup's Global Consumer credit card business, including revenues, expenses, profits, and effects of securitization activities.
This document provides an overview and analysis of Illinois Tool Works Inc.'s financial results for 2003, 2002 and 2001. It discusses revenues, operating income, margins and factors affecting performance for the company overall and within its five business segments. The key points are:
- Consolidated revenues increased 6% in 2003 due to currency effects and acquisitions, while base business revenues declined slightly.
- Operating income increased 8% in 2003 due to cost savings, currency effects and acquisitions, despite declines in base business.
- Engineered Products-North America saw a 1% revenue increase in 2003 but an 8% drop in operating income due to base business declines.
- Engineered Products-International saw a 20
This document provides quarterly financial highlights for Nationwide Financial Services for Q1 2008. Key points include:
- Total revenues for Q1 2008 were $916.3 million, down from $1,068.7 million in Q4 2007.
- Net operating earnings for Q1 2008 were $131.5 million, down from $161.7 million in Q4 2007.
- Total customer funds managed and administered as of Q1 2008 were $153.3 billion, down from $162.4 billion as of Q4 2007.
The document provides reconciliations for several non-GAAP financial measures referenced by Kodak's CEO and CFO during an earnings call to the most directly comparable GAAP measures. These include reconciliations of projected digital EFO, digital revenue growth, investable cash flow, EBITDA, interest expense, and traditional earnings/digital losses to their related GAAP measures. The reconciliations are provided to give investors the same financial data used internally by management to properly assess the company's underlying performance.
dominion resources GAAP Reconciliations and Footnotesfinance17
This document reconciles operating earnings, return on equity, and return on invested capital to reported earnings, return on equity, and return on invested capital for the years 2003-2007 for a company. It shows adjustments made to operating earnings such as gains or losses from sales of business units, impairment charges, discontinued operations, and other one-time items to derive reported earnings according to GAAP. The reconciliation also calculates the impact of these adjustments on the company's return on equity and return on invested capital.
This document provides a summary of Fannie Mae's 2005 10-K investor report. It highlights that Fannie Mae saw increased net income of $6.3 billion in 2005, up 28% from 2004. Their single-family business saw revenue growth of 13% and net income growth of 15%. Their capital markets business generated $3 billion in net income, up 42% from 2004 levels. The summary also provides financial results and income statements for each of Fannie Mae's business segments for 2005 compared to 2004 and 2003.
Goodrich Corporation announced its second quarter 2004 results, reporting a net income of $39 million compared to $14 million in the second quarter of 2003. Sales increased to $1,134 million from $1,095 million. Goodrich also increased its full year 2004 outlook, expecting sales between $4.7-4.75 billion and fully diluted earnings per share between $1.30-1.40, up from its previous outlook. The increased outlook was due to better than expected commercial aerospace aftermarket and military and space sales.
Goodrich Corporation announced third quarter 2004 results with net income of $50 million, up from $34 million in third quarter 2003. Sales increased to $1.167 billion from $1.064 billion. Goodrich increased its full year 2004 outlook with sales expected to be at the high end of $4.7-4.75 billion range and earnings per share expected to be $1.45-1.50, up from previous estimates. Goodrich saw increased sales across all market channels and gained new contracts for the Boeing 7E7 and Sikorsky UH-60M helicopter.
Goodrich Corporation announced its financial results for the fourth quarter and full year of 2004. Key points:
- Full year 2004 net income was $172 million, up from $100 million in 2003, with sales increasing 8% to $4.725 billion.
- Fourth quarter net income was $37 million, compared to $23 million in the prior year, with sales up 12% to $1.262 billion.
- Results for both periods included various one-time charges such as those related to a settlement with Northrop Grumman.
- The company reiterated its outlook for 2005, expecting 6-8% sales growth and earnings per share increasing 23-38%.
Goodrich reported solid first quarter 2004 results with sales of $1.162 billion and net income of $46 million. The company saw growth in its military, space, and commercial aftermarket businesses. Goodrich updated its full-year 2004 outlook with sales expected between $4.65-4.7 billion and diluted EPS at the upper end of $1.20-1.35, driven by new program wins on aircraft like the Boeing 7E7 and Airbus A380. Significant factors impacting earnings include stock compensation expensing, foreign exchange rates, and accounting changes to contracts.
The document provides an overview and analysis of Goodrich Corporation's fourth quarter and full year 2003 financial performance and outlook for 2004. Some key points:
- 2003 cash flow from operations was $553 million, up 6% from 2002. Sales were $4.383 billion and EPS was $0.93.
- Fourth quarter 2003 sales were $1.13 billion and EPS from continuing operations was $0.28.
- Full year sales growth is expected to be low single digits in 2004, and EPS is forecasted to be between $1.20-$1.35.
- Several factors are expected to create headwinds in 2004, including higher pension and healthcare costs, foreign exchange impacts
Paul Gifford, Vice President of Investor Relations at Goodrich, presented at the Gabelli 10th Annual Aircraft Supplier Conference in New York on September 9, 2004. Goodrich reported improved financial results in the first half of 2004, with sales up 5% and segment operating income up 146% compared to the first half of 2003. Goodrich also continues to pay down debt and has a balanced mix of sales across commercial, military, and aftermarket channels. New program wins such as the 7E7 Dreamliner and Joint Strike Fighter are expected to add balanced future growth.
Vice President Paul Gifford presented at the Gabelli 10th Annual Aircraft Supplier Conference in New York on September 9, 2004. He discussed Goodrich's company overview and financial results for the first half of 2004, noting sales increased 5% to $2.296 billion compared to the first half of 2003. Segment operating income increased 146% to $245 million or 10.7% of sales, up from 4.5% in the prior year. Goodrich continues to pay down debt from its acquisition of Aeronautical Systems in 2003, having redeemed $60 million in bonds in August 2004.
- Goodrich Corporation reported strong financial results for the fourth quarter and full year 2004, with sales and earnings growth.
- Segment operating income increased 17% in the fourth quarter compared to 2003, driven by sales increases in all reportable segments.
- Full year 2004 sales grew 8% over 2003 and segment operating income increased 56%.
- The company reduced long-term debt by $131 million in the fourth quarter and made an additional $78 million in pension contributions, maintaining a strong cash balance of $298 million at year-end.
- Goodrich Corporation reported strong financial results for the fourth quarter and full year 2004, with sales and earnings growth.
- Segment operating income increased 17% in the fourth quarter compared to 2003, driven by sales increases in all reportable segments.
- Full year 2004 sales grew 8% over 2003, with segment operating income increasing 56% due to higher volumes and efficiencies.
- The company reduced long-term debt by $131 million in the fourth quarter and continued strong cash generation with $298 million of cash on hand at year-end.
allstate Quarterly Investor Information 2002 1stfinance7
The Allstate Corporation reported financial results for the first quarter of 2002, with net income of $426 million, down from $500 million in the same period the previous year. Operating income was $488 million compared to $552 million in 2001. While revenues grew slightly by 2.3%, increased loss costs and decreased investment income contributed to the decline in profits. The company remains on track to meet its full-year earnings guidance despite challenges from higher claims in areas like Texas and ongoing cost pressures.
Danaher Corporation reported financial results for Q4 and full year 2008. Q4 net earnings were $305.7 million compared to $320.2 million in Q4 2007. For the full year, net earnings were $1.3 billion compared to $1.37 billion in 2007. Sales increased 1% in Q4 to $3.18 billion and increased 15% for the full year to $12.7 billion. The CEO stated that while 2009 will be difficult, Danaher's portfolio of businesses and strong balance sheet will allow it to outperform in a challenging market.
The document is the 2002 annual report for The Timken Company. It discusses how the company's ongoing transformation has positioned it for strong future growth and profitability. In 2002, the company delivered improved financial results including net income of $53.3 million, excluding restructuring charges. It also completed a major acquisition of The Torrington Company in early 2003, significantly increasing the company's size and expected to boost earnings per share by at least 10%. The acquisition supports the company's transformation into a global leader in tapered roller bearings, needle roller bearings, and alloy steels.
This document summarizes Goodrich's second quarter 2004 performance and provides an outlook for 2004. Key points include:
- Sales were up 4% in Q2 2004 versus Q3 2003 while net income increased 169% due to improved operational performance.
- For the first half of 2004, sales were up 5% and net income increased 95% year-over-year.
- Goodrich has paid down $904 million in debt since acquiring Aeronautical Systems in 2002 through strong cash flow.
- The outlook for 2004 anticipates sales of $4.70-4.75 billion and EPS of $1.30-1.40, representing growth over 2003.
- Goodrich has a balanced business mix across
This document summarizes Goodrich's second quarter 2004 performance and provides an outlook for 2004. Key points include:
- Sales were up 4% in Q2 2004 versus Q3 2003 driven by higher volume, though partially offset by foreign exchange impacts.
- Net income increased substantially due to improved operational performance and lower restructuring charges.
- Goodrich has paid down $904 million in debt since acquiring Aeronautical Systems and reduced net debt by $1.1 billion.
- Sales are expected to grow to $4.7-4.75 billion in 2004 with gains across various market channels.
This document provides forward-looking statements and non-GAAP financial information for Monsanto's investor day on November 10, 2005. It includes reconciliations of free cash flow, non-GAAP EPS, and return on capital for fiscal years 2004-2007. The document also notes that references to fiscal years refer to Monsanto's year ending August 31 and lists several of Monsanto's trademarks.
The Timken Company had a strong year in 2002, delivering improved financial results and positioning itself for future growth through a transformation strategy. A key part of the transformation was the acquisition of The Torrington Company, which closed in early 2003, increasing Timken's sales by 50% and expected to increase earnings per share by at least 10%. In 2002, Timken achieved earnings of $53 million excluding restructuring charges, up from $0.01 in 2001, and its share price increased over 20%. Timken continued to invest in innovation, expanding its product lines and technology centers around the world to better serve customers. The acquisition of Torrington and continued focus on innovation, cost reductions and customer service have established a solid foundation
Danaher Corporation announced record results for the second quarter of 2008, with net earnings from continuing operations of $363 million, an 18% increase over the second quarter of 2007. Sales increased 25% to $3.28 billion. The company also saw a 22% increase in adjusted net earnings from continuing operations, which excludes certain charges related to an acquisition. For the first six months of 2008, net earnings from continuing operations were $640 million, up 14.5% compared to the same period in 2007. The company's CEO stated that despite economic conditions, the company's businesses are well positioned for the rest of 2008.
The document provides financial information on special items that impacted earnings per share (EPS) for Duke Energy in the second quarter of 2004 and 2003, as well as the first quarter of 2004 and 2003. Some of the notable special items include an $130 million pre-tax Enron settlement that increased EPS by $0.09 in Q2 2004, and $229 million pre-tax gains on asset sales that increased EPS by $0.16 in Q2 2003. For the first half of 2004, special items have resulted in a $0.04 increase in EPS compared to a $0.01 decrease for the first half of 2003.
This document provides a summary of Goodrich Corporation's third quarter 2004 performance and financial results. Key points include:
- Sales increased 10% from Q3 2003 to $1.167 billion, with segment operating income up 12% to $132 million.
- New program wins included the Boeing 7E7 and U.S. Army Black Hawk helicopter programs.
- Total debt was reduced by $101 million in the quarter through various actions.
- EPS from continuing operations increased 41% to $0.41 compared to $0.29 in Q3 2003.
- Sales and profits increased across all market channels and segments compared to the prior year.
This document provides a summary of Goodrich Corporation's third quarter 2004 performance and financial results. Key points include:
- Sales increased 10% from Q3 2003 to $1.167 billion, with segment operating income up 12% to $132 million.
- New program wins included the Boeing 7E7 and U.S. Army Black Hawk helicopter.
- Total debt declined by $101 million through debt repayments and accounting adjustments.
- 2004 outlook for sales and EPS were increased based on improved performance.
- All market channels saw year-over-year sales growth in the first nine months of 2004.
Robert G. Bohn, Chairman, President and CEO of Oshkosh Truck Corporation, and Charles L. Szews, Executive VP and CFO, reported record financial results for the first quarter of fiscal year 2006. Sales increased 22.5% to $790.3 million and operating income grew 28.6% to $87 million. EPS increased 28.6% to $0.72. For fiscal year 2006, the company estimates sales between $3.3-3.4 billion, operating income between $316.5-329 million, and EPS between $2.55-2.65, representing growth of 17-21.6%.
1) Oshkosh reported record second quarter fiscal year 2006 results with sales up 25.6% and operating income up 27.3% driven by strong performance in the defense segment.
2) The defense segment results nearly doubled compared to the previous year due to growth in remanufactured and new truck sales, however challenges remain in locating used vehicle carcasses for remanufacturing.
3) The fire and emergency segment saw a temporary dip in earnings as anticipated due to heavily weighted airport product sales in the second half of the year and two component issues that delayed revenue recognition.
Robert G. Bohn, Chairman, President and CEO of Oshkosh Truck Corporation, discussed the company's strong third quarter fiscal year 2006 results and provided an outlook for fiscal years 2006 and 2007. Some highlights included record sales and operating income for Q3 2006. The company also announced two acquisitions, AK Specialty Vehicles and Iowa Mold Tooling, expected to be accretive to earnings in fiscal 2007. For fiscal 2006, Oshkosh estimates sales growth of 14.9-16.6% and EPS growth of 24-26%. Fiscal 2007 estimates include sales of $3.65-$3.75 billion and EPS of $3.05-$3.15.
Oshkosh Truck Corporation presented an investor presentation on its proposed acquisition of JLG Industries, Inc. The presentation discussed Oshkosh's track record of successful acquisitions and shareholder value creation. It also outlined the objectives of acquiring JLG to support growth above 15%, diversify into the fast-growing aerial work platform market, and execute its long-term acquisition strategy. Finally, the presentation provided an overview of Oshkosh Truck Corporation and its proven strategy of new product leadership, operational excellence, and strategic acquisitions that have fueled strong sales and earnings growth.
Robert Bohn, Chairman of Oshkosh Truck Corporation, discussed the company's strong fiscal 2006 financial results and outlook for fiscal 2007. Key points include:
1) Fiscal 2006 sales increased 15.8% and operating income grew 22%, with EPS up 26.6%.
2) The acquisition of JLG Industries was announced, which will diversify the company and support growth of over 15%.
3) Fiscal 2007 stand-alone estimates include sales of $3.65-$3.75 billion and EPS of $3.05-$3.15, with the JLG acquisition expected to be modestly accretive.
In this earnings call, Oshkosh Truck Corporation discusses its first quarter 2007 results. Sales increased 27.4% to $1.01 billion due to the acquisition of JLG Industries. Operating income decreased 3.9% to $83.6 million and EPS decreased 23.6% to $0.55. The company increased its full-year 2007 EPS estimate range to $3.15 to $3.25 per share. JLG is meeting expectations and integration is progressing well. Defense sales were lower compared to strong prior year results while fire and emergency and commercial saw strong performance.
This document summarizes an earnings conference call for Oshkosh Truck Corporation for the second quarter of fiscal year 2007. Sales increased 96.6% to $1.66 billion and operating income grew 69.1% to $134.8 million. For fiscal year 2007, the company estimates sales of $6.1-6.2 billion and operating income of $568-580 million. It also provides segment-level results and highlights for access equipment, defense, fire & emergency, and commercial.
1) Oshkosh reported strong third quarter 2007 results with sales increasing 108% to $1.85 billion and operating income up 133% to $192.7 million.
2) Access equipment and defense led the growth in sales and operating income. The acquisition of JLG was accretive to EPS by $0.35 per share.
3) For fiscal year 2007, Oshkosh estimates sales between $6.3-6.35 billion and EPS between $3.35-3.40, and for fiscal year 2008 estimates sales between $7-7.2 billion and EPS between $4.15-4.35.
The document summarizes Oshkosh Truck Corporation's fourth quarter fiscal 2007 earnings conference call. It discusses record sales and operating income for fiscal 2007. Projections are provided for fiscal 2008, estimating sales between $7.1-7.3 billion and operating income between $690-715 million. Segment performances are reviewed, with access equipment and defense highlighted as key growth drivers. Estimates are also given for interest expense, tax rates, capital expenditures and debt levels for fiscal 2008.
Oshkosh Corporation held an earnings conference call to discuss its first quarter fiscal year 2008 results. Sales increased 49% to $1.5 billion due to strong growth in access equipment and defense, while earnings per share declined 9.1% to $0.50. For fiscal year 2008, the company estimates revenue of $7.1-7.3 billion, operating income of $675-700 million, and earnings per share of $4.15-4.35. Challenging economic conditions are impacting commercial and fire & emergency segments, but global initiatives and cost reductions will support the full-year outlook.
The document summarizes Oshkosh Corporation's earnings conference call for the second quarter of fiscal year 2008. Key highlights include sales increasing 6.7% to $1.8 billion and operating income rising 24.8% to $168.2 million. EPS grew 42.6% to $0.97. While access equipment and defense saw strong demand, commercial and fire & emergency faced challenging market conditions. The company maintained its fiscal year 2008 EPS estimate range of $4.15 to $4.35.
The document summarizes Oshkosh Corporation's earnings conference call for the third quarter of fiscal year 2008. It discusses increases in sales revenue but decreases in operating income and earnings per share compared to the previous year. Several initiatives are mentioned to manage costs and cash flow in changing market conditions. Business segment results are provided, with strength in access equipment and defense but challenges in commercial and fire & emergency sectors.
This document is the transcript from Oshkosh Corporation's earnings conference call for the fourth quarter of fiscal year 2008. It discusses Oshkosh's financial results for Q4 and fiscal year 2008, including sales, operating income, earnings per share, and debt reduction. It also provides an outlook for fiscal year 2009, estimating revenues of $6.3-6.7 billion, operating income of $350-400 million, and EPS of $1.65-2.05. The transcript reviews performance and outlook for each of Oshkosh's business segments and discusses its financing plans.
Robert Bohn and David Sagehorn of Oshkosh Corporation gave a presentation at the Goldman Sachs Conference in November 2008. They discussed Oshkosh's strong financial position and actions taken to reduce costs and debt. While market conditions were volatile due to the economic downturn, Oshkosh was well positioned with backlogs in defense, fire, and refuse collection vehicles. The presentation outlined Oshkosh's segments and strategies to manage through the difficult economy.
1) The document is from a presentation given by Oshkosh executives Charles Szews and David Sagehorn at the R.W. Baird Industrial Conference on November 12, 2008.
2) Oshkosh reported sales increased 13.2% to $7.1 billion in fiscal 2008, with international sales reaching $2.1 billion. However, operating income decreased 1.5% and EPS decreased 5.9% due to non-cash impairment charges.
3) Oshkosh recently secured multiple defense contracts and sees opportunities in the domestic refuse collection vehicle market, but the current market volatility and credit crisis make fiscal 2009 projections difficult given exposure to construction and municipal spending.
Charles Szews, President and COO of Oshkosh Corporation, presented at the Cowen and Company Aerospace & Defense Conference on February 5, 2009. He discussed Oshkosh's business segments, products, competitive advantages, challenges, and actions taken in response to the economic downturn. Key points included reduced revenues and earnings in Q1 2009, cost reduction efforts, and focus on core businesses with strong backlogs like defense and fire apparatus that have gained market share.
Oshkosh Corporation held an earnings conference call to discuss its first quarter fiscal year 2008 results. Sales increased 49% to $1.5 billion due to strong growth in access equipment and defense, while earnings per share declined 9.1% to $0.50. For fiscal year 2008, the company estimates revenue of $7.1-7.3 billion, operating income of $675-700 million, and earnings per share of $4.15-4.35. Challenging economic conditions are impacting commercial and fire & emergency segments, but global initiatives and cost reductions will support the full-year outlook.
The document summarizes Oshkosh Corporation's earnings conference call for the second quarter of fiscal year 2008. Key highlights include sales increasing 6.7% to $1.8 billion and operating income rising 24.8% to $168.2 million. EPS grew 42.6% to $0.97. While access equipment and defense saw strong demand, commercial and fire & emergency faced challenging market conditions. The company maintained its fiscal year 2008 EPS estimate range of $4.15 to $4.35.
This document contains the transcript from Oshkosh Corporation's earnings conference call for the third quarter of fiscal year 2008. Key highlights include a 6.6% increase in quarterly sales to $1.97 billion but a 5.9% decrease in operating income to $181.2 million. EPS for the quarter decreased 1.7% to $1.19. Oshkosh revised its estimate for full year 2008 EPS to a range of $3.15 to $3.30.
This document summarizes an earnings conference call for Oshkosh Corporation for the fourth quarter of fiscal year 2008. It discusses the company's financial results including a 5.8% increase in sales to $1.9 billion but a 32% decrease in operating income to $122 million. The document also provides an overview of Oshkosh's fiscal year 2008 results and discusses challenges faced in various business segments due to economic conditions. It notes actions taken by the company to reduce costs and debt. An outlook is given for fiscal year 2009 noting market volatility and a plan to drive over $500 million in debt reduction. Business segment results and outlooks are also summarized.
2. Elemental Economics - Mineral demand.pdfNeal Brewster
After this second you should be able to: Explain the main determinants of demand for any mineral product, and their relative importance; recognise and explain how demand for any product is likely to change with economic activity; recognise and explain the roles of technology and relative prices in influencing demand; be able to explain the differences between the rates of growth of demand for different products.
Optimizing Net Interest Margin (NIM) in the Financial Sector (With Examples).pdfshruti1menon2
NIM is calculated as the difference between interest income earned and interest expenses paid, divided by interest-earning assets.
Importance: NIM serves as a critical measure of a financial institution's profitability and operational efficiency. It reflects how effectively the institution is utilizing its interest-earning assets to generate income while managing interest costs.
In a tight labour market, job-seekers gain bargaining power and leverage it into greater job quality—at least, that’s the conventional wisdom.
Michael, LMIC Economist, presented findings that reveal a weakened relationship between labour market tightness and job quality indicators following the pandemic. Labour market tightness coincided with growth in real wages for only a portion of workers: those in low-wage jobs requiring little education. Several factors—including labour market composition, worker and employer behaviour, and labour market practices—have contributed to the absence of worker benefits. These will be investigated further in future work.
South Dakota State University degree offer diploma Transcriptynfqplhm
办理美国SDSU毕业证书制作南达科他州立大学假文凭定制Q微168899991做SDSU留信网教留服认证海牙认证改SDSU成绩单GPA做SDSU假学位证假文凭高仿毕业证GRE代考如何申请南达科他州立大学South Dakota State University degree offer diploma Transcript
How Does CRISIL Evaluate Lenders in India for Credit RatingsShaheen Kumar
CRISIL evaluates lenders in India by analyzing financial performance, loan portfolio quality, risk management practices, capital adequacy, market position, and adherence to regulatory requirements. This comprehensive assessment ensures a thorough evaluation of creditworthiness and financial strength. Each criterion is meticulously examined to provide credible and reliable ratings.
STREETONOMICS: Exploring the Uncharted Territories of Informal Markets throug...sameer shah
Delve into the world of STREETONOMICS, where a team of 7 enthusiasts embarks on a journey to understand unorganized markets. By engaging with a coffee street vendor and crafting questionnaires, this project uncovers valuable insights into consumer behavior and market dynamics in informal settings."
Economic Risk Factor Update: June 2024 [SlideShare]Commonwealth
May’s reports showed signs of continued economic growth, said Sam Millette, director, fixed income, in his latest Economic Risk Factor Update.
For more market updates, subscribe to The Independent Market Observer at https://blog.commonwealth.com/independent-market-observer.
5 Tips for Creating Standard Financial ReportsEasyReports
Well-crafted financial reports serve as vital tools for decision-making and transparency within an organization. By following the undermentioned tips, you can create standardized financial reports that effectively communicate your company's financial health and performance to stakeholders.
Discover the Future of Dogecoin with Our Comprehensive Guidance36 Crypto
Learn in-depth about Dogecoin's trajectory and stay informed with 36crypto's essential and up-to-date information about the crypto space.
Our presentation delves into Dogecoin's potential future, exploring whether it's destined to skyrocket to the moon or face a downward spiral. In addition, it highlights invaluable insights. Don't miss out on this opportunity to enhance your crypto understanding!
https://36crypto.com/the-future-of-dogecoin-how-high-can-this-cryptocurrency-reach/
1. News Release
Media Contacts:
Lisa Bottle
Goodrich Corporation
Phone: 704 423 7060 Four Coliseum Centre
2730 West Tyvola Road
Gail Warner Charlotte, NC 28217-4578
Tel: 704 423 7000
Phone: 704 423 7048 Fax: 704 423 7127
www.goodrich.com
Investor Contact: Paul Gifford
Phone: 704 423 5517
Goodrich Announces Fourth Quarter and Full Year 2003 Results,
Updates Outlook for Full Year 2004
• Fourth quarter net income per diluted share of $0.28 on sales of $1,130 million.
• Fourth quarter cash flow from operations of $204 million.
CHARLOTTE, NC, February 5, 2004 – Goodrich Corporation announced today its results for
the fourth quarter and full year 2003, and updated its outlook for sales, earnings and cash flow
from operations for 2004.
The company reported fourth quarter 2003 net income of $33 million, or $0.28 per diluted share,
on sales of $1,130 million. During the fourth quarter 2002, net income was $12 million, or $0.11
per diluted share, on sales of $1,157 million. The $27 million, or 2 percent, sales decrease was
due to reduced demand for commercial aircraft original equipment and aftermarket parts and
service, partially offset by increased demand for military and space products and services.
During the fourth quarter 2003, the company’s reported results included $7 million in pre-tax ($5
million after-tax) charges for facility closure and headcount reduction actions. Similar charges
for the fourth quarter 2002 were $11 million pre-tax ($7 million after-tax). Additionally, in the
fourth quarter 2002, Goodrich incurred $71 million in pre-tax ($51 million after-tax) charges for
inventory step-up and in-process R&D related to the acquisition of the Aeronautical Systems
businesses from TRW. There were no similar charges during the fourth quarter 2003.
Commenting on the company’s performance, Marshall Larsen, Chairman, President and Chief
Executive Officer said, “It appears we may have seen the bottom of the downturn in the
commercial aerospace market during 2003. Our fourth quarter revenue increased 6 percent
compared to third quarter 2003, including a 4 percent improvement in commercial aftermarket
sales. We had a great year for cash flow from operations in 2003, and used a significant portion
of that to pay down debt. Our team performed extremely well under very difficult
circumstances. In 2004, we remain focused on improving our operational and financial
performance and are aligned toward specific enterprise-wide goals, including margin
Page 1
2. improvement and strong cash flow. We continue to invest in new products and systems that will
fuel the future growth of our company.”
For the full year 2003, the company reported net income of $111 million, or $0.93 per diluted
share, on sales of $4,383 million. For the full year 2002, net income was $118 million, or $1.14
per diluted share, on sales of $3,809 million. The increased sales of $574 million are primarily
attributable to the Aeronautical Systems businesses, which represented about $755 million in
incremental sales in 2003, offset by reduced sales for products associated with commercial
aircraft original equipment production and aftermarket parts and service. The results from
continuing operations for both years include certain charges totaling $95 million for 2003 and
$77 million for 2002, as shown in the table below. Also included in the results from continuing
operations for the full year 2003 is pre-tax pension expense of $88 million, compared to $35
million for the full year 2002.
Full Year Comparisons
Sales and Earnings – Additional Details
2003 2002
Sales & After- Sales & After-
tax earnings Diluted tax earnings Diluted
($ in Millions) EPS ($ in Millions) EPS
Sales $4,383 $3,809
Income from Continuing Operations* $49 $0.41 $164 $1.56
Income (Loss) from Discontinued Operations $62 $0.52 ($10) ($0.08)
Cumulative effect of change in accounting -- -- ($36) ($0.34)
Net income $111 $0.93 $118 $1.14
*Included in Income from Continuing Operations (amounts after-tax):
Non-cash asset impairment charges:
Cordiem investment write-off ($8) ($0.07) -- --
Super 727 inventory and receivables impairment ($54) ($0.46) -- --
Inventory step-up (Aeronautical Systems related) -- -- ($39) ($0.38)
In-process R&D (Aeronautical Systems related) -- -- ($12) ($0.12)
Other facility and spare part valuation adjustments ($23) ($0.20) ($1) ($0.01)
Accounts receivable write-off due to customer bankruptcies ($2) ($0.01) ($1) ($0.01)
Sub-total – non-cash asset impairment charges ($87) ($0.74) ($53) ($0.52)
Facility closure and headcount reduction actions ($15) ($0.12) ($30) ($0.28)
Gain on sale of Noveon PIK notes $5 $0.04 -- --
Fairchild Dornier asset valuation $2 $0.02 ($11) ($0.11)
Intangible asset sale, insurance and contract claim settlements -- -- $17 $0.17
Total of items above ($95) ($0.80) ($77) ($0.74)
Average Shares Outstanding – Diluted (in millions) 118.2 105.5
Cash flow from operations continued to be strong in the fourth quarter 2003. The company
generated cash flow from operations of $204 million, which included a tax refund of
approximately $52 million and contributions to the company’s pension plans of $21 million. On
a year-to-date basis, cash flow from operations was $553 million, about 6 percent higher than the
full year 2002. The quarter-ending cash balance was $378 million, an increase of $228 million
from the cash balance of $150 million at the end of 2002. Total debt, including the QUIPS in
Page 2
3. both periods, during 2003 was reduced by $428 million, from $2,643 million at the end of 2002
to $2,215 at the end of 2003.
Fourth Quarter
Cash Flow Comparison
(Dollars in Millions) 2003 2002
Cash Flow from Operations $204 $180
Capital Expenditures ($50) ($51)
Included in cash flow from operations:
Cash outflow for facility closures and headcount reductions ($9) ($10)
Full Year Comparisons
Cash Flow Comparison
(Dollars in Millions) 2003 2002
Cash Flow from Operations $553 $524
Capital Expenditures ($125) ($106)
Included in cash flow from operations:
Cash outflow for facility closures and headcount reductions ($47) ($52)
Business Highlights and Potential New Programs
• In October 2003, Goodrich completed the redemption of approximately one-half of the
outstanding BFGoodrich Capital 8.30% Cumulative Quarterly Income Preferred
Securities, Series A (QUIPS). In January 2004, the company, through BFGoodrich
Capital, called for redemption of the remaining QUIPS for approximately $64 million.
The redemption date will be March 2, 2004. Late in the fourth quarter 2003, the FASB
finalized FIN 46, which resulted in the QUIPS being classified as debt. Fourth quarter
2003 results have been presented on this basis. Including these redemptions, Goodrich
has reduced net debt (total debt minus cash and cash equivalents) over $1 billion since
the acquisition of Aeronautical Systems in October 2002.
Commercial
• Goodrich was selected to supply the complete wheel and braking system for the new
Sukhoi Russian Regional Jet and the new Cessna Citation Mustang business jet. These
awards represent the first commercial applications of the company’s proprietary brake
control system.
• Lufthansa selected Goodrich as the cargo systems integrator for the industry’s first
powered cargo system used for passenger-to-freighter conversion of five MD-11 aircraft.
In the past, powered cargo systems were only available for original equipment MD-11
freighters.
• Goodrich continues to work with Boeing on the new 7E7 aircraft. Throughout 2004
Goodrich will provide proposals on several key systems, many of which will include the
Page 3
4. use of innovative new technologies to increase the reliability and decrease the weight of
components and systems.
Military & Space
• Goodrich and Raytheon finalized a teaming agreement under which Goodrich will be the
lead manufacturer of composite structures and components for the Raytheon-led “Team
LCS”, one of three competing teams awarded a contract for the preliminary design of the
U.S. Navy’s new Littoral Combat Ship.
• In November, Goodrich was selected by Boeing and the U.S. Air Force to provide the
SmartProbe primary air data system for the C-130 Avionics Modernization Program.
The system will provide all primary and secondary air data information required by the
flight control and cockpit display systems.
Outlook
Goodrich’s 2004 outlook is based on the following market assumptions:
• Deliveries of Boeing and Airbus large commercial aircraft are expected to be flat to
slightly declining when compared to the 586 deliveries in 2003.
• Capacity in the global airline system, as measured by available seat miles (ASMs), is
expected to grow for the first time since 2000. Goodrich continues to expect modest
ASM growth in the 3 – 5 percent range. Goodrich sales to airlines for large commercial
and regional aircraft aftermarket parts and service are expected to grow approximately in-
line with increases in capacity.
• Regional and business new aircraft production is expected to increase by about 8 - 10
percent.
• Military sales (OE and aftermarket) should increase roughly in line with global military
budgets, in the 7 - 10 percent range.
Based on current expectations for these key market trends, Goodrich 2004 sales are expected to
grow in the low single-digit percent range, compared to 2003.
The outlook for operating income and earnings per share (EPS) is based on many external and
internal factors that may have a material impact on operating income and EPS. These factors
include, but are not limited to:
• Certain expenses included in Corporate G&A, Other Income (Expense) and segment
operating results are expected to increase by approximately $30 million, in the aggregate,
in 2004. The increase, compared to the prior outlook of a $20 - $25 million increase in
these expenses, is primarily due to an expected change in the company’s incentive
compensation plan, which will replace a portion of the annual stock option grant with
restricted stock.
• Stock option expensing – Goodrich expects to begin expensing stock options during
2004. For the full year 2004, it is expected that stock option expense will be
approximately $16 million pre-tax (about $0.09 per diluted share).
Page 4
5. • Pension expense – the company expects pension costs to be approximately $7 million
(pre-tax) lower than 2003, due to higher than previously anticipated pension plan asset
levels driven by strong equity markets in the fourth quarter 2003.
• Foreign exchange – for 2004, Goodrich is currently hedged on about 75 percent of its
estimated foreign exchange exposure. The recent weakening of the US dollar, especially
against the Canadian dollar, the Euro and the Pound Sterling, is expected to negatively
impact 2004 income by approximately $15 – $20 million pre-tax, compared to 2003,
based on current exchange rates.
• 7E7 and A380 spending – combined spending on these two programs is expected to be
relatively flat in 2004 compared to 2003 as the reductions in spending on the Airbus
A380 program are expected to be largely offset by increased spending on the Boeing 7E7
program.
• Change in contract accounting – the company expects to change certain elements of the
contract accounting methodology utilized at its Aerostructures business, effective January
1, 2004, to better align with industry practices. Goodrich expects a one-time increase to
income, which will be recorded as a cumulative effect of change in accounting, of
approximately $24 million pre-tax (about $0.13 per diluted share). As a result of the
change, a decrease to 2004 operating income of about $8 million pre-tax (about $0.05 per
diluted share) is expected. This change has no impact on cash flow from operations.
Taking these items into account, Goodrich expects 2004 fully diluted EPS to be in the range of
$1.20 - $1.35. EPS from continuing operations, which excludes the one-time gain from the
cumulative effect of accounting change but including the ongoing negative impact of this
accounting change and stock option expensing, is expected to be between $1.07 - $1.22.
2004 Outlook
EPS Outlook
EPS from continuing operations (diluted)* $1.07 - $1.22
Cumulative effect of change in accounting - beginning of year $0.13
Net Income (diluted EPS) $1.20 - $1.35
* Includes:
Change in accounting - operating income impact ($0.05)
Stock option expensing ($0.09)
Goodrich expects cash flow from operations, minus capital expenditures, to approximate net
income in 2004. The company expects capital expenditures in 2004 to be substantially higher
than the 2003 expenditures of $125 million.
The current earnings and cash flow outlook does not include any consideration for premiums
associated with potential early retirement of debt, settlement of pending tax litigation related to
previously disclosed Rohr and Coltec cases or potential contractual disputes with Northrop
Grumman related to the purchase of Aeronautical Systems from TRW.
----------------------
Page 5
6. The supplemental segment discussion and tables that follow provide more detailed information
about the fourth quarter 2003 results.
----------------------
Goodrich will hold a conference call on February 5, 2004 at 10:00 AM U.S. Eastern time to
discuss this announcement. Interested parties can listen to a live webcast of the conference call,
and view a presentation, at www.goodrich.com, or listen via telephone by dialing 913-981-5571.
----------------------
Goodrich Corporation, a Fortune 500 company, is a leading global supplier of systems and
services to the aerospace and defense industry. Goodrich technology is involved in making
aircraft fly… helping them land… and keeping them safe. Serving a global customer base with
significant worldwide manufacturing and service facilities, Goodrich is one of the largest
aerospace companies in the world. For more information visit http://www.goodrich.com
Forward-looking Statements
Certain statements made in this release are forward-looking statements within the meaning of the
Private Securities Litigation Reform Act of 1995 regarding the company's future plans,
objectives, and expected performance. Specifically, statements that are not historical facts,
including statements accompanied by words such as “believe,” “expect,” “anticipate,” “intend,”
“estimate,” or “plan,” are intended to identify forward-looking statements and convey the
uncertainty of future events or outcomes. The company cautions readers that any such forward-
looking statements are based on assumptions that the company believes are reasonable, but are
subject to a wide range of risks, and actual results may differ materially.
Important factors that could cause actual results to differ include, but are not limited to: the
extent to which the company is successful in integrating Aeronautical Systems and achieving
expected operating synergies; potential contractual disputes with Northrop Grumman related to
the purchase of Aeronautical Systems; the nature, extent and timing of the company’s proposed
restructuring and consolidation actions and the extent to which the company is able to achieve
savings from these actions; the possibility of additional restructuring and consolidation actions
beyond those previously announced by the company; global demand for aircraft spare parts and
aftermarket services; threats associated with and efforts to combat terrorism, including the
current situation in Iraq; the impact of Severe Acute Respiratory Syndrome (SARS) on global
travel; the health of the commercial aerospace industry, including the impact of additional
bankruptcies in the airline industry; demand for and market acceptance of new and existing
products, such as the Airbus A380, the Joint Strike Fighter, the Boeing 7E7 and the Embraer
190; potential cancellation of orders by customers; successful development of products and
advanced technologies; the effect of changes in accounting policies including the proposed
change in contract accounting at the company’s Aerostructures business; competitive product
and pricing pressures; possible assertion of claims against the company on the theory that it, as
the former corporate parent of Coltec Industries Inc, bears some responsibility for the asbestos-
related liabilities of Coltec and its subsidiaries, or that Coltec's dividend of its aerospace business
Page 6
7. to the company prior to the EnPro spin-off was made at a time when Coltec was insolvent or
caused Coltec to become insolvent; the company’s ability to recover from third parties under
contractual rights of indemnification for environmental and other claims arising out of the
divestiture of the company’s tire, vinyl and other businesses; domestic and foreign government
spending, budgetary and trade policies; economic and political changes in international markets
where the company competes, such as changes in currency exchange rates, inflation rates,
recession and other external factors over which the company has no control; and the outcome of
contingencies (including completion of acquisitions, divestitures, litigation and environmental
remediation efforts). Further information regarding the factors that could cause actual results to
differ materially from projected results can be found in the company's filings with the Securities
and Exchange Commission, including in the company's Annual Report on Form 10-K for the
year ended December 31, 2002.
The company cautions you not to place undue reliance on the forward-looking statements
contained in this release, which speak only as of the date on which such statements were made.
The company undertakes no obligation to release publicly any revisions to these forward-looking
statements to reflect events or circumstances after the date on which such statements were made
or to reflect the occurrence of unanticipated events.
###
Page 7
8. Supplemental Segment Review
Total Segment Results 4Q 2003 4Q 2002
Sales and Pre- Sales and Pre-
tax earnings tax earnings
($ in Millions) Margin % ($ in Millions) Margin
%
Sales $1,130 $1,157
Segment Operating Income $114 10.1% $81 7.0%
Included in Segment Operating Income (pre-tax):
Inventory step-up (Aeronautical Systems related) -- -- ($59) (5.1%)
In-process R&D (Aeronautical Systems related) -- -- ($13) (1.1%)
Facility closures and headcount reductions ($7) (0.6%) ($11) (1.0%)
Segment pension expense ($20) (1.8%) ($9) (0.8%)
Total of items above ($27) (2.4%) ($92) (8.0%)
Included below is a summary discussion of sales and operating income changes by segment.
Pension expense is an element of variance in all segments, and is not discussed specifically
below.
Airframe Systems - Sales decreased $28 million, or 6 percent, from $479 million in the fourth
quarter of 2002 to $451 million in the fourth quarter of 2003. The decrease was primarily due to
lower sales for landing gear original equipment, wheel and brake and aeronautical systems’
product repair services, and heavy airframe maintenance during the fourth quarter of 2003.
Operating income increased $2.8 million, or 20.7%, from $13.5 million in the fourth quarter of
2002 to $16.3 million in the fourth quarter of 2003. Airframe Systems recorded $39.3 million of
in-process R&D and inventory step-up accounting charges in 2002 associated with the
acquisition of the Aeronautical Systems businesses, which did not recur in 2003. Excluding
these charges, the operating income decline of $36.5 million over the same period a year ago was
attributable in part to the decreased sales noted above for landing gear original equipment, wheel
and brake repair services, and heavy airframe maintenance during the fourth quarter of 2003. In
addition, the sales associated with the Aeronautical Systems businesses in this segment resulted
in a loss for the fourth quarter of 2003.
Engine Systems - Sales increased 1 percent, from $402 million in the fourth quarter 2002 to $407
million in the fourth quarter 2003. Higher sales in Aerostructures were mostly offset by
decreased sales of aerospace and industrial gas turbine components at Turbomachinery Products.
Operating income increased 120 percent, from $27.0 million in the fourth quarter 2002 to $59.6
million. The primary contributor to the increased operating income was the $24.1 million of
inventory step-up accounting charges in 2002 associated with the acquisition of the Aeronautical
Systems businesses, which did not recur in 2003. Turbomachinery Products also reported
improved operating results even though sales declined, due to successful implementation of
facility closure and headcount reduction actions.
Page 8
9. Electronic Systems – Sales for the fourth quarter 2003 decreased 2 percent to $272 million, from
$277 million in the fourth quarter 2002. Increased sales for the Lighting Systems, Sensor
Systems and Propulsion Systems businesses were largely offset by decreased sales in the Optical
and Space Systems and Power Systems businesses.
Operating income decreased about 4 percent from the year-ago quarter, from $40.0 million to
$38.3 million. Electronic Systems recorded $7.9 million of inventory step-up accounting charges
in 2002 associated with the acquisition of the Aeronautical Systems businesses, which did not
recur in 2003. After taking these into account, primary contributors to the reduced operating
income were the reduced sales for the Optical and Space Systems business, unfavorable product
mix in Aircraft Interior Products and increased spending on A380 product development.
Page 9
10. GOODRICH CORPORATION
(Dollars in millions except per share amounts)
Three Months Ended Twelve Months Ended
December 31, December 31,
2003 2002 2003 2002
Sales $ 1,130.3 $ 1,157.0 $ 4,382.9 $ 3,808.5
Operating Income 89.3 61.5 260.1 358.6
Interest Expense 1 (38.4) (36.3) (155.5) (106.2)
Interest Income 0.6 6.7 6.0 32.6
Other Expense - net (1.4) (4.5) (26.3) (18.1)
Income before Income Taxes
and Trust Distributions 50.1 27.4 84.3 266.9
Income Tax Expense (17.4) (13.2) (27.8) (92.2)
Distributions on Trust Preferred
Securities - (2.6) (7.9) (10.5)
Income from Continuing Operations 32.7 11.6 48.6 164.2
Income (Loss) from Discontinued Operations - 0.1 62.4 (10.2)
Cumulative Effect of Change in Accounting - - (0.5) (36.1)
Net Income $ 32.7 $ 11.7 $ 110.5 $ 117.9
Income Per Share:
Basic
Continuing Operations $ 0.28 $ 0.11 $ 0.41 $ 1.58
Discontinued Operations - - 0.52 (0.09)
Cumulative Effect of Change in Accounting - - - (0.35)
Net Income $ 0.28 $ 0.11 $ 0.93 $ 1.14
Diluted
Continuing Operations $ 0.28 $ 0.11 $ 0.41 $ 1.56
Discontinued Operations - - 0.52 (0.08)
Cumulative Effect of Change in Accounting - - - (0.34)
Net Income $ 0.28 $ 0.11 $ 0.93 $ 1.14
Weighted - Average Number
of Shares Outstanding
(in millions):
Basic 117.5 108.9 117.4 103.7
Diluted 118.9 109.1 118.2 105.5
1
As a result of the Company's adoption of FASB Interpretation No. 46 quot;Consolidation of Variable Interest Entitiesquot; (FIN 46), debt has
increased primarily due to the Mandatorily Redeemable Preferred Securities of Trust (QUIPS). Accordingly, Distributions on Trust
Preferred Securities has been reclassified to Interest Expense. Prior periods have not been restated.
11. GOODRICH CORPORATION SEGMENT REPORTING
(Dollars in millions)
Three Months Ended Twelve Months Ended
December 31, December 31,
2003 2002 2003 2002
Sales:
Airframe Systems $ 451.1 $ 478.6 $ 1,784.4 $ 1,451.6
Engine Systems 406.9 401.8 1,557.8 1,422.6
Electronic Systems 272.3 276.6 1,040.7 934.3
Total Sales $ 1,130.3 $ 1,157.0 $ 4,382.9 $ 3,808.5
Operating Income:
Airframe Systems $ 16.3 $ 13.5 $ 78.7 $ 100.6
Engine Systems 59.6 27.0 113.2 171.2
Electronic Systems 38.3 40.0 139.6 147.4
Total Segment Operating Income 114.2 80.5 331.5 419.2
Corporate General and Administrative Costs (24.9) (19.0) (71.4) (60.6)
Total Operating Income $ 89.3 $ 61.5 $ 260.1 $ 358.6
Segment Operating Income as a Percent of Sales :
Airframe Systems 3.6% 2.8% 4.4% 6.9%
Engine Systems 14.6% 6.7% 7.3% 12.0%
Electronic Systems 14.1% 14.5% 13.4% 15.8%
Total Segment Operating Income as a Percent of Sales 10.1% 7.0% 7.6% 11.0%
12. GOODRICH CORPORATION
SUPPLEMENTARY FINANCIAL INFORMATION
(Dollars in millions)
Twelve Months Ended
December 31,
2003 2002
Non-Segment Expenses:
Net Interest Expense $ (149.5) $ (73.6)
- Payment-in-Kind Interest Income $ 4.3 $ 23.3
(included in Net Interest Expense above)
Other Income (Expense), Net: $ (26.3) $ (18.1)
- Discontinued Retiree Health Care $ (20.7) $ (18.1)
- Other Income (Expense) $ (5.6) $ -
Twelve Months Ended
December 31,
2003 2002
Preliminary Balance Sheet and Cash Flow Data:
Short-term Bank Debt $ 2.7 $ 379.2
Current Maturities of Long-term Debt
and Capital Lease Obligations1 $ 75.6 $ 3.9
Long-term Debt and Capital Lease Obligations $ 2,136.6 $ 2,129.0
Total Debt $ 2,214.9 $ 2,512.1
Cash and Cash Equivalents $ 378.4 $ 149.9
Net Debt2 $ 1,836.5 $ 2,362.2
Dividends $ 94.0 $ 96.9
Depreciation and Amortization $ 219.1 $ 180.8
- Depreciation $ 157.8 $ 133.0
- Amortization $ 61.3 $ 47.8
1
As a result of the Company's adoption of FASB Interpretation No. 46 quot;Consolidation of Variable
Interest Entitiesquot; (FIN 46), debt has increased primarily due to the Mandatorily Redeemable
Preferred Securities of Trust (QUIPS). Prior periods have not been restated to reflect the
change. If prior periods had been restated, debt would have increased by $130.4 million for 2002.
2
Total Debt (defined as short-term debt plus current maturities of long-term debt and capital
lease obligations plus long-term debt and capital lease obligations) and Net Debt (defined
as Total Debt minus cash and cash equivalents) are non-GAAP financial measures that the
Company believes are useful to rating agencies and investors in understanding the Company’s
capital structure and leverage. Because all companies do not calculate these measures
in the same manner, the Company's presentation may not be comparable to other
similarly titled measures reported by other companies.
13. PRELIMINARY CONSOLIDATED BALANCE SHEET (UNAUDITED)
(DOLLARS IN MILLIONS, EXCEPT SHARE AMOUNTS)
DECEMBER 31 2003 2002
CURRENT ASSETS
Cash and cash equivalents ................................................................................ $ 378.4 $ 149.9
Accounts and notes receivable ......................................................................... 608.5 716.0
Inventories........................................................................................................ 979.3 962.6
Deferred income taxes...................................................................................... 53.3 121.3
Prepaid expenses and other assets .................................................................... 82.7 38.0
Assets of discontinued operations .................................................................... -- 46.5
TOTAL CURRENT ASSETS....................................................................... 2,102.2 2,034.3
Property ............................................................................................................ 1,175.9 1,222.4
Prepaid pension ................................................................................................ 219.5 250.5
Goodwill........................................................................................................... 1,259.5 1,194.2
Identifiable intangible assets ............................................................................ 484.7 464.9
Payment-in-kind notes receivable, less discount
($11.0 at December 31, 2002) ..................................................................... -- 141.7
Deferred income taxes...................................................................................... 65.4 45.5
Other assets ...................................................................................................... 643.7 644.8
TOTAL ASSETS .......................................................................................... $ 5,950.9 $ 5,998.3
CURRENT LIABILITIES
Short-term bank debt ........................................................................................ $ 2.7 $ 379.2
Accounts payable ............................................................................................. 414.5 435.8
Accrued expenses ............................................................................................. 648.2 576.9
Income taxes payable ....................................................................................... 259.9 150.8
Liabilities of discontinued operations............................................................... -- 16.3
Current maturities of long-term debt and capital lease obligation.................... 75.6 3.9
TOTAL CURRENT LIABILITIES............................................................... 1,400.9 1,562.9
Long-term debt and capital lease obligations ................................................... 2,136.6 2,129.0
Pension obligations........................................................................................... 642.0 722.1
Postretirement benefits other than pensions ..................................................... 319.2 323.2
Deferred income taxes...................................................................................... 50.9 --
Other non-current liabilities ............................................................................. 197.7 202.8
Commitments and contingent liabilities ........................................................... -- --
Mandatorily redeemable preferred securities of trust ....................................... -- 125.4
SHAREHOLDERS’ EQUITY
Common stock-- $5 par value
Authorized, 200,000,000 shares; issued, 131,265,173 shares at December 31,
2003, and 130,568,582 shares at December 31, 2002 (excluding 14,000,000
shares held by a wholly owned subsidiary) ..................................................... 656.3 652.9
Additional paid-in capital ................................................................................. 1,035.8 1,027.4
Income retained in the business........................................................................ 52.5 36.1
Accumulated other comprehensive income (loss)............................................ (126.1) (369.1)
Unearned compensation ................................................................................... (1.4) (1.6)
Common stock held in treasury, at cost (13,539,820 shares in 2003
and 13,506,977 shares in 2002)..................................................................... (413.5) (412.8)
TOTAL SHAREHOLDERS’ EQUITY ........................................................ 1,203.6 932.9
TOTAL LIABILITIES AND SHAREHOLDERS’ EQUITY ....................... $ 5,950.9 $ 5,998.3
14. PRELIMINARY CONSOLIDATED STATEMENT OF CASH FLOWS (UNAUDITED)
(DOLLARS IN MILLIONS)
YEAR ENDED DECEMBER 31 2003 2002 2001
OPERATING ACTIVITIES
Income from continuing operations.............................................................. $ 48.6 $ 164.2 $ 172.9
Adjustments to reconcile income from continuing operations
to net cash provided by operating activities:
Restructuring and consolidation:
Expenses................................................................................................... 51.1 37.4 103.9
Payments .................................................................................................. (46.6) (51.5) (29.9)
In-process research and development......................................................... -- 12.5 --
Aeronautical Systems inventory step-up .................................................... -- 58.8 --
Asset Impairments...................................................................................... 86.1 -- 93.5
Depreciation and amortization ................................................................... 219.1 180.8 169.5
Deferred income taxes................................................................................ 77.4 (2.3) 27.5
Net gains on sale of businesses .................................................................. -- (2.5) (7.8)
Payment-in-kind interest income................................................................ (4.3) (23.3) (17.6)
Change in assets and liabilities, net of effects of
acquisitions and dispositions of businesses:
Receivables .............................................................................................. 96.8 109.1 22.9
Change in receivables sold, net ................................................................ -- -- 46.3
Inventories................................................................................................ (33.5) 55.1 (90.1)
Other current assets .................................................................................. (5.9) (18.6) (9.6)
Accounts payable ..................................................................................... (52.2) (97.1) 4.7
Accrued expenses..................................................................................... 28.7 (27.8) 23.9
Income taxes payable ............................................................................... 77.4 129.8 (60.0)
Tax benefit on non-qualified options ....................................................... 0.4 0.5 7.7
Other non-current assets and liabilities .................................................... 10.0 (0.9) (83.0)
NET CASH PROVIDED BY OPERATING ACTIVITIES....................... 553.1 524.2 374.8
INVESTING ACTIVITIES
Purchases of property ................................................................................... (125.1) (106.1) (187.4)
Proceeds from sale of property..................................................................... 6.9 15.1 2.0
Proceeds from sale of businesses ................................................................. -- 6.0 18.9
Proceeds from payment-in-kind note ........................................................... 151.9 49.8 --
Payments received (made) in connection with acquisitions,
net of cash acquired.................................................................................. 23.6 (1,472.6) (111.6)
NET CASH PROVIDED (USED) BY INVESTING ACTIVITIES........ 57.3 (1,507.8) (278.1)
FINANCING ACTIVITIES
Increase (decrease) in short-term debt, net................................................... (377.4) 264.0 (626.4)
Proceeds from issuance of long-term debt and capital lease obligations...... 20.0 793.1 1.0
Repayment of long-term debt and capital lease obligations ......................... (74.9) (1.4) (179.7)
Proceeds from issuance of common stock.................................................... 9.1 220.2 51.4
Purchases of treasury stock .......................................................................... (0.3) (4.9) (47.1)
Dividends ..................................................................................................... (94.0) (96.9) (113.7)
Distributions on Trust preferred securities ................................................... (7.9) (10.5) (10.5)
NET CASH PROVIDED (USED) BY FINANCING ACTIVITIES ....... (525.4) 1,163.6 (925.0)
DISCONTINUED OPERATIONS
Net cash (used) provided by discontinued operations .................................. 138.1 (118.7) 836.6
Effect of Exchange Rate Changes on Cash and Cash Equivalents............... 5.4 2.8 --
Net Increase in Cash and Cash Equivalents ................................................. 228.5 64.1 8.3
Cash and Cash Equivalents at Beginning of Year ........................................ 149.9 85.8 77.5
Cash and Cash Equivalents at End of Year .................................................. $ 378.4 $ 149.9 $ 85.8