Download to read offline

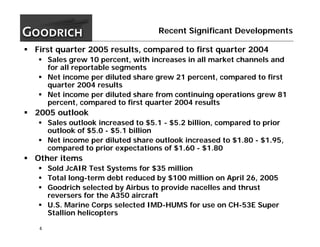
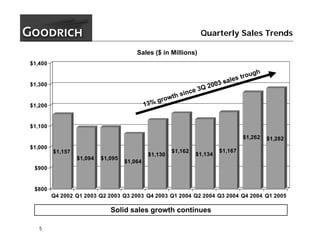
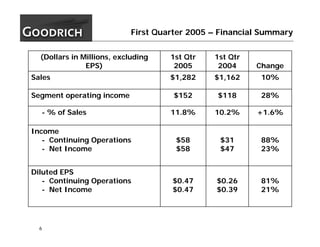
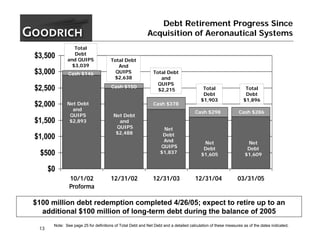


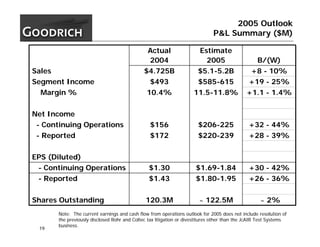
- Goodrich Corporation reported first quarter 2005 results, with sales growth of 10% and net income per share growth of 21% compared to first quarter 2004. - The company increased its 2005 outlook with expected sales of $5.1-5.2 billion and net income per share of $1.80-$1.95. - Segment operating income grew 28% in the first quarter due to increases in all market channels and reportable segments.


