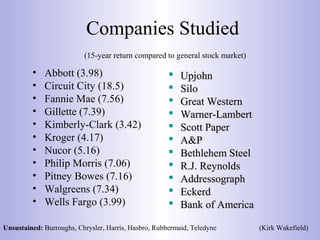
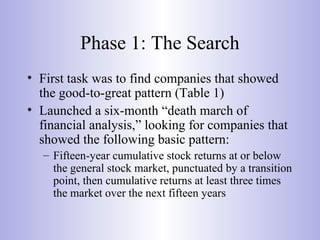
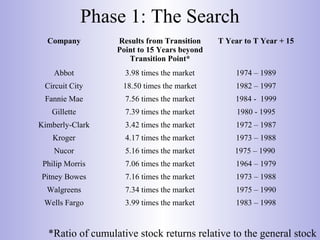
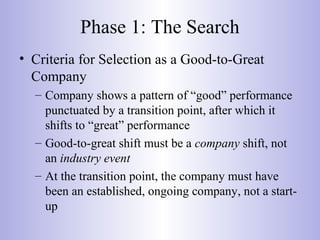
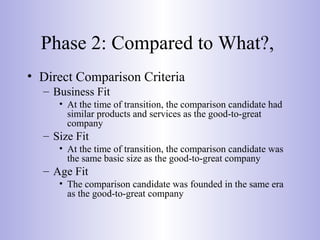
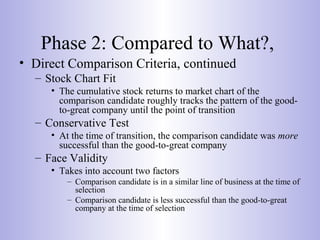
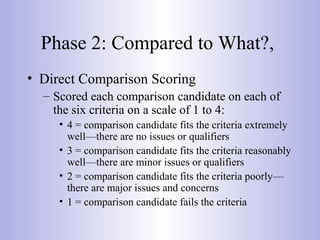
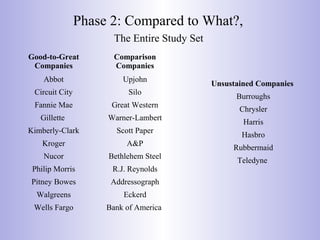
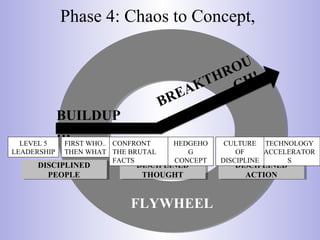
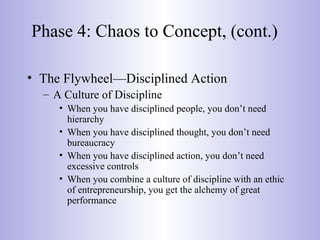
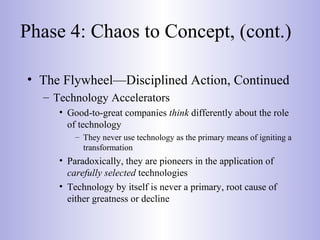
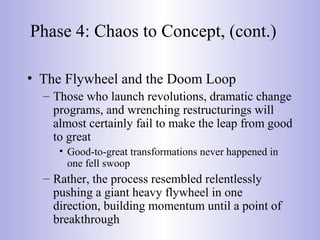
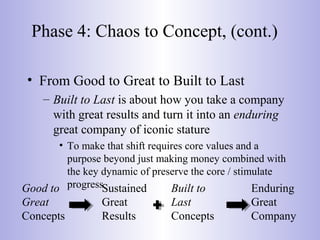
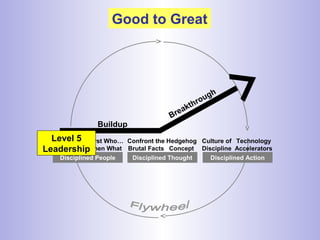
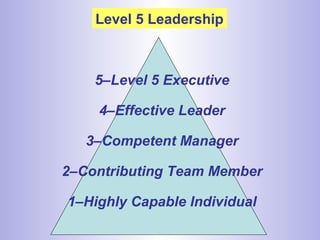
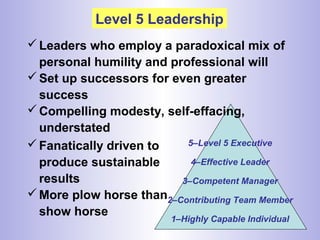
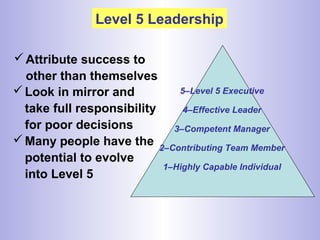
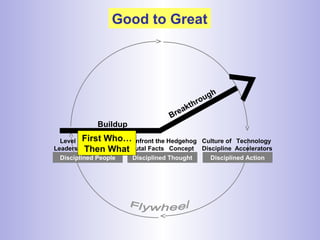
21st Century Human Capital Challenges and OpportunitiesCynthia G. Wagner
Presented by Edwin Mourino
This session will address the perfect storm that is brewing in the 21st-century workplace that includes a confluence of such factors as:
-An aging society and workforce.
-New workplace dynamics to accommodate a younger generations of workers.
-Educational gaps between industry needs and graduating candidates.
-The rapid pace of technology changes.
Employee development is fundamental in accomplishing organisational goals in today’s competitive and ever-changing business world.
An organisation cannot function without its employees, so businesses must invest resources and show commitment to supporting their training. But most importantly, having a development plan goes a long way in meeting the expectation of both employers and employees.
As a manager or business leader, how do you approach the development of your employees? Are you applying the adequate procedures and processes necessary to achieve significant outcomes?
In this deck, you will find actionable steps and strategies to help you design an effective development plan for your employees.
You will also learn:
What Employee Development entails
How to apply a project management framework to employee development.
How to approach employee development and the benefits of the approach
The six (6) steps in creating an effective employee development plan
A presentation given on how to move your company/department from good to great. Borrows heavily from the theory of Jim Collins.
If you're looking for great tools to implement Good to Great in your organisation take a look at - http://fiverr.com/expatpat/show-you-great-tools-to-run-your-startup-or-sme
An agile approach to organizational development. The Acelera The Sprint is an iterative innovation process focused on the creation of value and the priorities of the organization, which compresses years of learning in just a few months, accelerating the transformation via integrated agile teams, massive collaboration as a value creation model and putting the emphasis on the development of transformative leadership and the adoption of agile methodologies and new digital ways of doing.
In his previous bestseller, Built to Last, Jim Collins explored what made great companies great and how they sustained that greatness over time.
One point kept nagging him, though — great companies have, for the most part, always been great, while a vast majority of good companies remain just that: good, but not great. What could merely good companies do to become great, to turn long-term weakness into long-term supremacy?
Collins and his team of researchers used strict benchmarks to identify a group of eleven elite companies that made the leap from good to great and sustained that greatness for at least fifteen years. The companies that made the list might surprise you as much as those left off (the likes of Intel, GE
and Coca Cola are nowhere to be found).
The real surprise of Good to Great isn’t so much what good companies do to propel themselves to greatness — it’s why more companies haven’t done the same things more often.
Presentation on Transformational Leadership,meaning of leadership,transformational Leadership,components Of transformational leadership,transformational leadership style,benefits and limitations of approach..
Teal Organizations: Reinventing organizations to promote sustainabilityKarla Córdoba
A quick introduction to the Teal Organizations concept... to start thinking about how we can create more sustainable organizations
https://medium.com/sustainability-school-blog
Presented at Empowering Sustainability on Earth Conference 2016
http://empowering-sustainability.weebly.com/
When it comes to running a business successfully, the street vendor and the CEOs of some
of the world’s largest and most successful companies talk and think very much alike.
-Ram Charan-
Reviews the major alternatives open to business executives during mergers, and the associated post-merger returns for companies adopting each of the three main alternatives.
The research suggests that the choice of corporate brand strategy is value relevant, and may play an important role in facilitating a smooth process of post-merger integration.
There are specific steps to take when preparing a supportable business valuation.
If you need a business valuation and want to make sure that the valuation expert covers all of the bases, you should look at our slides to understand the basics of the valuation process.
This presentation is on Environment Scanning In Strategic management
It includes -
Introduction
Need for Environment Scanning
Appraisal of external environment
Dynamics of internal environment
Porter’s Five forces model
BCG Matrix
Porter's Generic Strategies
Value Chain analysis
Types of Adaptive strategies
what is valuation of a company, reasons for valuation, various methods of valuation, preferred methods to value an E-commerce industry, various factors to consider while valuing an E-commerce industry
2. Good to Great
First sentence of chapter 1:
“Good is the enemy of great.”
• Why is that true?
3. Companies Studied
(15-year return compared to general stock market)
• Abbott (3.98)
• Circuit City (18.5)
• Fannie Mae (7.56)
• Gillette (7.39)
• Kimberly-Clark (3.42)
• Kroger (4.17)
• Nucor (5.16)
• Philip Morris (7.06)
• Pitney Bowes (7.16)
• Walgreens (7.34)
• Wells Fargo (3.99)
UpjohnUpjohn
SiloSilo
Great WesternGreat Western
Warner-LambertWarner-Lambert
Scott PaperScott Paper
A&PA&P
Bethlehem SteelBethlehem Steel
R.J. ReynoldsR.J. Reynolds
AddressographAddressograph
EckerdEckerd
Bank of AmericaBank of America
Unsustained: Burroughs, Chrysler, Harris, Hasbro, Rubbermaid, Teledyne (Kirk Wakefield)
4.
5. Overview
• While presenting his first book, Bill Meehan,
the managing director of the San Francisco
office of McKinsey & Company, told Jim
Collins,
– “You know, Jim, we love Built to Last around here.
You and your coauthor did a very fine job on the
research and writing. Unfortunately, it’s useless.”
• This was the spark of curiosity that began five
years of research and resulted in Good to
Great.
6. Overview
• The five-year research effort yielded many
insights, but one conclusion stands out
above the others
– Most any organization can substantially
improve its stature and performance, perhaps
even become great, if it conscientiously applies
the framework of ideas we’ve uncovered
7. Phase 1: The Search
• First task was to find companies that showed
the good-to-great pattern (Table 1)
• Launched a six-month “death march of
financial analysis,” looking for companies that
showed the following basic pattern:
– Fifteen-year cumulative stock returns at or below
the general stock market, punctuated by a transition
point, then cumulative returns at least three times
the market over the next fifteen years
8. Phase 1: The Search
Company Results from Transition
Point to 15 Years beyond
Transition Point*
T Year to T Year + 15
Abbot 3.98 times the market 1974 – 1989
Circuit City 18.50 times the market 1982 – 1997
Fannie Mae 7.56 times the market 1984 - 1999
Gillette 7.39 times the market 1980 - 1995
Kimberly-Clark 3.42 times the market 1972 – 1987
Kroger 4.17 times the market 1973 – 1988
Nucor 5.16 times the market 1975 – 1990
Philip Morris 7.06 times the market 1964 – 1979
Pitney Bowes 7.16 times the market 1973 – 1988
Walgreens 7.34 times the market 1975 – 1990
Wells Fargo 3.99 times the market 1983 – 1998
*Ratio of cumulative stock returns relative to the general stock
9. Phase 1: The Search
• Criteria for Selection as a Good-to-Great
Company
– Company shows a pattern of “good” performance
punctuated by a transition point, after which it
shifts to “great” performance
– Good-to-great shift must be a company shift, not
an industry event
– At the transition point, the company must have
been an established, ongoing company, not a start-
up
10. Phase 1: The Search
• Criteria for Selection as a Good-to-Great
Company, continued
– The transition point had to occur before 1985 so
that there would be enough data to assess the
sustainability of the transition
– Whatever the year of transition, the company still
had to be a significant, ongoing, stand-alone company
at the time of selection
– At the time of selection, the company should still
show an upward trend
11. Phase 1: The Search
• The Good-to-Great Screening and Selection
Process
– Cut 1: From the Universe of Companies to 1,435
Companies
• Selected from the Fortune 500, 1965 – 1995
– Cut 2: From 1,435 Companies to 126 Companies
• Selected into full CRSP data pattern analysis
– Cut 3: From 126 Companies to 19 Companies
• Selected into Industry Analysis
– Cut 4: From 19 Companies to 11 Good-to-Great
Companies
• Selected into Good-to-Great Set
12. Phase 2: Compared to What?
• Two types of comparison companies
– Direct comparisons
• Companies that were in the same industry as the good-to-
great opportunities and similar resources at the time of
transition, but showed no leap from good to great
– Unsustained comparisons
• Companies that made a short-term shift from good to
great but failed to maintain the trajectory
• Intended to address the question of sustainability
• Comparisons are displayed in Appendix 1.C, page 234
13. Phase 2: Compared to What,
• Direct Comparisons
– Purpose of direct comparison analysis is to create
as close to a “historical controlled experiment” as
possible
– Helped in identifying distinguishing variables that
account for the transition from good to great
– Performed a systematic and methodical collection
and scoring of all obvious comparison candidates
for each good-to-great company
14. Phase 2: Compared to What?,
• Direct Comparison Criteria
– Business Fit
• At the time of transition, the comparison candidate had
similar products and services as the good-to-great
company
– Size Fit
• At the time of transition, the comparison candidate was
the same basic size as the good-to-great company
– Age Fit
• The comparison candidate was founded in the same era
as the good-to-great company
15. Phase 2: Compared to What?,
• Direct Comparison Criteria, continued
– Stock Chart Fit
• The cumulative stock returns to market chart of the
comparison candidate roughly tracks the pattern of the good-
to-great company until the point of transition
– Conservative Test
• At the time of transition, the comparison candidate was more
successful than the good-to-great company
– Face Validity
• Takes into account two factors
– Comparison candidate is in a similar line of business at the time of
selection
– Comparison candidate is less successful than the good-to-great
company at the time of selection
16. Phase 2: Compared to What?,
• Direct Comparison Scoring
– Scored each comparison candidate on each of
the six criteria on a scale of 1 to 4:
• 4 = comparison candidate fits the criteria extremely
well—there are no issues or qualifiers
• 3 = comparison candidate fits the criteria reasonably
well—there are minor issues or qualifiers
• 2 = comparison candidate fits the criteria poorly—
there are major issues and concerns
• 1 = comparison candidate fails the criteria
17. Phase 2: Compared to What?,
The Entire Study Set
Good-to-Great
Companies
Comparison
Companies
Abbot Upjohn
Circuit City Silo
Fannie Mae Great Western
Gillette Warner-Lambert
Kimberly-Clark Scott Paper
Kroger A&P
Nucor Bethlehem Steel
Philip Morris R.J. Reynolds
Pitney Bowes Addressograph
Walgreens Eckerd
Wells Fargo Bank of America
Unsustained Companies
Burroughs
Chrysler
Harris
Hasbro
Rubbermaid
Teledyne
18. Phase 3: Inside the Black Box
• Research Phase
– Systematically coded all materials into
categories, conducted interviews, and initiated a
wide range of analyses
• Project began with the goal of building a
theory from the ground up
19. Phase 3: Inside the Black Box,
• In the study, what they didn’t find turned
out to be some of the best clues to the inner
workings of good to great
Good Results
What’s
Inside the
BLACK
BOX?
What’s
Inside the
BLACK
BOX?
Great
Results
20. Phase 3: Inside the Black Box,
• Company Coding Documents Collected
– All major articles published on the company over
its entire history
– Materials obtained directly from companies
– Books written about the industry, company, and/or
its leaders
– Business school case studies and industry analyses
– Business and industry reference materials
– Annual reports, proxy statements, analyst reports,
and any other materials available on the company,
especially during the transition era
21. Phase 3: Inside the Black Box,
• Coding System Categories
– Category 1: Organizing Arrangements
– Category 2: Social Factors
– Category 3: Business Strategy, Strategic
Processes
– Category 4: Markets, Competitors, and
Environment
– Category 5: Leadership
– Category 6: Products and Services
22. Phase 3: Inside the Black Box,
• Coding System Categories, continued
– Category 7: Physical Setting and Location
– Category 8: Use of Technology
– Category 9: Vision: Core Values, Purpose, and
BHAGs
– Category 10
• A: Change/Transition Activities during Transition Era
of Corresponding Good-to-Great Company (Direct
Comparisons Only)
• B: Attempted Transition Era (Unsustained Comparisons
Only)
– Category 11: Posttransition Decline (Unsustained
Comparisons Only)
23. Phase 3: Inside the Black Box,
• Other Research Elements
– Financial Spreadsheet Analysis
• Examined all financial variables for 980 combined
years of data (35 years on average per company)
• Comprised gathering raw income and balance sheet data
and examining variables in both the pre- and
posttransition decades
– Executive Interviews
• Conducted interviews of senior management and board
members, focusing on those in office during the
transition era
24. Phase 3: Inside the Black Box,
• Special Analysis Units
– Acquisitions and Divestitures
• Sought to understand the role of acquisitions and divestments
in the transition from good to great
– Industry Performance Analysis
• Looked at the performance of the companies versus the
performance of the industries
– Executive Churn Analysis
• Looked at the extent to which the executive teams changed
during the crucial points in companies’ histories
– CEO Analysis
• Performed a qualitative examination of each set of CEOs
during the transition eras in all three sets of companies
25. Phase 3: Inside the Black Box,
• Special Analysis Units, continued
– Executive Compensation
• Examined across the twenty-eight companies studied, from ten
years before the transition point to 1998
– Role of Layoffs
• Sought to examine all companies for evidence of layoffs as a
conscious tactic to improve company performance
– Corporate Ownership Analysis
• Aimed to determine if there were any significant differences
between companies
– Media Hype Analysis
• Looked at the degree of “media hype” surrounding the companies
– Technology Analysis
• Examined the role of technology, drawing largely upon executive
interviews and written source materials
26. Phase 3: Inside the Black Box,
• Comparative Analysis Frameworks
– Performed throughout the research effort
– While less detailed than the other portions of
the research effort, all were derived directly
from research evidence
– Included topics such as
• The use of bold corporate moves
• Executive class versus egalitarianism
• Three-circle analysis and fit with core values and
purpose
27. Phase 4: Chaos to Concept
• Every primary concept in the final framework
showed up as a change variable in 100 percent
of the good-to-great companies and in less than
30 percent of the comparison companies
during the pivotal years
• The Flywheel captures the gestalt of the entire
process of going from good to great
28. Phase 4: Chaos to Concept,
DISCIPLINED
PEOPLE
DISCIPLINED
PEOPLE
DISCIPLINED
THOUGHT
DISCIPLINED
THOUGHT
DISCIPLINED
ACTION
DISCIPLINED
ACTION
FIRST WHO..
THEN WHAT
LEVEL 5
LEADERSHIP
TECHNOLOGY
ACCELERATOR
S
HEDGEHO
G
CONCEPT
BUILDUP
…
BREAKTHROU
GH!
FLYWHEEL
CULTURE
OF
DISCIPLINE
CONFRONT
THE BRUTAL
FACTS
29. Phase 4: Chaos to Concept,
• The Flywheel—Disciplined People
– Level 5 Leadership
• Good-to-great leaders are self-effacing, reserved, even
shy—a paradoxical blend of personal humility and
professional will
– First Who…Then What
• Good-to-great leaders first got the right people on the
bus, the wrong people off the bus, and the right people
in the right seats
• Then they figured out where to drive it
• People are not your most important asset. The right
people are.
30. Phase 4: Chaos to Concept, (cont.)
• The Flywheel—Disciplined Thought
– Confront the Brutal Facts (Yet Never Lose Faith)
• Every good-to-great company embraced what came to be
called the Stockdale Paradox
– Must maintain unwavering faith that you can and will prevail in
the end, regardless of the difficulties, AND at the same time have
the discipline to confront the most brutal facts of your current
reality, whatever they might be
– The Hedgehog Concept (Simplicity within the Three
Circles)
• To go from good to great requires transcending the curse of
competence
• If you cannot be the best in the world at your core business,
then your core business absolutely cannot form the basis of a
great company
– It must be replaced with a simple concept that reflects deep
understanding of three intersecting circles
31. Phase 4: Chaos to Concept, (cont.)
• The Flywheel—Disciplined Action
– A Culture of Discipline
• When you have disciplined people, you don’t need
hierarchy
• When you have disciplined thought, you don’t need
bureaucracy
• When you have disciplined action, you don’t need
excessive controls
• When you combine a culture of discipline with an ethic
of entrepreneurship, you get the alchemy of great
performance
32. Phase 4: Chaos to Concept, (cont.)
• The Flywheel—Disciplined Action, Continued
– Technology Accelerators
• Good-to-great companies think differently about the role
of technology
– They never use technology as the primary means of igniting a
transformation
• Paradoxically, they are pioneers in the application of
carefully selected technologies
• Technology by itself is never a primary, root cause of
either greatness or decline
33. Phase 4: Chaos to Concept, (cont.)
• The Flywheel and the Doom Loop
– Those who launch revolutions, dramatic change
programs, and wrenching restructurings will
almost certainly fail to make the leap from good
to great
• Good-to-great transformations never happened in
one fell swoop
– Rather, the process resembled relentlessly
pushing a giant heavy flywheel in one
direction, building momentum until a point of
breakthrough
34. Phase 4: Chaos to Concept, (cont.)
• From Good to Great to Built to Last
– Built to Last is about how you take a company
with great results and turn it into an enduring
great company of iconic stature
• To make that shift requires core values and a
purpose beyond just making money combined with
the key dynamic of preserve the core / stimulate
progressGood to
Great
Concepts
Sustained
Great
Results
Built to
Last
Concepts
Enduring
Great
Company
35. The Timeless “Physics” of Good to Great
• This book is ultimately about one thing:
– The timeless principles of good to great
• It’s about how you take a good organization of any type
and turn it into one that produces sustained great results,
using whatever definition of results best applies to your
organization
• That good is the enemy of great is not just a
business problem—it is a human problem
– If we have cracked the code on the question of
good to great, we should have something of value
to any type of organization
36. Lesson #1: Leadership
• Humility + Will = Level 5 leadership
• Modest, willful, humble, fearless
• Ego-driven, genius-types, may produce short-term
positive results, but cannot sustain results
• 1=highly capable; 2= contributing team member,
3= competent manager, 4= effective leader,
5=executive that builds enduring greatness thru
personal humility & professional
37. Leadership
Professional Will
• Creates superb results, a clear
catalyst in the transition from
good to great
• Demonstrates an unwavering
resolve to do whatever must be
done to produce the best long-
term results, no matter how
difficult
• Sets the standard of building an
enduring great company; will
settle for nothing less
• Looks in the mirror, not out the
window, to apportion
responsibility for poor results,
never blaming other people,
external factors, or bad luck
Personal Humility
Demonstrates a compelling
modesty, shunning public
adulation; never boastful
Acts with quiet, calm
determination; relies principally
on inspired standards, not
inspiring charisma to motivate
Channels ambition into the
company, not the self; sets up
successors for even greater
success in the next generation
Looks out the window, not in
the mirror, to apportion credit
for the success of the company
—to other people, external
factors, and good luck
38. Level 5
Leadership
First Who…
Then What
Confront the
Brutal Facts
Hedgehog
Concept
Culture of
Discipline
Technology
Accelerators
Disciplined People Disciplined Thought Disciplined Action
Buildup
Breakthrough
Good to Great
39. Level 5
Leadership
First Who…
Then What
Confront the
Brutal Facts
Hedgehog
Concept
Culture of
Discipline
Technology
Accelerators
Disciplined People Disciplined Thought Disciplined Action
Buildup
Breakthrough
Level 5
Leadership
Good to Great
40. Level 5 Leadership
5–Level 5 Executive
4–Effective Leader
3–Competent Manager
2–Contributing Team Member
1–Highly Capable Individual
41. Level 5 Leadership
Leaders who employ a paradoxical mix of
personal humility and professional will
Set up successors for even greater
success
Compelling modesty, self-effacing,
understated
5–Level 5 Executive
4–Effective Leader
3–Competent Manager
2–Contributing Team Member
1–Highly Capable Individual
Fanatically driven to
produce sustainable
results
More plow horse than
show horse
42. Level 5 Leadership
5–Level 5 Executive
4–Effective Leader
3–Competent Manager
2–Contributing Team Member
1–Highly Capable Individual
Look in mirror and
take full responsibility
for poor decisions
Many people have the
potential to evolve
into Level 5
Attribute success to
other than themselves
43. Level 5
Leadership
First Who…
Then What
Confront the
Brutal Facts
Hedgehog
Concept
Culture of
Discipline
Technology
Accelerators
Disciplined People Disciplined Thought Disciplined Action
Buildup
Breakthrough
First Who…
Then What
Good to Great
44. First Who . . . Then What
Leaders began the
transformation by
first getting the
right people on the
bus (and the
wrong people off
the bus).
“Who” questions came before “what”
decisions - before vision, strategy,
organization structure, and tactics.
45. First Who . . . Then What
Three practical disciplines for being
rigorous:
When in doubt, don’t hire
When you know you need to make a
people decision, act
Put your best people
on your best
opportunities, not
biggest problems
Leaders were rigorous, not ruthless in
people decisions.
46. First Who . . . Then What
Management teams debate vigorously
to find best answers, yet unify behind
decisions.
“Right” person has
more to do with
character traits and
innate capabilities
than with knowledge,
background, or skills.
Editor's Notes
-Picked fifteen years because it would transcend one-hit wonders and lucky breaks and would exceed the average tenure of most chief executive officers
-Picked three times the market because it exceeds the performance of most widely acknowledged great companies
Cut 1:
Began with list of companies on the Fortune rankings of America’s largest public companies, going as far back as 1965, when the list came into existence
Fortune list has two key advantages:
Lists only companies of substantial size therefore, nearly every company in the Fortune ranking met the criterion of being an established ongoing company at the time of transition
All companies in the Fortune rankings are publicly traded allowed the use of financial stock return data as the basis for more rigorous screening and analysis
Cut 2:
Used data from the University of Chicago Center for Research in Security Prices (CRSP) to make final selection of good-to-great companies
To pare down the number of companies to a manageable size, used the published Fortune rates-of-return data to reduce the candidate list
The 126 companies passed any ONE of the following tests
Test 1: compound annual total return to investors over the period 1985 – 1995 exceeded the compound annual average return to investors for the Fortune Industrial and Service listings over the same period by 30% AND the company showed evidence of average or below-average performance in the prior two decades (1965 – 1985)
Test 2: compound annual total return to investors over the period 1975 – 1995 exceeded the compound annual average return to investors for the Fortune Industrial and Service listings over the same period by 30% AND the company showed evidence of average or below-average performance in the prior decade (1965 – 1975)
Test 3: The compound annual total return to investors over the period 1965 – 1995 exceeded the compound annual average return to investors for the Fortune Industrial and Service listings over the same period by 30%
The Fortune listings do not contain ten-year returns before 1965, so included all top performers over the three-decade period in the initial set
Test 4: Companies founded after 1970n and whose total return to investors over the period 1985 – 1995 or 1975 – 1995 exceeded the average return to investors for the Fortune Industrial and Service listings over the same period by 30% but that did not meet the above criteria due to a lack of data in the Fortune list in prior decades
Allowed close consideration of any companies that performed well in later decades but did not show up earlier on the Fortune listings
Cut 3:
Drawing upon the research database at the CRSP, analyzed cumulative stock returns of each candidate company relative to the general market, looking for the good-to-great stock return pattern
Any company that met any ONE of the following Cut 3 elimination criteria was eliminated at this stage
Terminology
T year = year identified as the point at which performance began an upward trend—the “transition year,” based on when the actual stock returns showed a visible upward shift
X period = era of observable “good” performance relative to the market immediately prior to the T year
Y period = era of substantially above market performance immediately following the T year
Cut 3 Elimination Criterion #1: company displays a continued upward trend relative to the market over the entire time covered by the CRSP data—there is no X period
Cut 3 Elimination Criterion #2: company shows a flat to gradual rise relative to the market; no obvious shift to breakthrough performance
Cut 3 Elimination Criterion #3: company demonstrates a transition, but an X period of less than ten years; pretransition average performance data was not long enough to demonstrate a fundamental transition
Cut 3 Elimination Criterion #4: company demonstrates a transition from terrible performance to average performance relative to the market
Cut 3 Elimination Criterion #5: company demonstrates a transition, but after 1985; good-to-great transitions that occurred after 1985 might have been legitimate good-to-great transitions, but by completion of research, would not be able to verify that their fifteen-year ratio of cumulative returns to the general market met the three-to-one criterion (cut 1)
Cut 3 Elimination Criterion #6: company shows a transition to increased performance, but the rise in performance is not sustained; after initial rise, goes flat or declines relative to market until time of consideration for selection into study
Cut 3 Elimination Criterion #7: company demonstrates a volatile pattern of returns—large upward and downward swings—with no clear X period, Y period, or T year
Cut 3 Elimination Criterion #8: a complete set of CRSP data is not available before 1975, making it impossible to identify a verifiable X period of ten years
Cut 3 Elimination Criterion #9: there is a transition pattern, but the company demonstrated a period of such spectacular performance prior to the X period that there is substantial evidence that the company is a great company that had fallen temporarily on difficult times
Cut 3 Elimination Criterion #10: company is acquired, has merged, or is otherwise eliminated from consideration as a stand-alone company by the time of the final Cut 3 analysis
Cut 3 Elimination Criterion #11: company shows a mild transition but falls short of three times the market
Cut 4
To separate industry transitions from company transitions, decided to repeat the CRSP analysis for the remaining 19 companies, only this time against a composite industry index rather than the general stock market
Companies that showed a transition relative to their industry would be selected for the final study set
Size Fit
Applied a consistent scoring matrix based upon the ratio of comparison candidate revenues divided by the good-to-great company revenues
Age Fit
Applied a consistent scoring matrix based upon a calculated age ratio of the comparison candidate to the good-to-great company
Stock Chart Fit
After the point of transition, the trajectories of the two companies separate, with the good-to-great company outperforming the comparison candidate from that point on
Conservative Test
At the time of transition, comparison candidate is larger and more profitable, with a stronger market position and better reputation
Is a critical test, stacking the deck against the good-to-great companies
Face validity and conservative test work together:
Conservative test ensures that the comparison company was stronger than the good-to-great company at the year of the good-to-great company’s transition, and weaker than the good-to-great company at the time of selection into the study
After scoring each candidate on each of the six criteria, the scores are averaged
The comparison candidate with the highest average was chosen as the comparison company
Materials obtained directly from companies included books, articles, speeches by executives, internally produce publications, annual reports, and other company documents
Books written about the industry, company, or leaders were both published by the company and by outside observers
Category 1: Organizing Arrangements
“Hard” items such as
Organization structure
Policies and procedures
Systems
Rewards and incentives
Ownership structure
Category 2: Social Factors
“Soft” items such as the company’s
Cultural practices
People policies and practices
Norms
Rituals
Mythology and stories
Group dynamics
Management style
Related items
Category 3: Business Strategy, Strategic Processes
Primary elements of the company’s strategy
Process of setting strategy
Includes significant mergers and acquisitions
Category 4: Markets, Competitors, and Environment
Significant aspects of the company’s competitive and external environment
Primary competitors
Significant competitor activities
Major market shifts
Dramatic national or international events
Government regulations
Industry structural issues
Dramatic technology changes
Related items
Includes data about the company’s relationship to Wall Street
Category 5: Leadership
Leadership of the firm—key executives, CEOs, presidents, board members
Interesting data on leadership succession, leadership style, etc.
Category 6: Products and Services
Significant products and services in the company’s history
Category 7: Physical Setting and Location
Significant aspects of the way the company handled physical space—plant and office layout, new facilities, etc.
Includes any significant decisions regarding the geographic location of key parts of the company
Category 8: Use of Technology
How the company used technology:
Information technology
State-of-the-art processes and equipment
Advanced job configurations
Related items
Category 9: Vision: Core Values, Purpose, and BHAGs
Were these variables present?
If yes, how did they come into being?
Did the organization have them at certain points in its history and not others?
What role did they play?
If it had strong values and purpose, did they remain intact or become diluted?
Category 10
A: Change/Transition Activities During Transition Era of Corresponding Good-to-Great Company (Direct Comparisons Only)
Major attempts to change the company, to stimulate a transition, during the ten years prior and the ten years after the transition date in the corresponding good-to-great company
B: Attempted Transition Era (Unsustained Comparisons Only)
For the ten years leading up to and then during the “attempted transition era,” major change/transition initiatives and supporting activities undertaken by the company
Category 11: Posttransition Decline (Unsustained Comparisons Only)
For the ten years following the attempted transition era, major factors that seem to have contributed to the company not sustaining its transition
Financial Spreadsheet Analysis
Variables included
Total sales in nominal and real (inflation-adjusted) dollars
Sales & profit growth
Profit margin
Return on sales
Sales & Profit per employee in nominal & real dollars
Property, Plant, and Equipment
Executive Interviews
Questions included
Briefly give an overview of your relationship to the company—years involved and primary responsibilities
What do you see as the top 5 factors that contributed to or caused the upward shift in performance? Out of 100 points, allocate appropriate amount to each factor according to importance
Did the company make a conscious decision to initiate a major change or transition during this time frame?
Special Analysis Units
Designed to shed light on the question of good to great by systematic comparison and (where possible) quantification of key variables between the good-to-great companies and the comparison companies
Acquisitions and Divestitures
Objectives
What is the quantitative difference in acquisitions and divestments, if any, between the pretransition and posttransition eras for the good-to-great companies?
How do the good-to-great companies differ in acquisitions and divestments from direct comparisons?
How do the good-to-great companies differ in acquisitions and divestments from the unsustained comparisons?
To do this analysis, created a database for each company, year by year
List of acquisitions made during the year and their financial attributes
Total number of acquisitions made during the year
Total combined size of all acquisitions made during the year
List of divestments made during the year and their financial attributes
Total number of divestments made during the year
Total combined size of all divestments made during the year
Using this data, did eight major analyses
Good-to-great companies: pre- and posttransition
Good-to-great companies vs. comparison companies: pre- and posttransition
Unsustained transition companies: pre- and posttransition
Summary pre- and postdecade analysis: good-to-great companies vs. direct comparisons vs. unsustained comparisons
Good-to-great companies: transition date to present
Good-to-great companies vs. comparison companies: transition date to 1998
Unsustained comparisons: transition date to 1998 (same analysis as for good-to-great companies transition to 1998)
Summary, transition date to 1998: good-to great companies vs. direct comparisons vs. unsustained comparisons
In addition, analysis looked at the qualitative aspects, examining questions such as
Overall strategy of acquisitions
Overall strategy of integrating acquisitions
Ultimate success of each major acquisition
Ultimate success of overall acquisition strategy
Industry Performance Analysis
Purpose was to determine whether the companies were in highly attractive industries at the time of the transition
Created spreadsheets that quantified each industry versus the company to determine the relationship between the two
Procedure
For each good-to-great company, determine all industries that are listed in the S&P Analyst’s Handbook from the year of transition to 1995
For each of these industries, use the total returns from the transition year of the corresponding company to 1995 to determine the percentage change in total returns for a period from the transition year to 1995
Rank the industries according to their percentage returns over this period
Executive Churn Analysis
Using Moody’s Company Information Reports, calculated churn in the good-to-great companies vs. comparison companies
Average percent of departures over pretransition decade
Average percent of departures over posttransition decade
Average percent of additions over pretransition decade
Average percent of additions over posttransition decade
Average total churn percentage over pretransition decade
Average total churn percentage over posttransition decade
Same analyses repeated out to 1998
Objectives
What is the quantitative difference in executive churn and/or continuity, if any, between the pretransition and posttransition eras for the good-to-great companies?
How do the good-to-great companies differ in executive churn and/or continuity from the direct comparisons?
How do the good-to-great companies differ in executive churn and/or continuity from the unsustained comaprisons?
CEO Analysis
Factors examined
Management style
Executive persona
Personal life
What they saw as their top five priorities as CEO
For each of the 28 companies, examined the CEO background and tenure beginning with CEOs in place ten years prior to the transition year through 1997; determined:
Whether the CEO was brought in from the outside directly into the role of CEO
Number of years of employment with the company prior to becoming CEO
Age at the time of becoming CEO
Start year and end year of tenure in CEO role
Number of years CEO position was held
Responsibility held immediately prior to becoming CEO
Factors in selection of that person as CEO (why picked as CEO)
Education (especially study areas and degrees held)
Work experience and other experiences (e.g., military) prior to joining the company
Executive Compensation
Analyses included
Total of all officers’ and directors’ salary + bonus as a percent of net worth at transition year
CEO’s total cash compensation as a percent of net work at transition year
CEO’s salary + bonus as a percent of net wroth at transition year
Difference between CEO’s salary + bonus average of top four executives’ salary + bonus as a percent of net worth at transition year and at transition year plus 10 years
Objectives
What is the quantitative difference in executive compensation, if any, between the pretransition and posttransition era for the good-to-great companies?
How do the good-to-great companies differ in executive compensation from the direct comparisons?
How do the good-to-great companies differ in executive compensation from the unsustained comparisons
Role of Layoffs
Examined
Total employment head count year by year, from ten years prior to transition through 1998
Evidence of layoffs as a significant tactic in an attempt to improve company performance during the ten years prior and ten years after the date of transition
If layoffs did occur, then calculate the number of people laid off, nominally and as a percent of the total workforce
Corporate Ownership Analysis
Looked at
The presence of large-block shareholders and groups
The extent of board ownership
The extent of executive ownership
Media Hype Analysis
For the period ten years before to ten years after the transition date for each of the companies, looked at
Total number of articles in the pre- and posttransition decades and for the two decades combined
Total number of “feature” articles on the company in the pre- and posttransition decades and for the two decades combined
Total number of the above articles that explicitly talk about a “transition,” “rebound,” “turnaround,” “transformation,” under way at the company in the pre- and posttransition decades and for the two decades combined
Total number of “highly positive” articles, total number of “neutral” articles (from slightly negative to slightly positive), and total number of “highly negative” articles in the pre- and posttransition decades and for the two decades combined
Technology Analysis
Examined
Pioneering applications of technology
Timing of technology
Criteria for selection and use of specific technologies
Role of technology in decline of comparison companies