Download to read offline


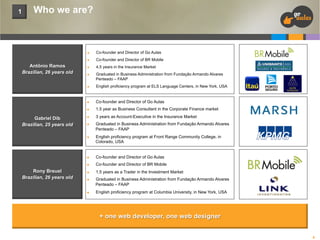
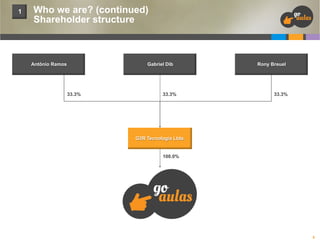
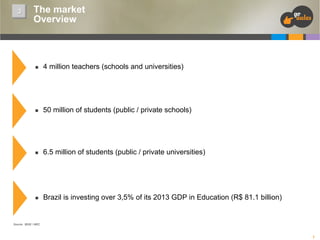
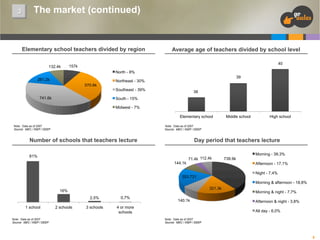

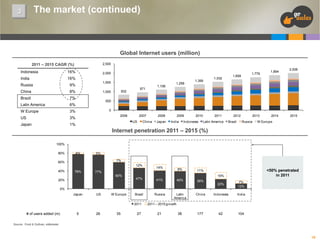
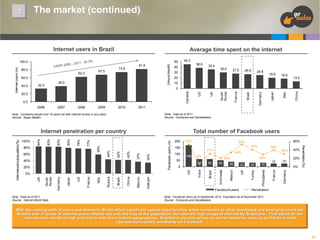


The document introduces Go Aulas, a new social network connecting users seeking private teachers for classes. It summarizes the founders' backgrounds and experience, outlines Go Aulas' mission to unite teachers and students through an innovative online platform. The document also analyzes Brazil's education market and growing internet usage, and presents Go Aulas' business model, financial projections, and request for $200,000 investment to fund initial marketing, team hiring, and office setup.