Download to read offline


![0%
25%
50%
75%
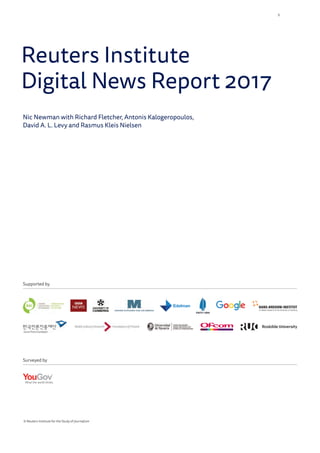
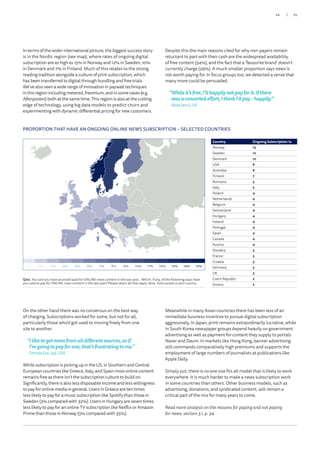
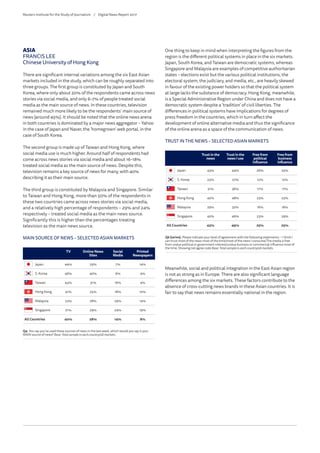
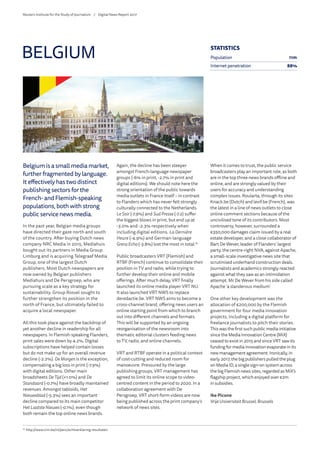
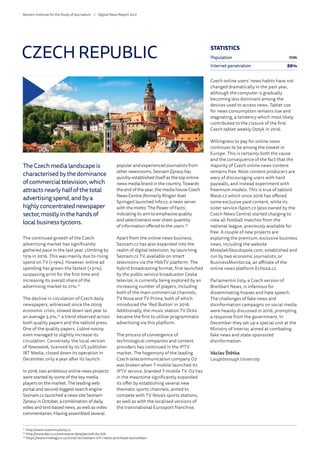
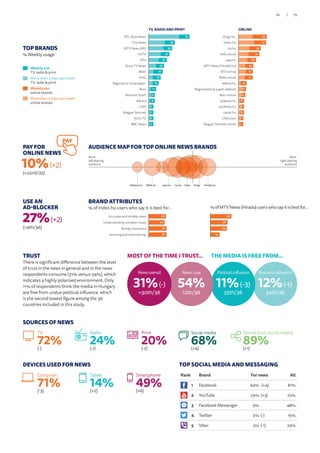
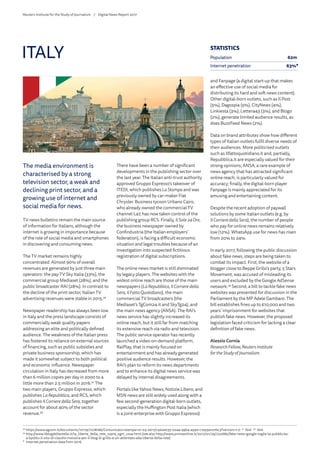
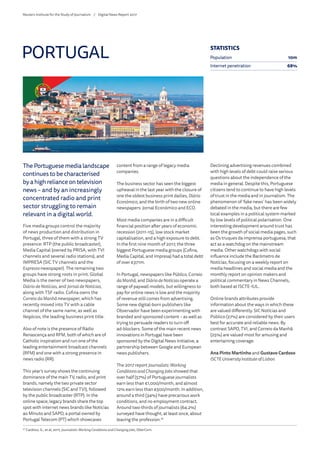
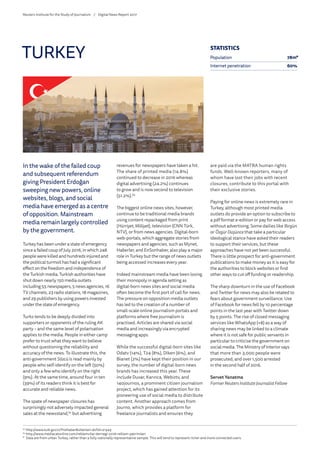
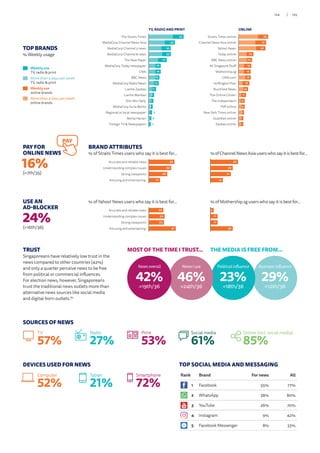
62 60 58
53 51 51 50 50 49 49 49 48 47 46 46 45 43 43 42 42 42 42 40 39 39 39 39 38
32 31 31 30 29 27
23 23
KORGRESVKMYSFRATWNHUNCZEUSACROROUITAARGTURSGPAUSHKSWEJPNUKAUTIRESUICHLBELMEXNORCANDENGERSPANLDPOLPORBRAFIN
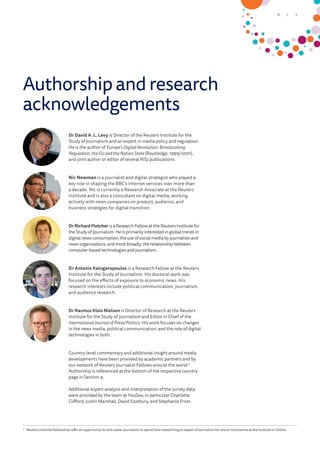
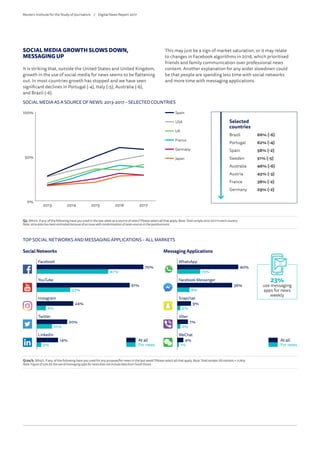
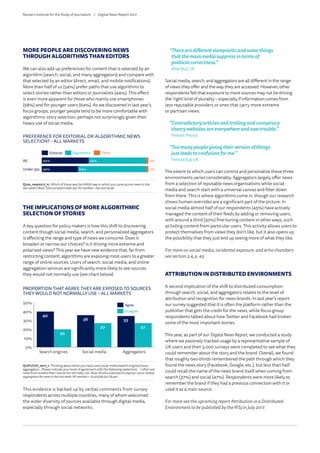
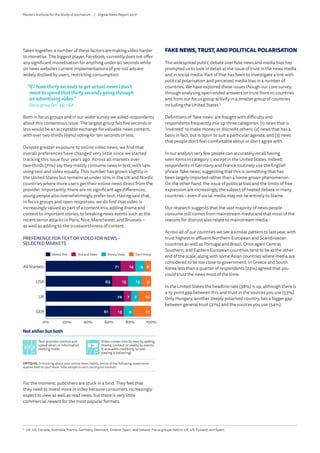
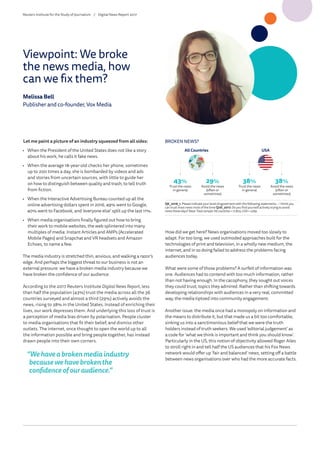
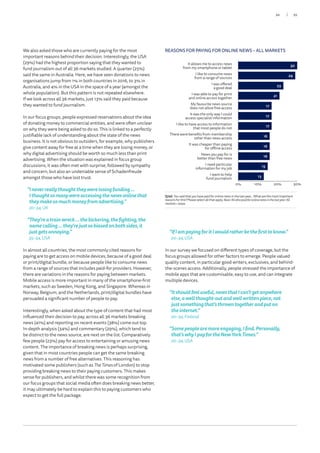
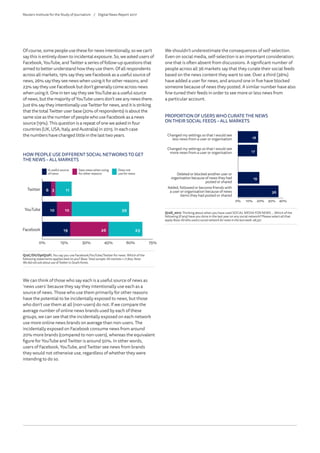
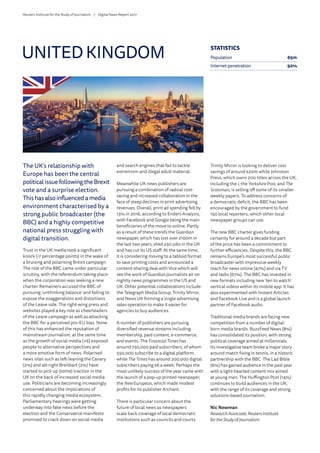
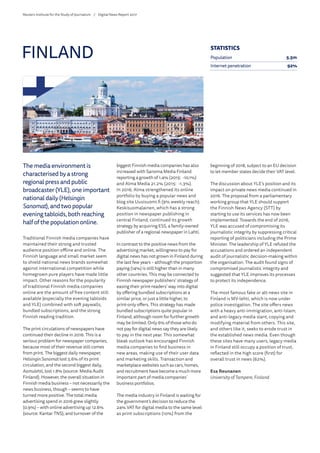
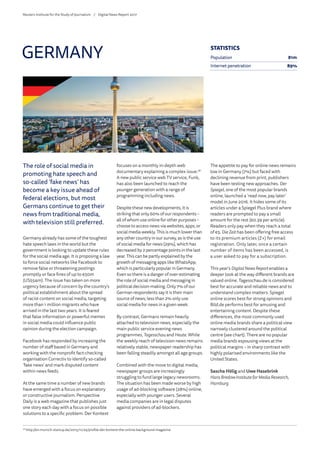
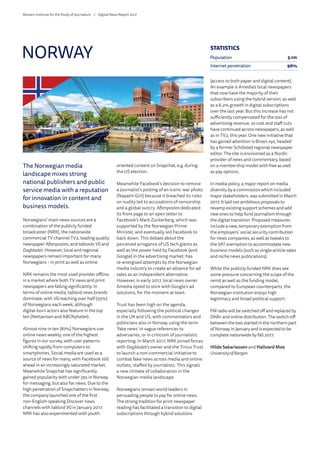
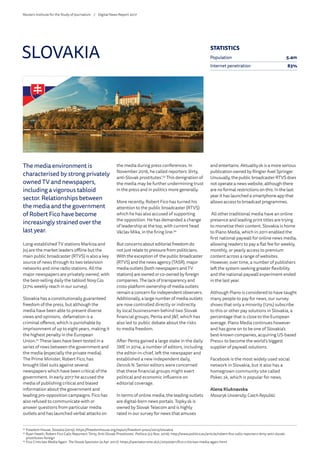
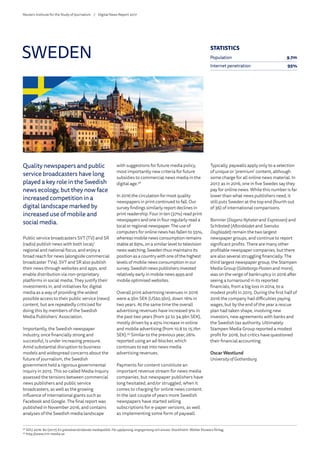
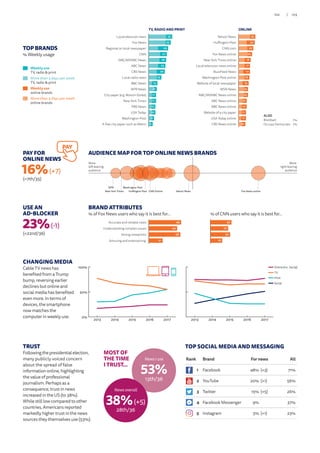
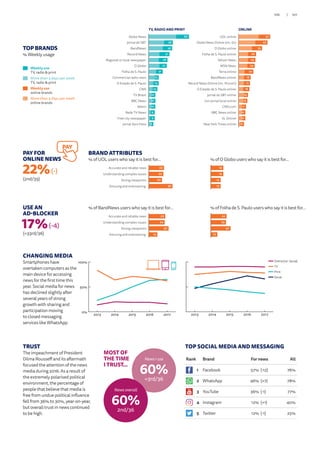
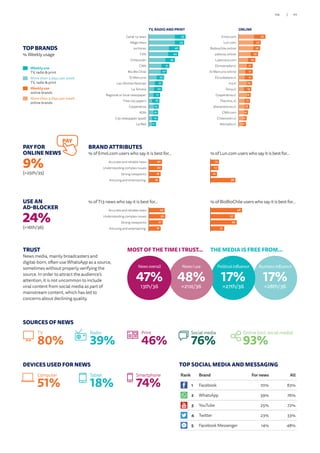
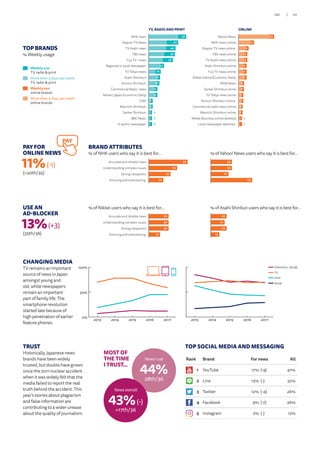
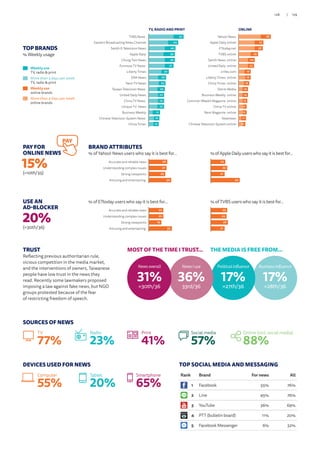
OVERALL TRUST IN NEWS MEDIA – ALL MARKETS
Q6_2016_1/6. Please indicate your level of agreement with the following statements. - I think you can trust most news most of the time/I think I can trust most of the news I consume most of the
time Base:Totalsampleineachmarket.
UK
Trust down 7
percentage
points
USA
53% trust
sources
they use
Hungary
54% trust
sources
they use
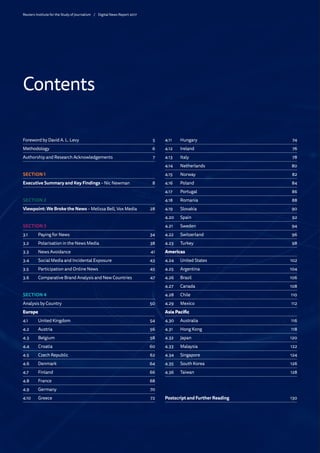
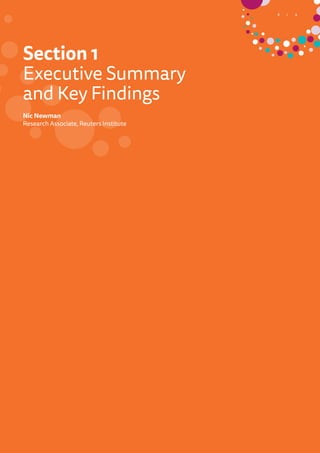
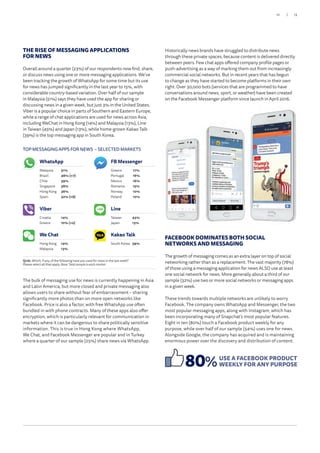
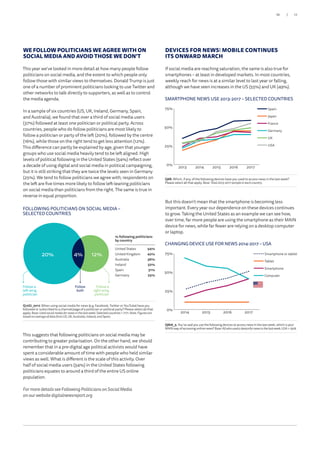
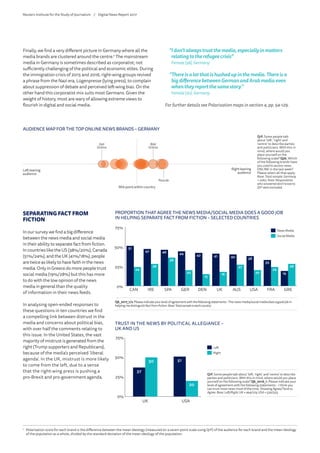
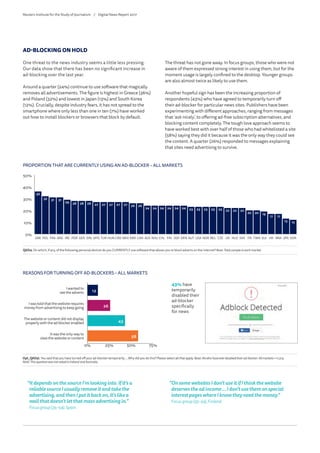
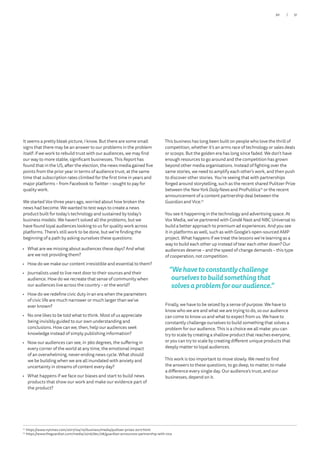
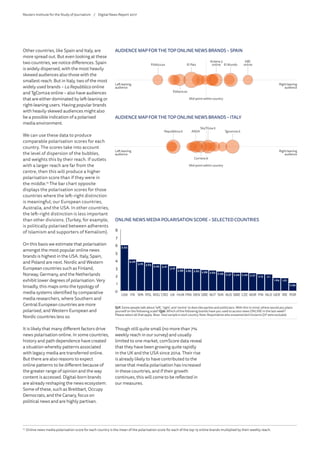
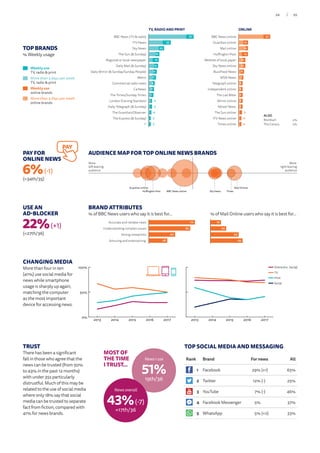
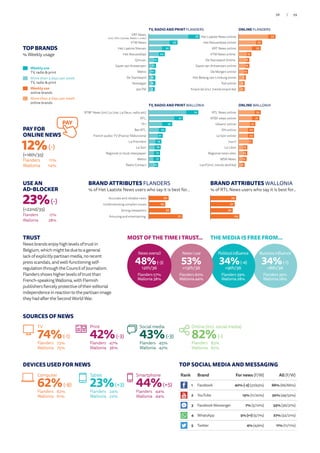
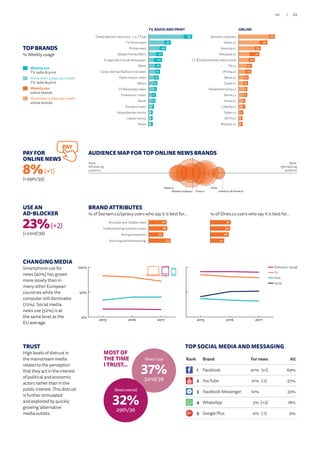
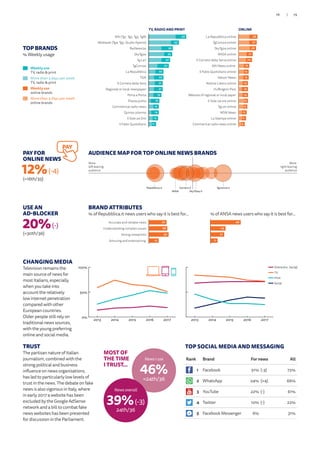
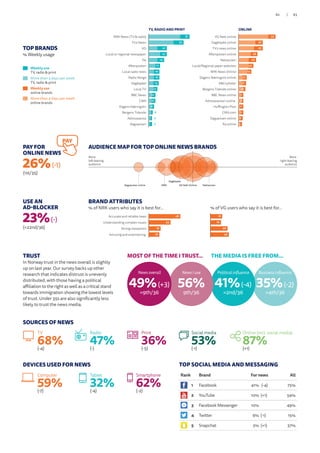
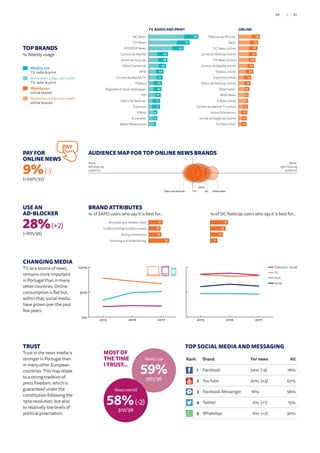
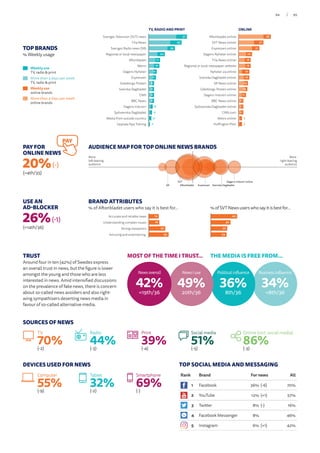
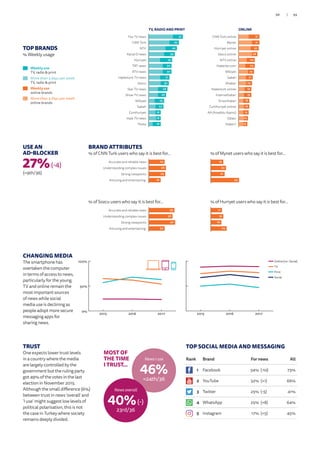
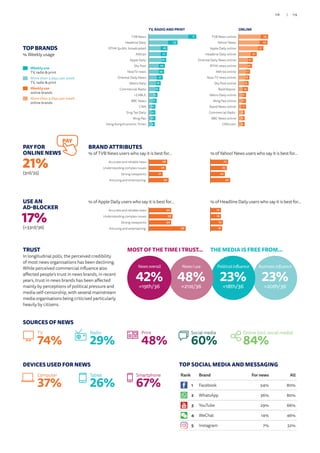
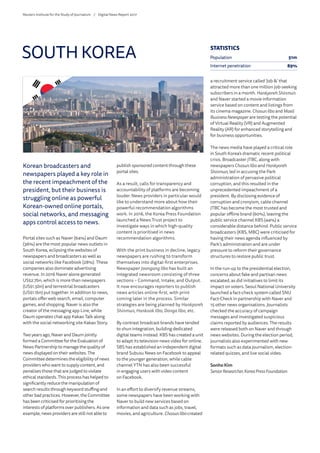
To understand more about polarisation, we have mapped
respondents’ political beliefs on a left–right spectrum and
combined this with the sources of online news they use. The
mid-point represents the mid-point of political opinion of our
respondents; in the country in question the size of each bubble
represents volume of consumption for each brand.6
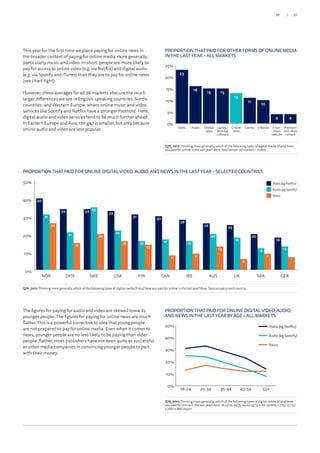
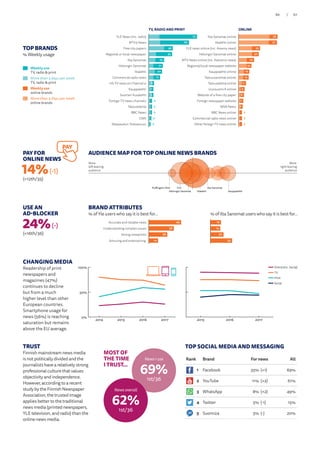
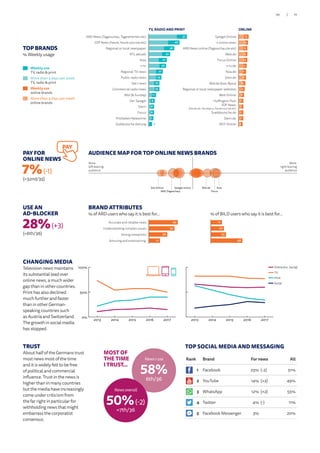
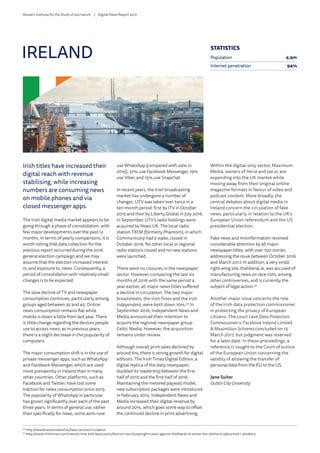
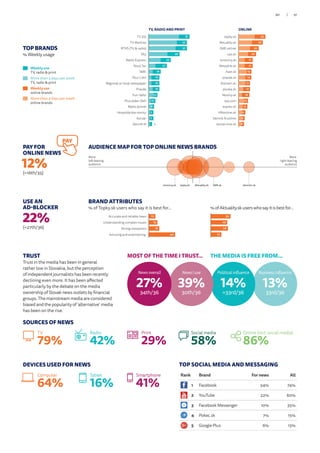
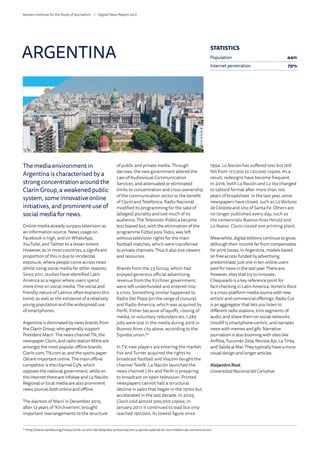
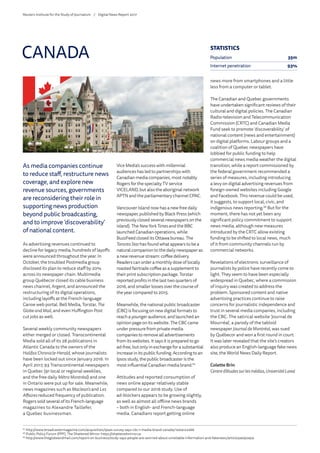
The resulting map for the United States (see below) shows a deeply
polarised media landscape, which reflects an equally polarised
society. The websites of TV networks like ABC, NBC, and CBC are
used far more by people who self-identify as left-wing, along with
the NewYorkTimes and WashingtonPost. By contrast the Fox News
and Breitbart websites are mostly used by people with right-wing
views. Arguably the gap on the right of this map has provided space
for a range of hyper-partisan right-wing sites to emerge over the last
few years. The map shows just online sites, but we should remember
that polarisation also exists in the print and TV markets. Two-thirds
of right-wingers watch the Fox News TV channel but only 11% of
those who identify on the left. The hyper-partisan websites are even
more split, with 19% of those on the right using Breitbart.com but
only 2% on the left.
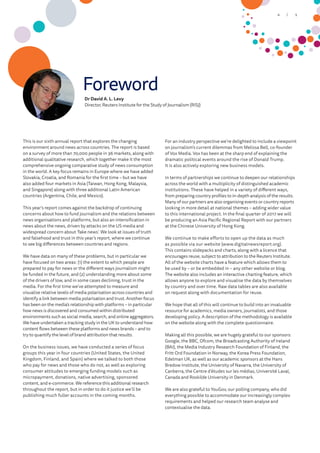
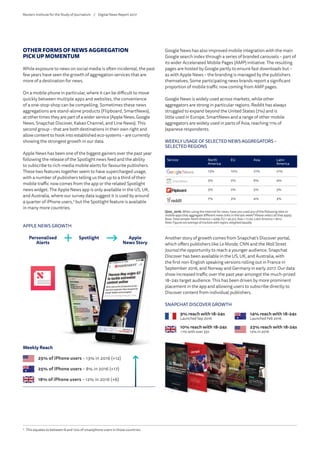
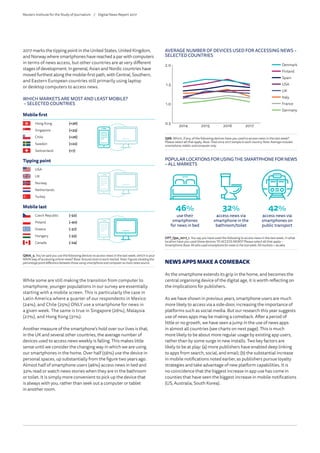
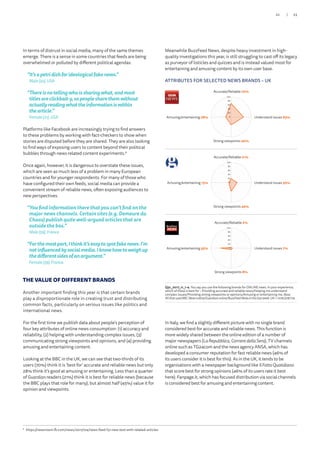
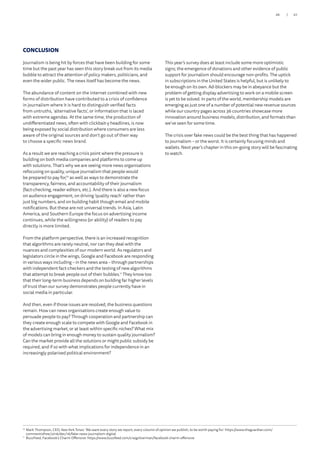
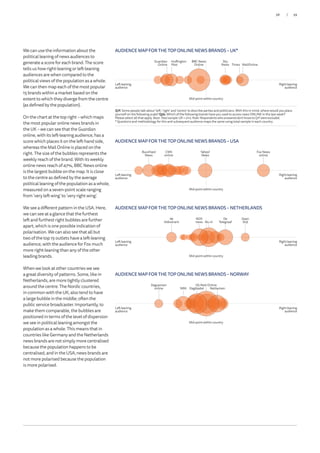
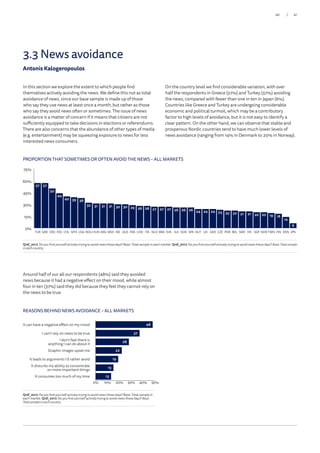
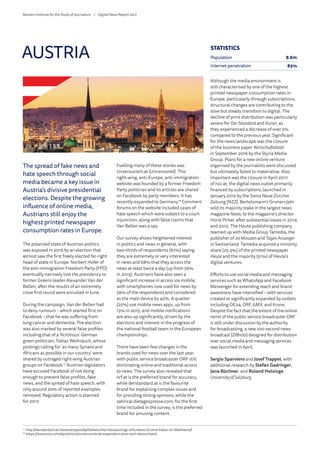
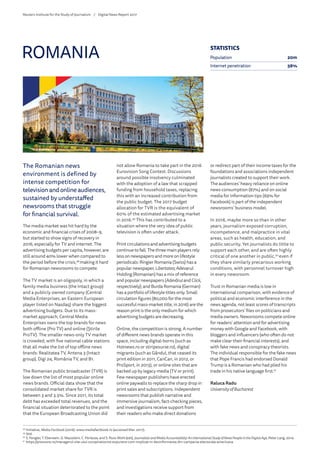
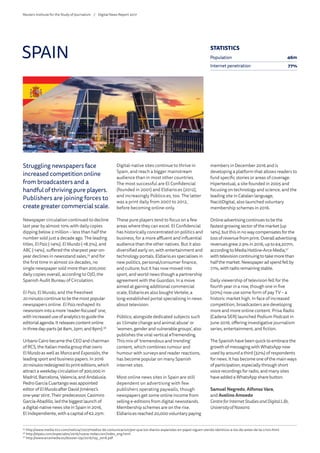
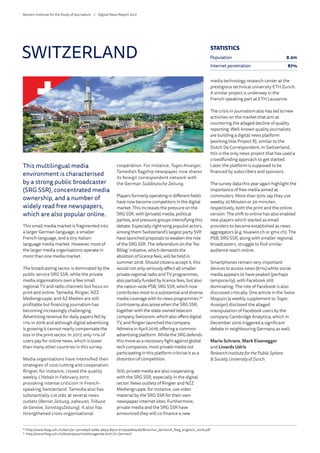
We can compare the US media and audience landscape with two
very different European countries. The UK online map uses the
same scale but shows less polarisation amongst the top online
sources. A third of those who self-identify on the right read the
Mail Online, 14% in the centre, and 8% on the left. There are a few
hyper-partisan sites (Breitbart and the Canary) but they attract
much smaller audiences than in the United States. The BBC, which
sits in the centre of our chart, is used relatively equally by those
on the left, centre, and the right and provides a common set of
facts with a combined online/offline weekly reach of 77%. Having
said that, the polarising Brexit debate has increased distrust in
the mainstream media generally from those on both ends of the
debate, with the BBC particularly under fire.
“IusedtotrustandvaluetheBBCnewsbutnow
it’sjustamouthpiecefortheliberalleftists.”
Male(52),UK
“EventheBBCtendstosupport[a]
farrightwingedpartynowadays.”
Female(54),UK
AUDIENCE MAP FOR THE TOP ONLINE NEWS BRANDS (INCLUDING NEW POLARISED NEWS BRANDS) – USA
Q1F. Some people talk
about ‘left’, ‘right’ and
‘centre’ to describe parties
and politicians. With this in
mind, where would you
place yourself on the
following scale? Q5b. Which
of the following brands have
you used to access news
ONLINE in the last week?
Please select all that apply.
Base: Total sample: USA =
2269. Note: Respondents who
answered don’t know
to Q1F were excluded.
Left leaning
audience
Right leaning
audience
Mid-point within country
Fox
News
Yahoo!
News
The so called
‘liberal media’
REUTERS INSTITUTE FOR THE STUDY OF JOURNALISM
Slide 48
AUDIENCE MAP FOR THE TOP ONLINE NEWS BRANDS (INCLUDING NEW POLARISED NEWS BRANDS) – UK
Q1F. Some people talk
about ‘left’, ‘right’ and
‘centre’ to describe parties
and politicians. With this in
mind, where would you
place yourself on the
following scale? Q5b. Which
of the following brands have
you used to access news
ONLINE in the last week?
Please select all that apply.
Base: Total sample: UK = 2112.
Note: Respondents who
answered don’t know to Q1F
were excluded.
Left leaning
audience
Right leaning
audience
Mid-point within country
MailOnline
BBC News
Online
Guardian
Online
The Canary
REUTERS INSTITUTE FOR THE STUDY OF JOURNALISM
Slide 49
6
Polarisation score for each brand is the difference between the mean ideology (measured on a seven-point scale using Q1F) of the audience for each brand and the mean ideology
of the population as a whole, expressed in multiples of the standard deviation the mean ideology of the population as a whole.
21/20](https://image.slidesharecdn.com/digitalnewsreport2017web0-170623151741/85/Digital-news-report-2017-21-320.jpg)


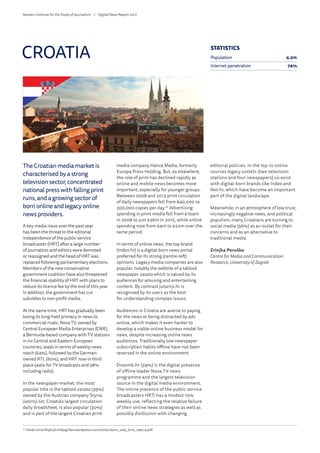
![We asked our focus groups why they are more willing to pay for
digital audio and video. People felt that they simply offer a different
experience to news; one that is entertaining, relaxing, or enjoyable.
Also, there was a recognition that (unlike news) the content retains
its value over time, and isn’t accompanied by a sense of waste if
not used every day. Moreover, there was a clearer sense that the
companies that provide this service offer something both valuable
and unique, and are associated with innovative approaches and new
ideas. Crucially, the focus groups also identified that many of these
services are built on aggregating content from multiple sources.
Viewed in this way, asking people to pay for online news from a
single provider could feel strikingly old-fashioned and out of sync
with the experience of multiplicity and choice that people have
come to expect from the web.
[Q:]Subscriptions,subscribingtonews?
[A:]Toonlyonemediaoutlet,no.
25–34,Spain
“Whatyoucoulddois…ifyouwantthepolitics
subscriptionyoucanpay£5amonthandyoucanhave
allthepoliticsyoucanread,orthesciencesubscription
…likeNowTVhasgottheentertainmentbundle.”
25–34,UK
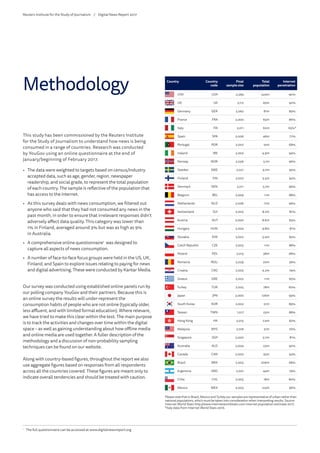
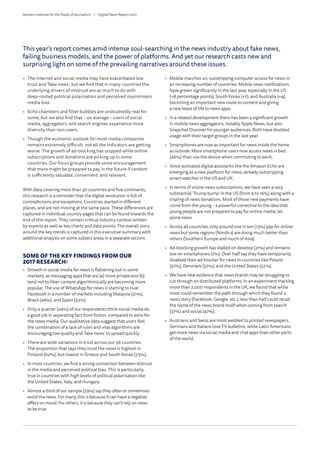
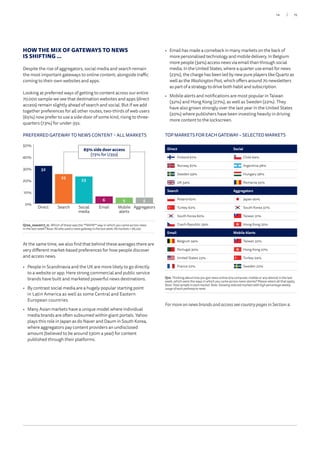
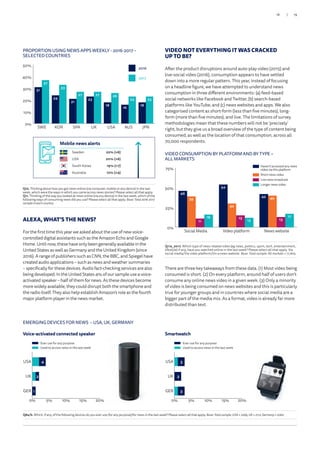
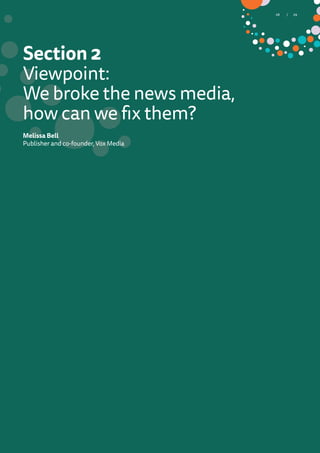
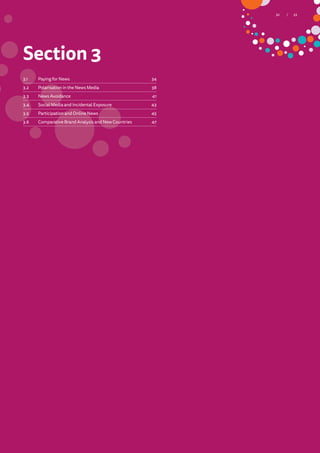
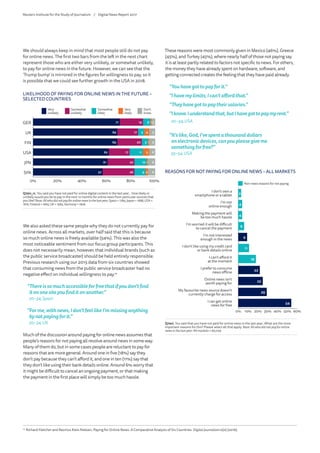
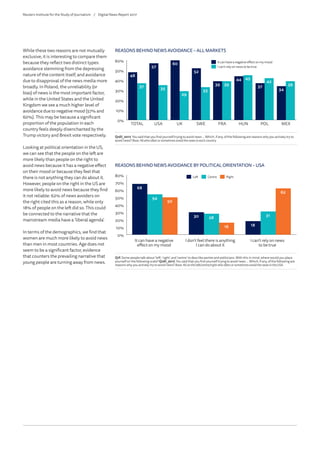
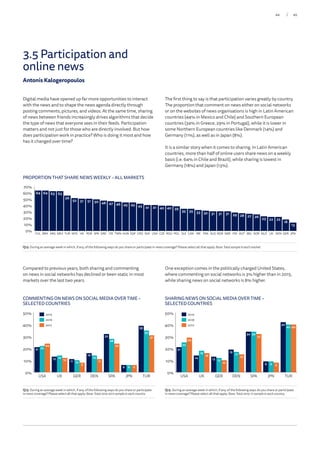
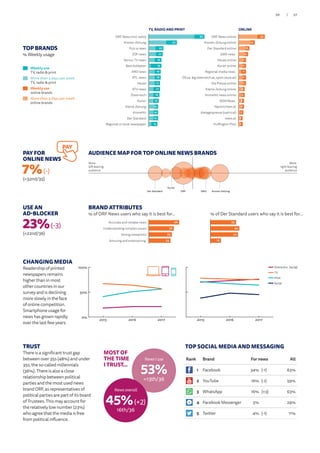
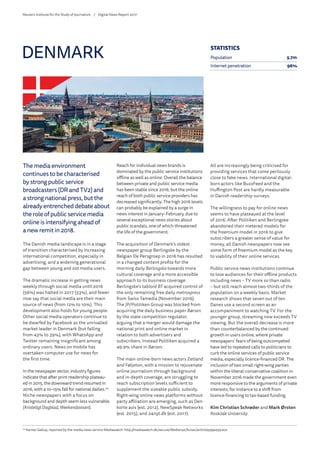
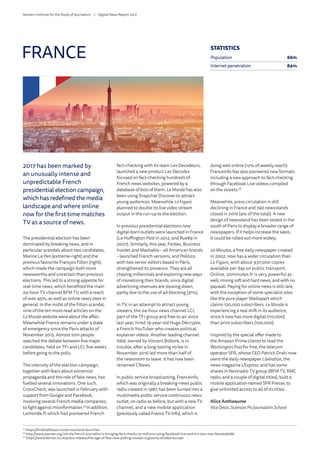
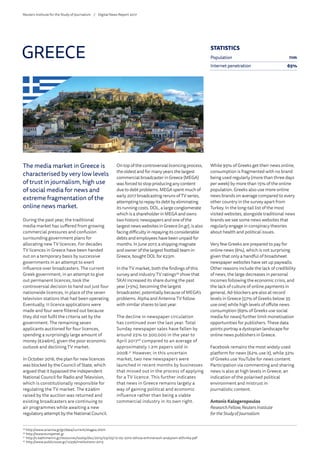
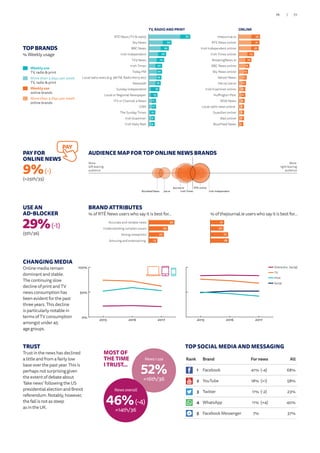
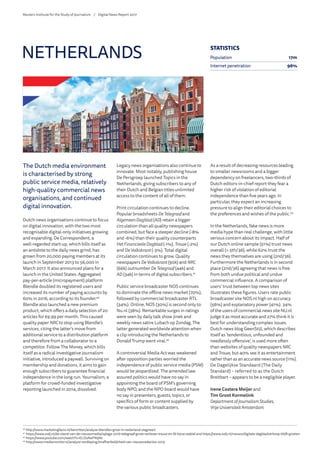
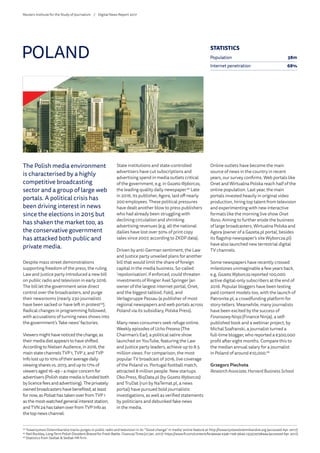
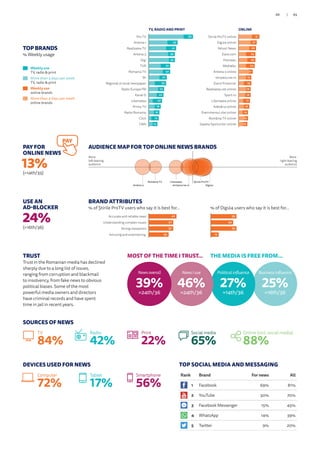
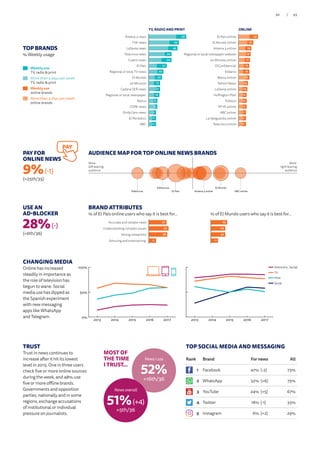
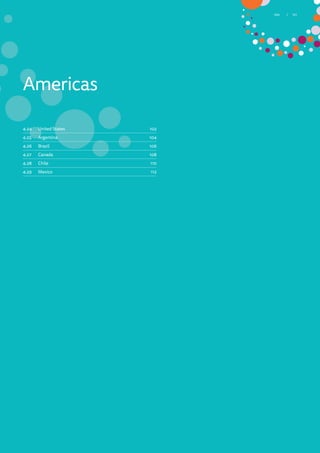
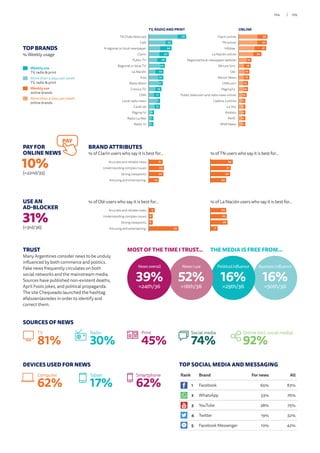
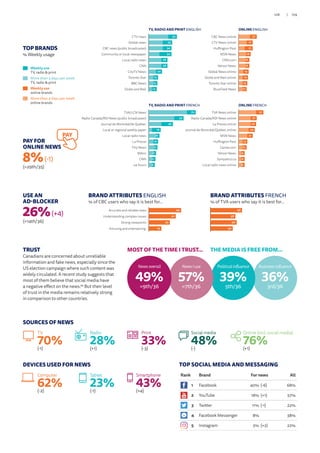
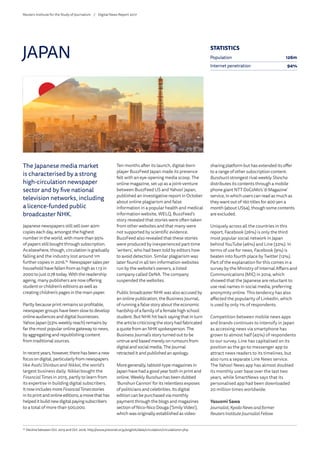
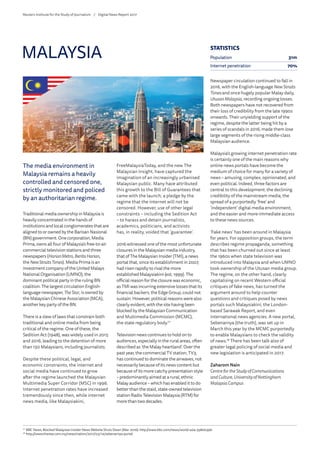
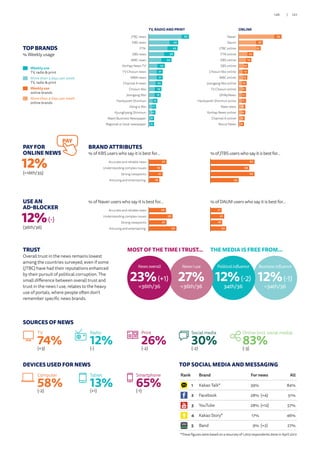
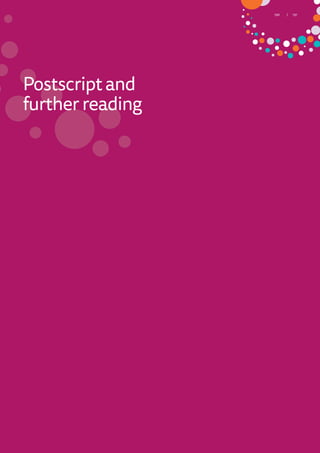
Despite the differences, people who pay for other media online
(such as audio and video) are either much more likely to be paying
for online news already, or are much more willing to pay in the
future. The link is particularly strong in Spain and the USA, where
people are five times more likely to be paying for online news if
they are paying for other things (when compared to people who
have not purchased any online media in the past year). Importantly,
this association is present in all of the 36 markets examined, and
remains even after controlling for age, gender, education, and
interest in news.
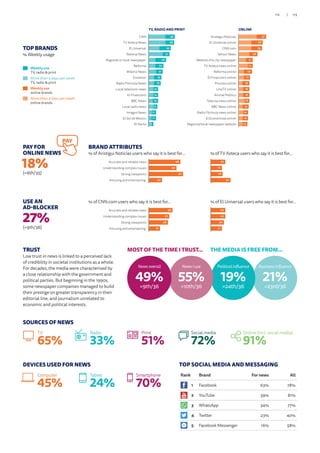
PAYING FOR NEWS MORE COMMON AMONGST PEOPLE WHO
PAY FOR DIGITAL AUDIO, VIDEO, AND OTHER ONLINE MEDIA –
SELECTED COUNTRIES
Q7b_2017. Which of the following types of digital media (if any) have you paid for online in the
last year? Q7a. Have you paid for ONLINE news content, or accessed a paid for ONLINE news
service in the last year? (This could be a digital subscription, combined digital/print subscription
or one off payment for an article or app or e-edition) Base:Doesnot/paysforotheronlinemedia:
USA =1034/1226,Finland=1004/1003,Spain= 1125/881,UK= 1168/944
0%
5%
10%
15%
20%
25%
30%
5
7
3 3
25
21
17
9
Does not pay for other online media
Pays for other online media
UKSPAFINUSA
Pays for other online media
Does not pay for other online media
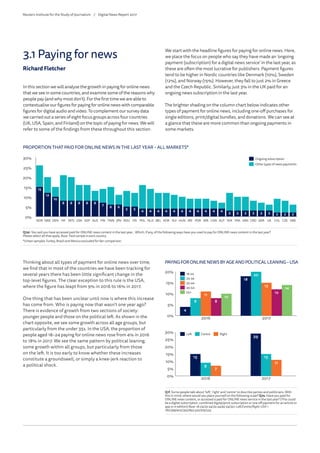
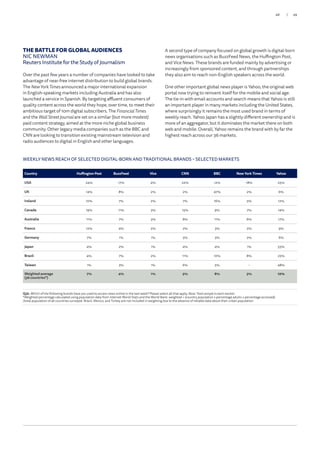
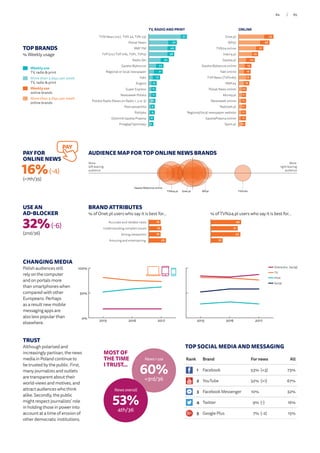
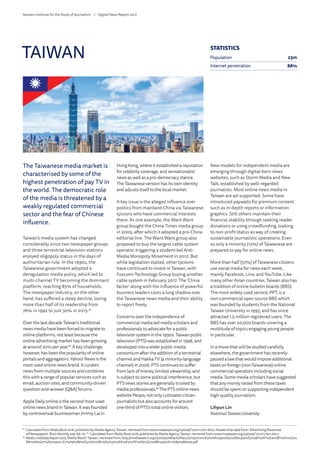
We now have some preliminary evidence to suggest that polarisation
is increasing in some countries, but also that there is large national
variation in the degree to which the audiences for the most
popular news brands are polarised along the left–right spectrum.
In this section we will take a more in-depth look at news media
polarisation. We will explain how our measures are computed,
before exploring some of the differences we see across countries.
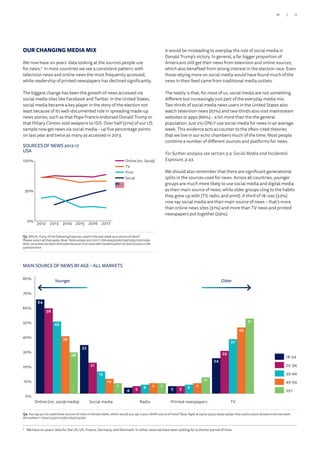
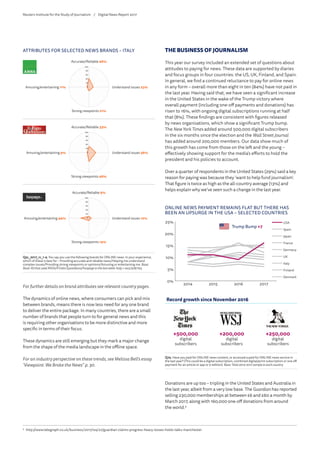
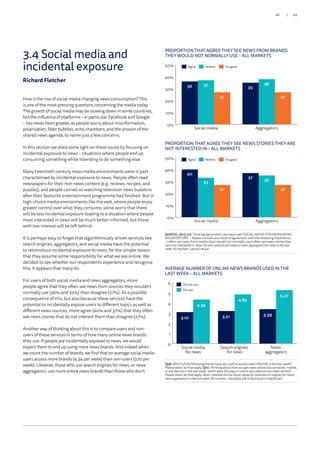
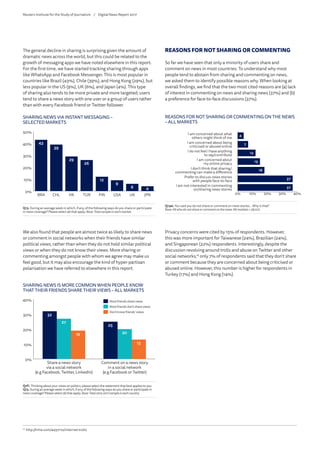
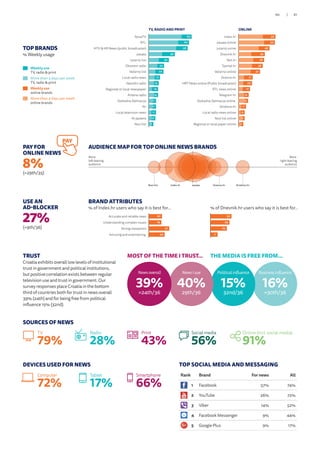
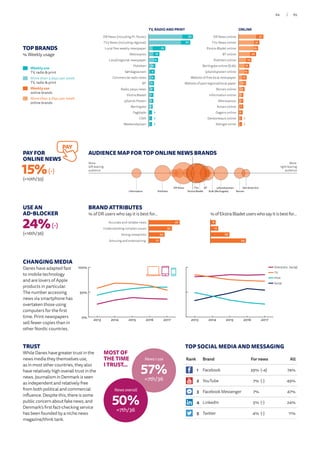
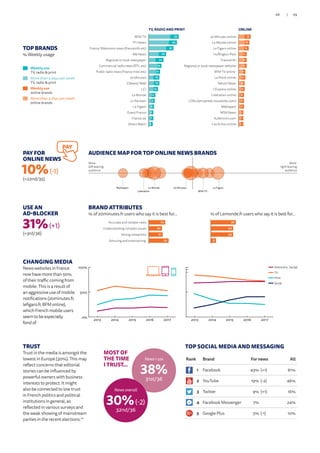
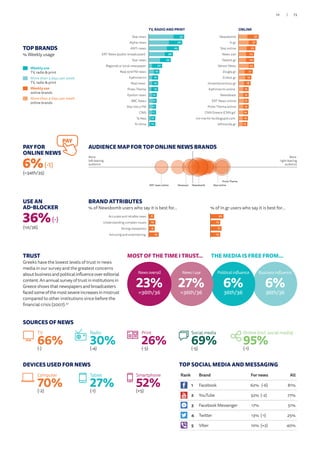
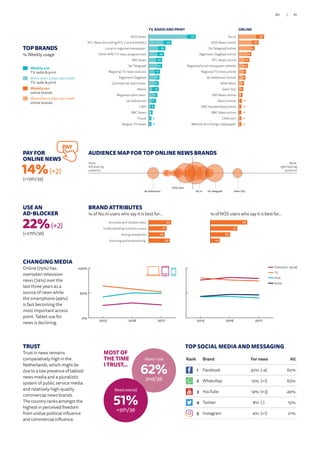
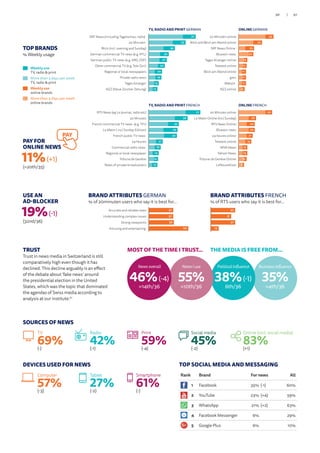
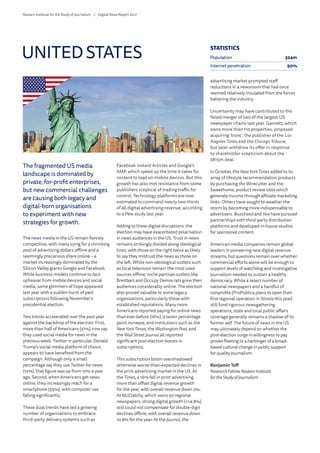
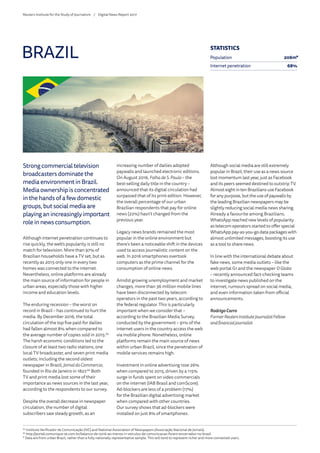
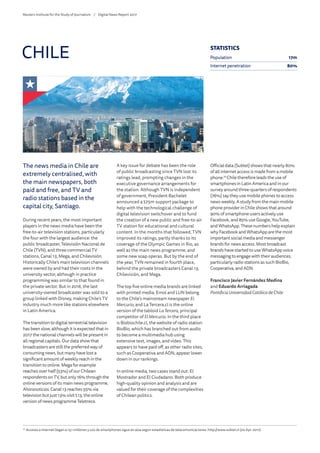
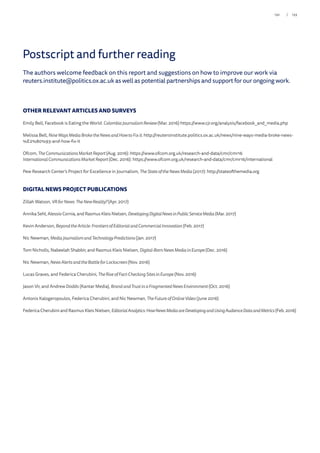
In the UK, the audience for the Guardian is made up of far more
people on the left than on the right, but the opposite is true of the
Mail Online. Sky News online has around 20% from both camps.
In the USA, we can similarly see that the online audience for the
NewYork Times is left-leaning, but that for Fox News online is right-
leaning. Yahoo, which aggregates news from a number of different
sources as well as authoring its own content, is evenly split.
POLITICAL BREAKDOWN OF NEWS AUDIENCES FOR SELECTED
BRANDS – UK AND USA
Q5b. Which of the following brands have you used to access news ONLINE in the last week?
Please select all that apply. Q1f. Some people talk about ‘left’, ‘right’, and ‘centre’ to describe
parties and politicians. With this in mind, where would you place yourself on the following
scale? Base:AllwhousedGuardianonline/SkyNewsonline/MailOnline/NewYorkTimes online/
Yahoo!News/FoxNewsonlineinthelastweek:UK=364/162/255,USA=403/495/447.Note:
Respondentswhoanswereddon’tknowtoQ1Fwereexcluded.
0%
10%
20%
30%
40%
50%
12
19
30
43
18
13
Mail OnlineSky News onlineGuardian online
Left-wing
Right-wing
0%
10%
20%
30%
40%
50%
7
20
4849
23
9
Fox News onlineYahoo! NewsNew York Times online
Left-wing
Right-wing
3.2 Polarisation in
the news media
Richard Fletcher
Reuters Institute for the Study of Journalism / Digital News Report 2017](https://image.slidesharecdn.com/digitalnewsreport2017web0-170623151741/85/Digital-news-report-2017-38-320.jpg)

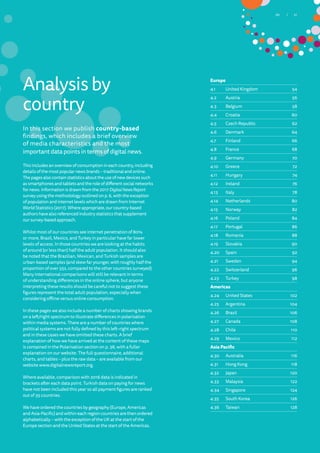


This document is the Reuters Institute Digital News Report 2017, which analyzes data from surveys of over 70,000 people in 36 countries on their news consumption habits. Some of the key topics examined in the report include paying for news, polarization in the news media, news avoidance, the role of social media in news discovery and incidental exposure, participation with online news, and comparative brand analysis of news organizations across different countries. The report also includes in-depth analyses of digital news consumption trends in each surveyed country.


![[Feb 2020] - India @ 2030 - Mohandas Pai](https://cdn.slidesharecdn.com/ss_thumbnails/3one4capitalindia2030-mohandaspaifeb2020-200722145520-thumbnail.jpg?width=640&height=640&fit=bounds)


![Reuters institute Digital News Report 2015 [full report]](https://cdn.slidesharecdn.com/ss_thumbnails/reutersinstitutedigitalnewsreport2015fullreport-150617150758-lva1-app6892-thumbnail.jpg?width=640&height=640&fit=bounds)


![제 23회 보아즈(BOAZ) 빅데이터 컨퍼런스 - [MBOAX] : ABSA를 활용한 소비자 반응 분석 기반 운영 효율화 대시보드 설계](https://cdn.slidesharecdn.com/ss_thumbnails/3-1boaz23rdconferencemboax-260203102709-9d519923-thumbnail.jpg?width=640&height=640&fit=bounds)


![Hacking-Uncovered-How-People-Get-Hacked-and-How-to-Stay-Safe[1].pptx](https://cdn.slidesharecdn.com/ss_thumbnails/hacking-uncovered-how-people-get-hacked-and-how-to-stay-safe1-260130170011-4883a9c7-thumbnail.jpg?width=640&height=640&fit=bounds)
![7.__Developing_a_Research_Proposal[1].pptx](https://cdn.slidesharecdn.com/ss_thumbnails/7-260131073037-df92dd7d-thumbnail.jpg?width=640&height=640&fit=bounds)


