Gnuplot is a freely available command-line based interactive plotting program that was originally developed in 1986. It can plot functions, data from files, and its commands can be used in scripts. Gnuplot supports various output formats including PNG, LaTeX, and can interface with LaTeX to produce publication quality plots in documents. It allows customization of plots including labels, titles, keys and multiplot layouts.


![• To plot a sine curve open gnuplot and type
• f(x) = sin(x) # define a function
• plot f(x) # plot this function
• replot f(2*x) # plot another function
• GNUPLOT will open a window with plot.
• The curves will not look smooth.
• Fix this by increasing the sampling rate:
• set samples 200 # sampling rate
• set ytics 0.5; set mytics 5
• set xrange [-pi:pi] # x range
• set xtics ("-pi" -pi, "-pi/2" -pi/2, 0, "pi/2"
pi/2, "pi" pi)](https://image.slidesharecdn.com/gnuplot2-210329115133/85/Gnuplot-2-5-320.jpg)

![Myscript.txt
• set term wxt # s e l e c t di splay type
• set ytics 0.5 # def ine distance of labeled t i c k marks on the y−axis
• set mytics 5 # number of small t i c k marks on the y−axis
• set xrange [−p i : p i ] # set x range of the p l o t
• set xtics ( ”−p i ” −pi , ”−p i /2 ” −p i /2 ,0 , ” p i /2 ” p i /2 , ” p i ” p i )
# custom l a b e l s
• set samples 200 # increase sampling rate
• set key at −p i /8 ,0.8 i n v e r t samplen 2 # place and format key of symbols
• f ( x ) = sin ( x ) # def ine a f u n c t i o n
• plot f ( x ) t “s in ( x ) ” , f (2x ) t “ s in (2 x ) ” # p l o t two f un c t i on s
• pause −1 ” h i t ENTER to e x i t s c r i p t ” # don ’ t close gnuplot](https://image.slidesharecdn.com/gnuplot2-210329115133/85/Gnuplot-2-7-320.jpg)
![Plotting data
• Gnuplot can read data from files
• scatter plot:
plot ’tablefile1.txt’ using 1:2 with points
• line plot:
plot ’tablefile1.txt’ using 1:2 with lines
• multiple data series:
use replot or separate by commas
• set key:
plot ’tablefile1.txt’ using 1:2 title "key“
• Parametric plot
set parametric
set trange [-pi:pi]
plot sin(t),cos(t)
unset parametric
( In the parametric mode, the variable is “t”)](https://image.slidesharecdn.com/gnuplot2-210329115133/85/Gnuplot-2-8-320.jpg)
![Labels, arrows, keys
• place or hide key
set key top center, set nokey
• set a title
set title "the title"
• define axis labels
set xlabel "x [pc]", set ylabel "y [pc]"
• change the number format
set format x "%10.3f"
• plot an arrow
set arrow from 0.5,0 to 0.5,1
• define a label
set label "rarefaction wave" at 0.5,0
• set border style
set border lw 3](https://image.slidesharecdn.com/gnuplot2-210329115133/85/Gnuplot-2-9-320.jpg)
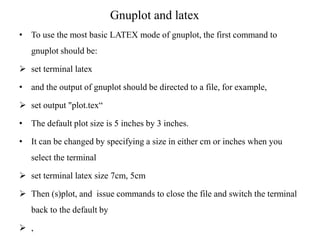
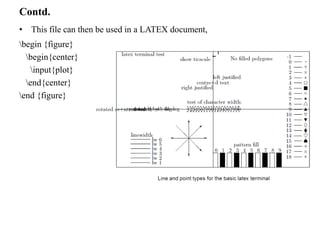
![Contd.
• set output
• set terminal wxt
• Finally, the file will contain all of the plots specified (probably want one
plot per file).
set terminal latex
set output "eg4.tex"
set format y "$%g$"
set format x "$%.2f$"
set title 'This is $sin(x)$'
set xlabel "This is the $x$ axis"
set ylabel "$sin(x)$"
unset key
set xtics -pi, pi/4
plot [-pi:pi] [-1:1] sin(x)](https://image.slidesharecdn.com/gnuplot2-210329115133/85/Gnuplot-2-14-320.jpg)
![Use with EEPIC
• EEPIC is a macro package extending the picture environment of LATEX.
• with EPIC or EEPIC macros, one can save LATEX memory.
• With EEPIC pictures, the plot.tex file will be smaller, LATEX will run
much faster (and need much less memory),
• the dvi file will be smaller.
• The quality of the output is about the same.
• To use EEPIC, set gnuplot's terminal type to eepic instead of latex, and use
gnuplot as before.
• The line styles will change.
• Include the file plot.tex in your document as before, along with the
document style
• options [epic,eepic].](https://image.slidesharecdn.com/gnuplot2-210329115133/85/Gnuplot-2-16-320.jpg)