2
Acknowledges
This set oflecture notes has been adapted from
materials originally provided by Dr. Gan Hong Seng and
Christopher M. Bishop's lecture notes.
3.
3
Course Outline
• Whatit is GMM?
• The concept of Mixture of Gaussians
• EM algorithm & Latent Variables l,
4.
4
What is GaussianMixture Model?
• Probabilistic Model used for clustering and classification tasks.
• Assumption: data is generated by a mixture of several Gaussian
distributions, each with its own mean and variance.
• Application: by fitting a GMM to the data:
• Identify underlying clusters.
• Make predictions on new data points through probabilistic
assignments to each cluster..
• What is Gaussian Mixture Model
5.
5
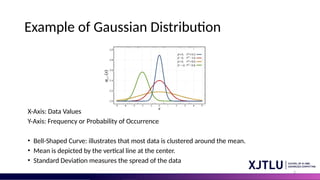
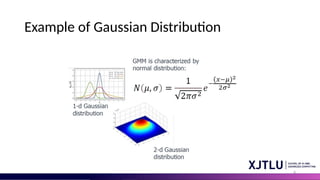
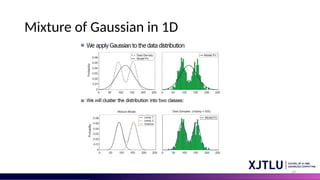
Example of GaussianDistribution
X-Axis: Data Values
Y-Axis: Frequency or Probability of Occurrence
• Bell-Shaped Curve: illustrates that most data is clustered around the mean.
• Mean is depicted by the vertical line at the center.
• Standard Deviation measures the spread of the data
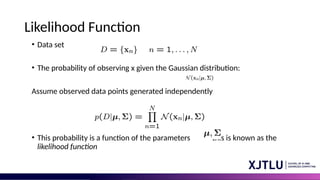
Likelihood Function
• Dataset
• The probability of observing x given the Gaussian distribution:
Assume observed data points generated independently
• This probability is a function of the parameters this is known as the
likelihood function
9.
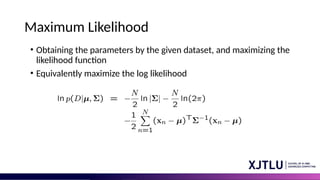
Maximum Likelihood
• Obtainingthe parameters by the given dataset, and maximizing the
likelihood function
• Equivalently maximize the log likelihood
10.
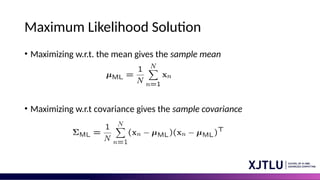
Maximum Likelihood Solution
•Maximizing w.r.t. the mean gives the sample mean
• Maximizing w.r.t covariance gives the sample covariance
11.
11
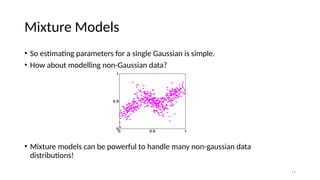
Mixture Models
• Soestimating parameters for a single Gaussian is simple.
• How about modelling non-Gaussian data?
• Mixture models can be powerful to handle many non-gaussian data
distributions!
12.
12
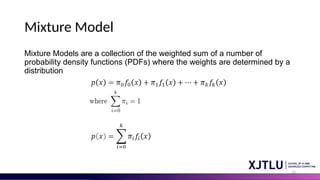
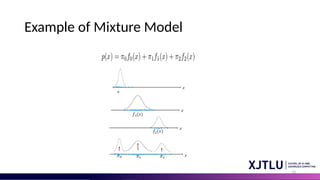
Mixture Model
Mixture Modelsare a collection of the weighted sum of a number of
probability density functions (PDFs) where the weights are determined by a
distribution
14
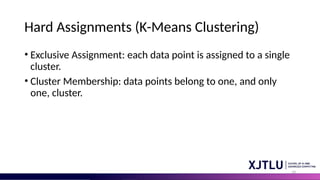
Hard Assignments (K-MeansClustering)
• Exclusive Assignment: each data point is assigned to a single
cluster.
• Cluster Membership: data points belong to one, and only
one, cluster.
15.
15
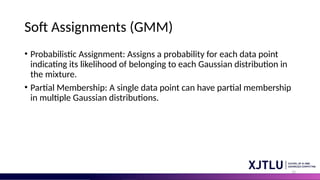
Soft Assignments (GMM)
•Probabilistic Assignment: Assigns a probability for each data point
indicating its likelihood of belonging to each Gaussian distribution in
the mixture.
• Partial Membership: A single data point can have partial membership
in multiple Gaussian distributions.
16.
16
Q&A
• When touse hard assignment and when to use soft assignment?
17.
17
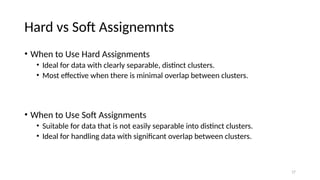
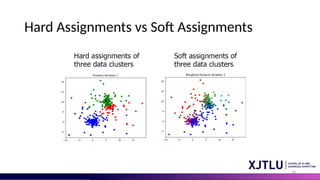
Hard vs SoftAssignemnts
• When to Use Hard Assignments
• Ideal for data with clearly separable, distinct clusters.
• Most effective when there is minimal overlap between clusters.
• When to Use Soft Assignments
• Suitable for data that is not easily separable into distinct clusters.
• Ideal for handling data with significant overlap between clusters.
20
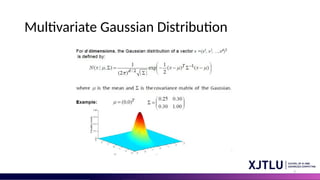
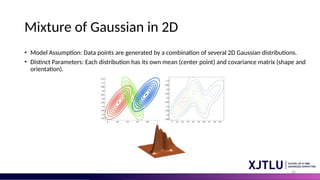
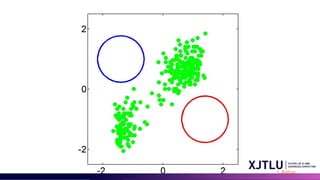
Mixture of Gaussianin 2D
• Model Assumption: Data points are generated by a combination of several 2D Gaussian distributions.
• Distinct Parameters: Each distribution has its own mean (center point) and covariance matrix (shape and
orientation).
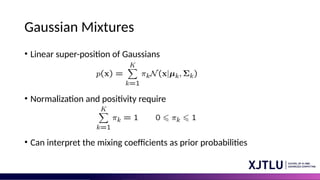
Gaussian Mixtures
• Linearsuper-position of Gaussians
• Normalization and positivity require
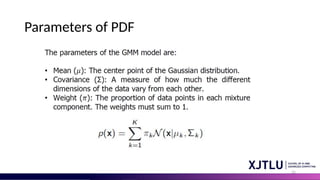
• Can interpret the mixing coefficients as prior probabilities
27.
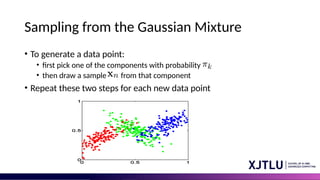
Sampling from theGaussian Mixture
• To generate a data point:
• first pick one of the components with probability
• then draw a sample from that component
• Repeat these two steps for each new data point
28.
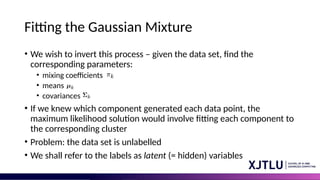
Fitting the GaussianMixture
• We wish to invert this process – given the data set, find the
corresponding parameters:
• mixing coefficients
• means
• covariances
• If we knew which component generated each data point, the
maximum likelihood solution would involve fitting each component to
the corresponding cluster
• Problem: the data set is unlabelled
• We shall refer to the labels as latent (= hidden) variables
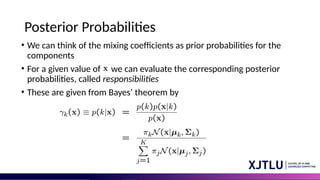
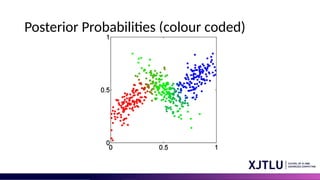
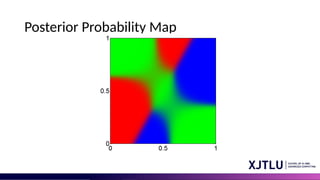
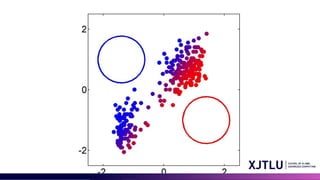
Posterior Probabilities
• Wecan think of the mixing coefficients as prior probabilities for the
components
• For a given value of we can evaluate the corresponding posterior
probabilities, called responsibilities
• These are given from Bayes’ theorem by
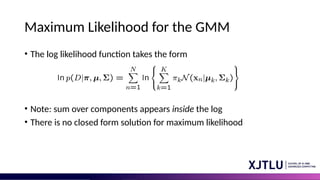
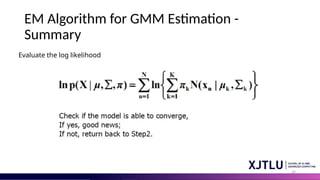
Maximum Likelihood forthe GMM
• The log likelihood function takes the form
• Note: sum over components appears inside the log
• There is no closed form solution for maximum likelihood
34.
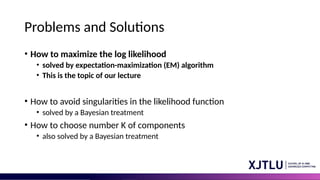
Problems and Solutions
•How to maximize the log likelihood
• solved by expectation-maximization (EM) algorithm
• This is the topic of our lecture
• How to avoid singularities in the likelihood function
• solved by a Bayesian treatment
• How to choose number K of components
• also solved by a Bayesian treatment
35.
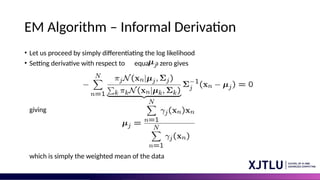
EM Algorithm –Informal Derivation
• Let us proceed by simply differentiating the log likelihood
• Setting derivative with respect to equal to zero gives
giving
which is simply the weighted mean of the data
36.
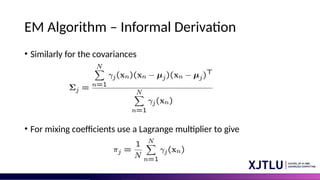
EM Algorithm –Informal Derivation
• Similarly for the covariances
• For mixing coefficients use a Lagrange multiplier to give
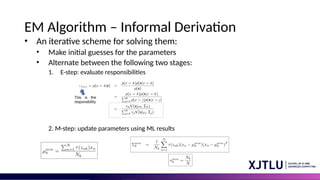
EM Algorithm –Informal Derivation
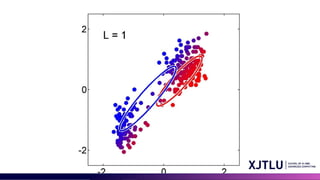
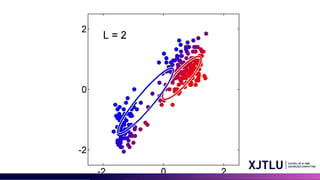
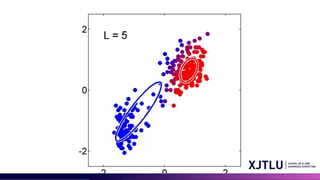
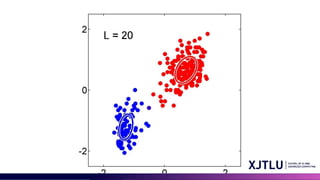
• An iterative scheme for solving them:
• Make initial guesses for the parameters
• Alternate between the following two stages:
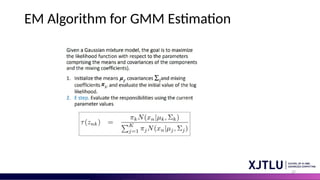
1. E-step: evaluate responsibilities
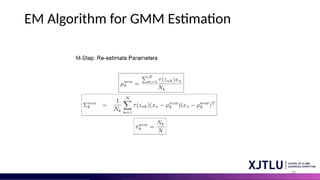
2. M-step: update parameters using ML results
47
GMM and K-MeansDifferences
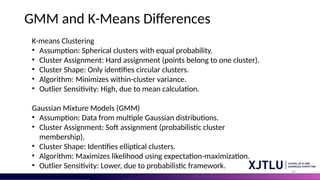
K-means Clustering
• Assumption: Spherical clusters with equal probability.
• Cluster Assignment: Hard assignment (points belong to one cluster).
• Cluster Shape: Only identifies circular clusters.
• Algorithm: Minimizes within-cluster variance.
• Outlier Sensitivity: High, due to mean calculation.
Gaussian Mixture Models (GMM)
• Assumption: Data from multiple Gaussian distributions.
• Cluster Assignment: Soft assignment (probabilistic cluster
membership).
• Cluster Shape: Identifies elliptical clusters.
• Algorithm: Maximizes likelihood using expectation-maximization.
• Outlier Sensitivity: Lower, due to probabilistic framework.
48.
48
GMM and K-MeansDifferences
Flexibility in Cluster Shapes: GMM can model elliptical and varying size clusters, not
just spherical.
Soft Clustering and Uncertainty: Provides membership probabilities, offering a
nuanced understanding of cluster belonging.
Density Estimation: GMM estimates the density distribution of each cluster, not just
central tendency.
Model Complexity: GMM captures complex cluster structures but requires more data
and computational power.
49.
49
GMM and K-MeansDifferences
Use K-means When:
• You need a fast, simple, and interpretable model.
• Your data is expected to form spherical clusters.
• Computational resources are limited.
Use GMM When:
• You suspect clusters are non-spherical or have different sizes.
• You need a measure of uncertainty in cluster assignments.
• You have enough data to estimate the additional parameters reliably.
Takeaway:
• K-means is efficient for well-separated, spherical clusters.
• GMM is more flexible, capturing complex cluster shapes and providing
probabilistic cluster assignments.
Editor's Notes
#4 In the realm of statistical analysis, the Gaussian Mixture Model (GMM) is a versatile probabilistic tool that serves both for clustering and classification tasks. It operates under the assumption that the data points are produced by a blend of multiple Gaussian distributions, each characterized by distinct parameters—mean and variance that define their centers and spreads, respectively. By applying a GMM to a dataset, we can uncover latent groupings inherent in the data, revealing the underlying structure. Furthermore, the model empowers us to make informed predictions about where new data points might belong within these clusters, not through rigid assignment but by calculating the likelihood of membership in each cluster, thereby yielding a more nuanced, probabilistic classification.
#47 K-means operates on the assumption that each cluster is spherical and all clusters are equally likely, assigning each data point to a single cluster in a 'hard' manner, meaning points are fully in one cluster or another. This algorithm seeks to make the variation within each cluster as small as possible, but it tends to be sensitive to outliers because it uses the mean of the points to determine cluster centers and can only identify circular-shaped clusters. On the other hand, GMM assumes that data points are drawn from several Gaussian distributions, which allows for 'soft' cluster assignment. This means that it assigns points to clusters based on the probability of membership, making it more flexible in accommodating elliptical cluster shapes. The GMM algorithm uses an expectation-maximization process to maximize the likelihood of the data points given the model, and it is generally less sensitive to outliers due to its probabilistic nature.
#48 In academic discourse, the Gaussian Mixture Model (GMM) is prized for its flexibility in capturing a wide variety of cluster shapes, including elliptical forms and clusters of different sizes, rather than being confined to identifying only spherical clusters as some other methods are. GMM extends beyond simple cluster assignment by providing membership probabilities for each data point, thereby offering a more sophisticated and nuanced view of how data points relate to potential clusters. This model excels in estimating the density distribution within each cluster, which provides a richer understanding than merely pinpointing the central tendency. However, the intricacy of GMM in modeling complex cluster configurations comes at a cost; it necessitates a larger dataset and more computational resources to perform effectively.
#49 Choose K-means if you're looking for a quick, straightforward method that's easy to explain and when you think your data naturally splits into neat, round groups. It's also a good pick when you don't have a lot of computing power. On the other hand, go for the Gaussian Mixture Model (GMM) when you have a hunch that your clusters aren't just simple spheres or when they come in different sizes. GMM is also helpful when you want to know how sure the model is about which group each piece of data belongs to, but remember, it needs a good amount of data to work properly. To sum it up, K-means is your go-to for quick and clean clustering of round groups, while GMM is the choice for more complex situations and gives you insights into the probability of each data point's membership in a cluster.