Downloaded 138 times
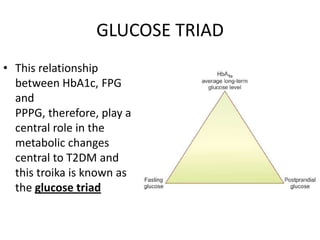
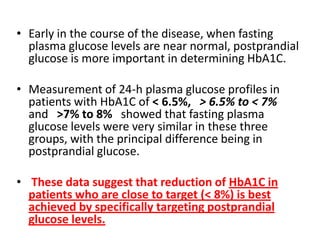
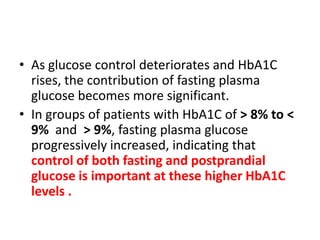
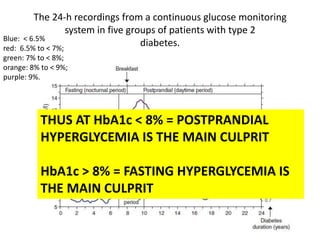


The document discusses the "glucose triad" which refers to the relationship between HbA1c, fasting plasma glucose, and postprandial plasma glucose in glycemic control. It notes that while HbA1c has traditionally been the target, more recent studies show intensive control to reach very low HbA1c levels may be detrimental. The document explores how the relationship between the components of the glucose triad changes over time as diabetes progresses, with postprandial glucose being more influential at lower HbA1c levels and fasting glucose becoming more important at higher levels. Treatment should target both fasting and postprandial hyperglycemia simultaneously for optimal control.