Downloaded 124 times
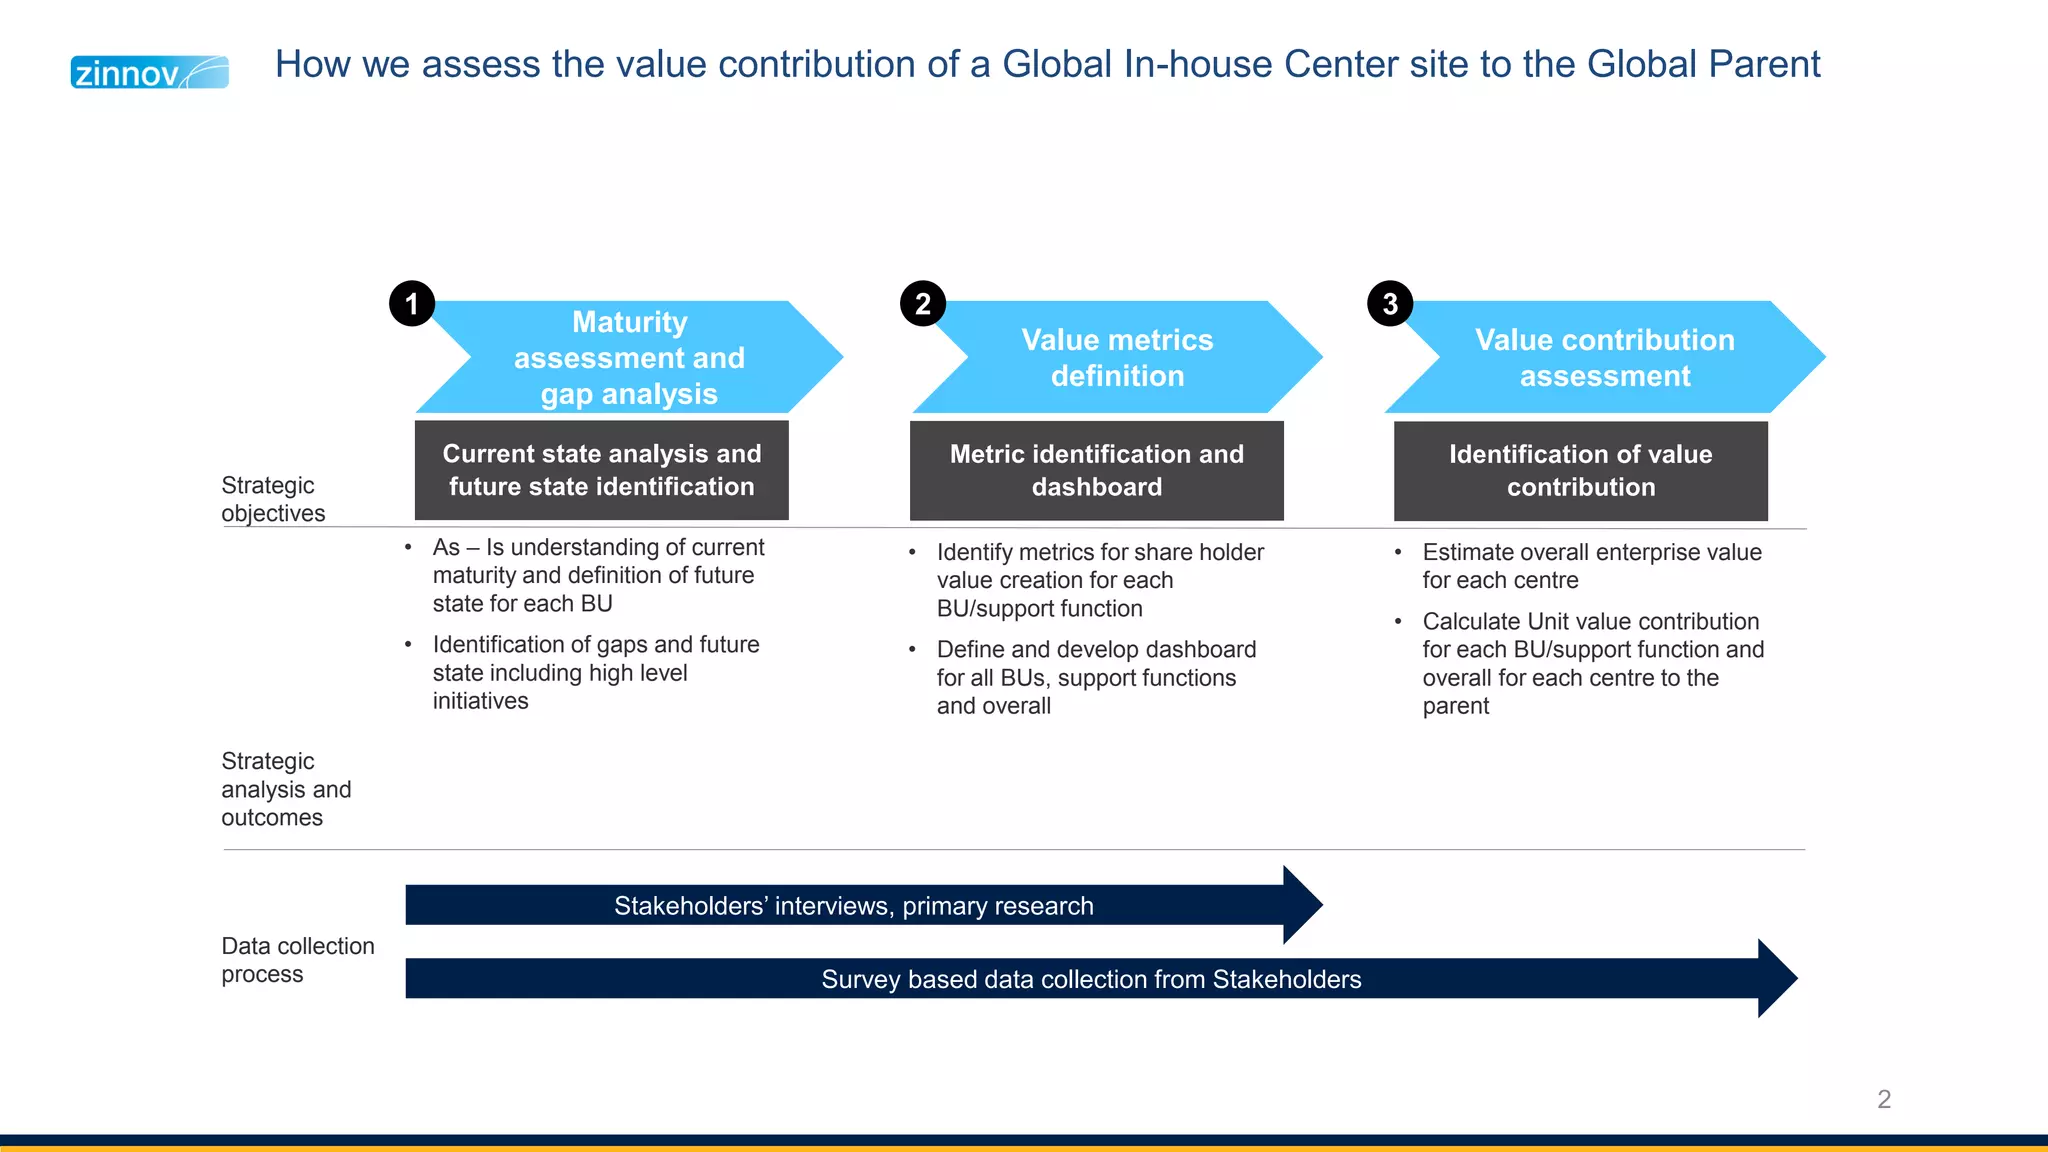


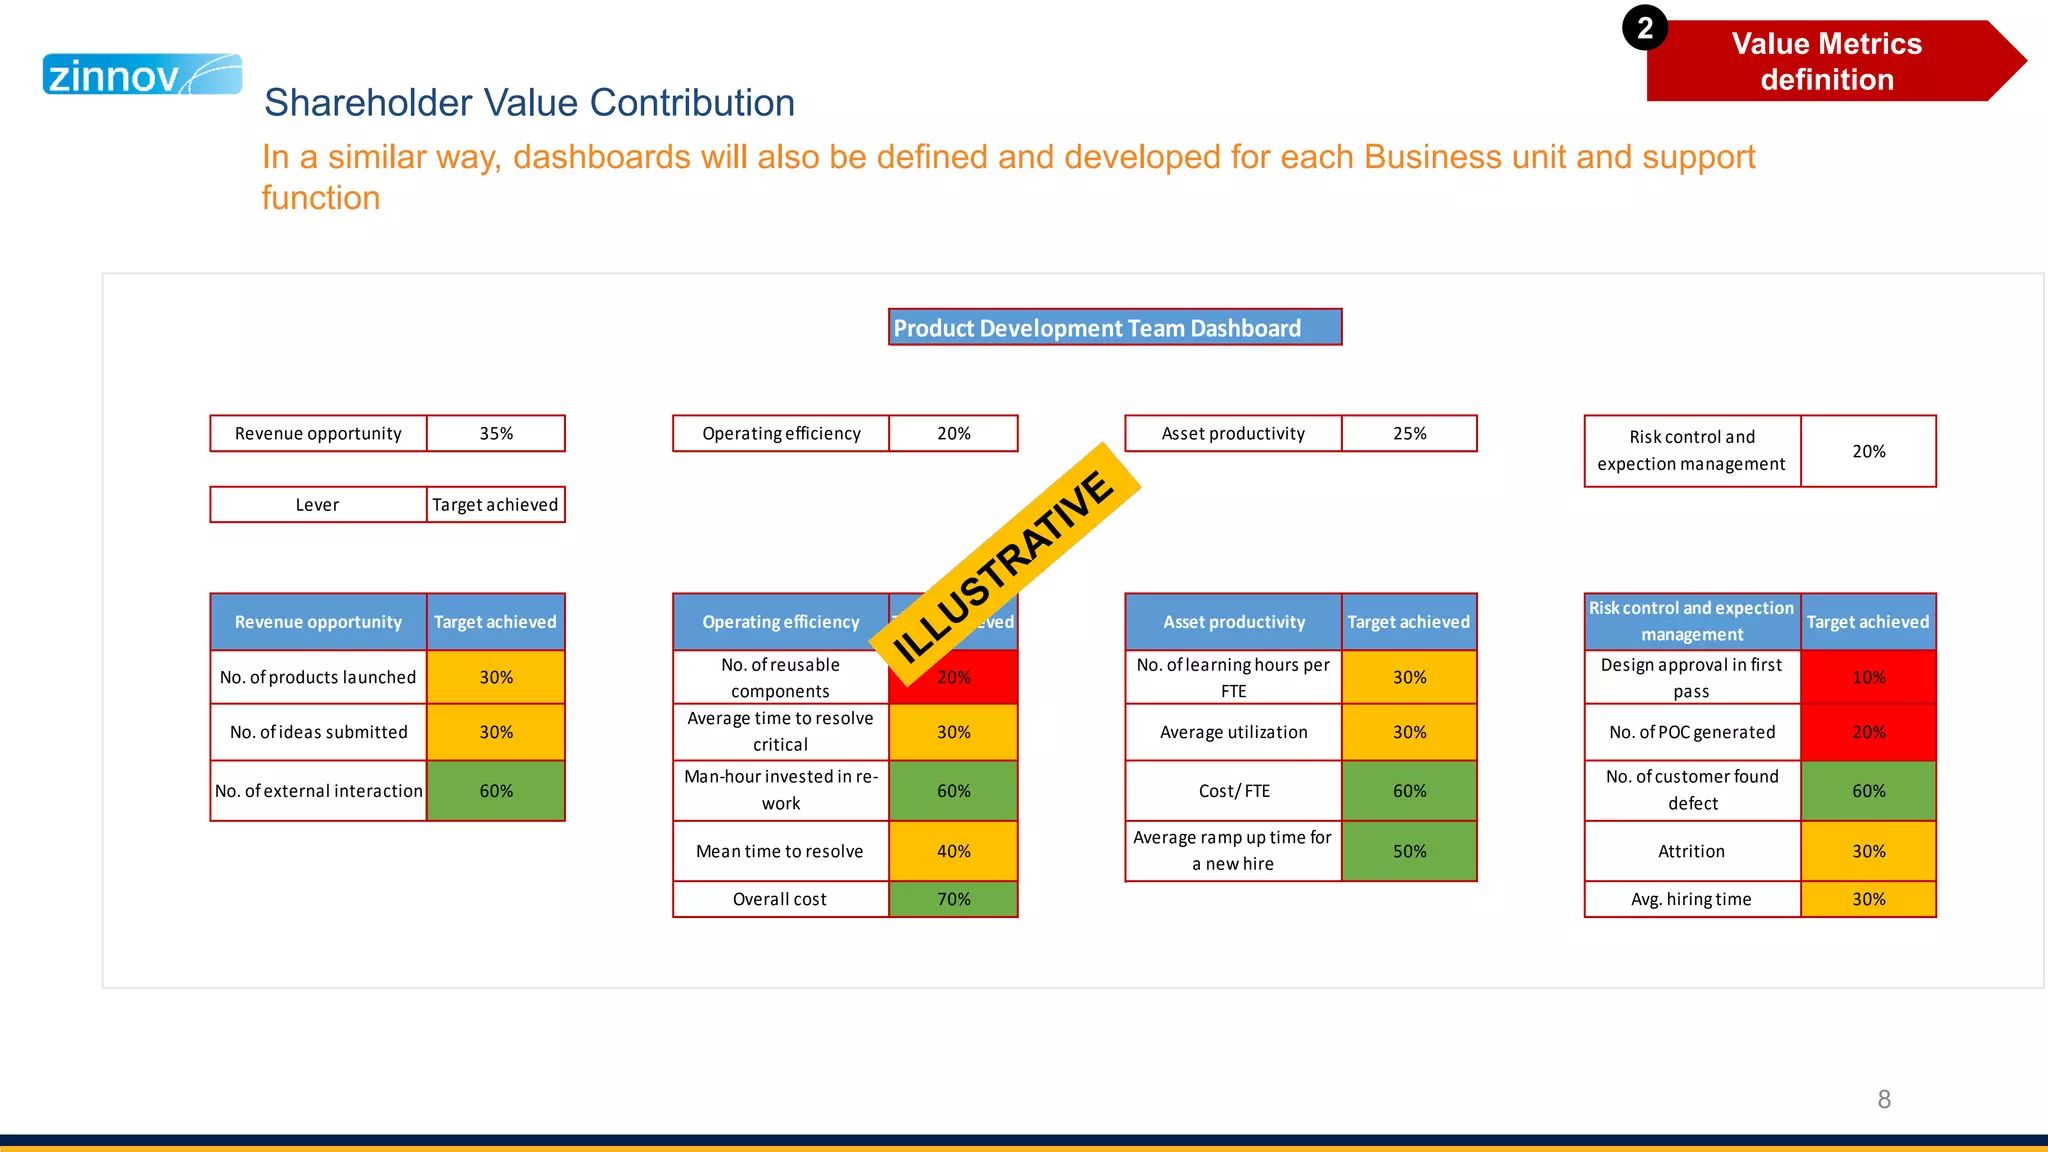

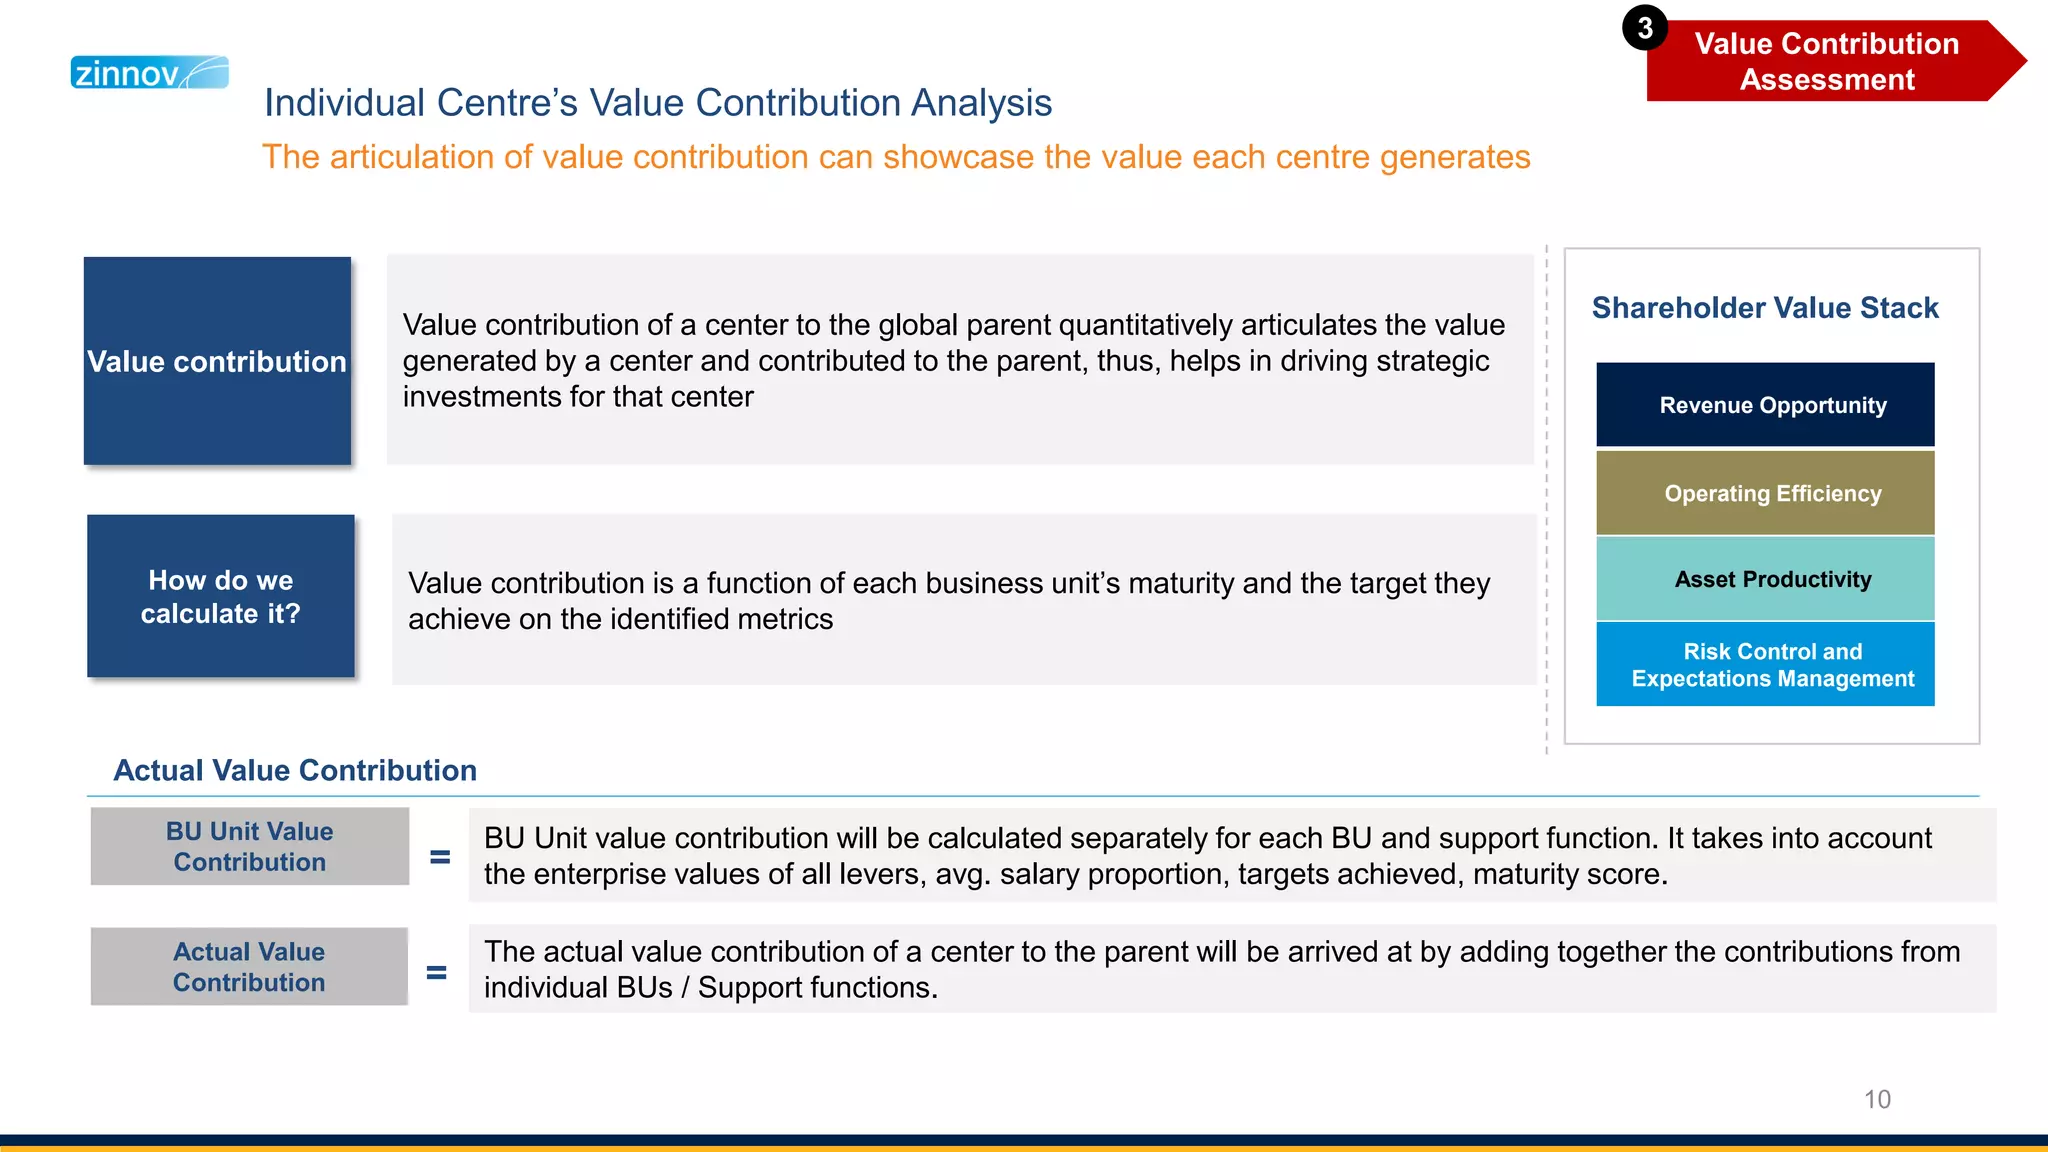
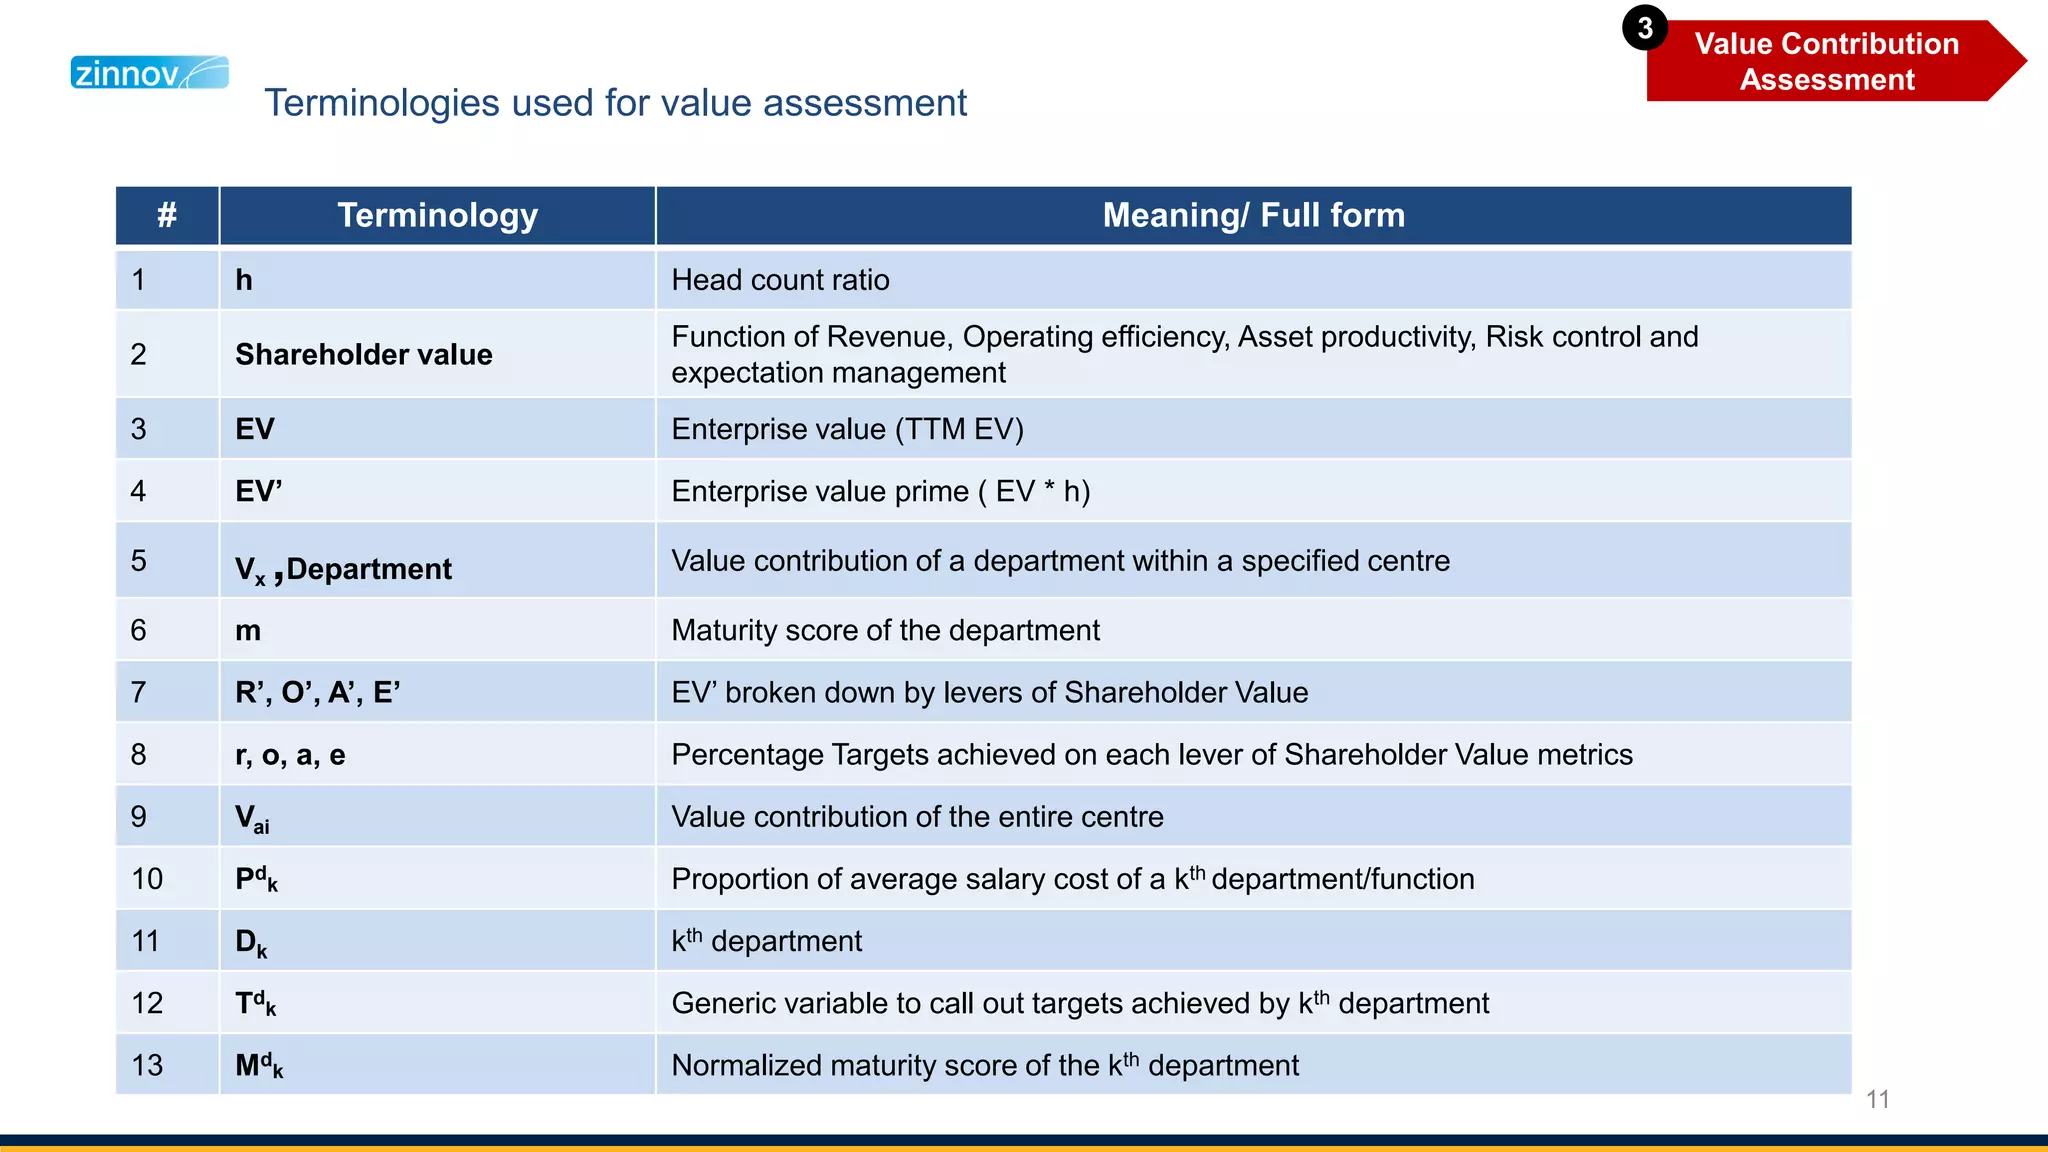

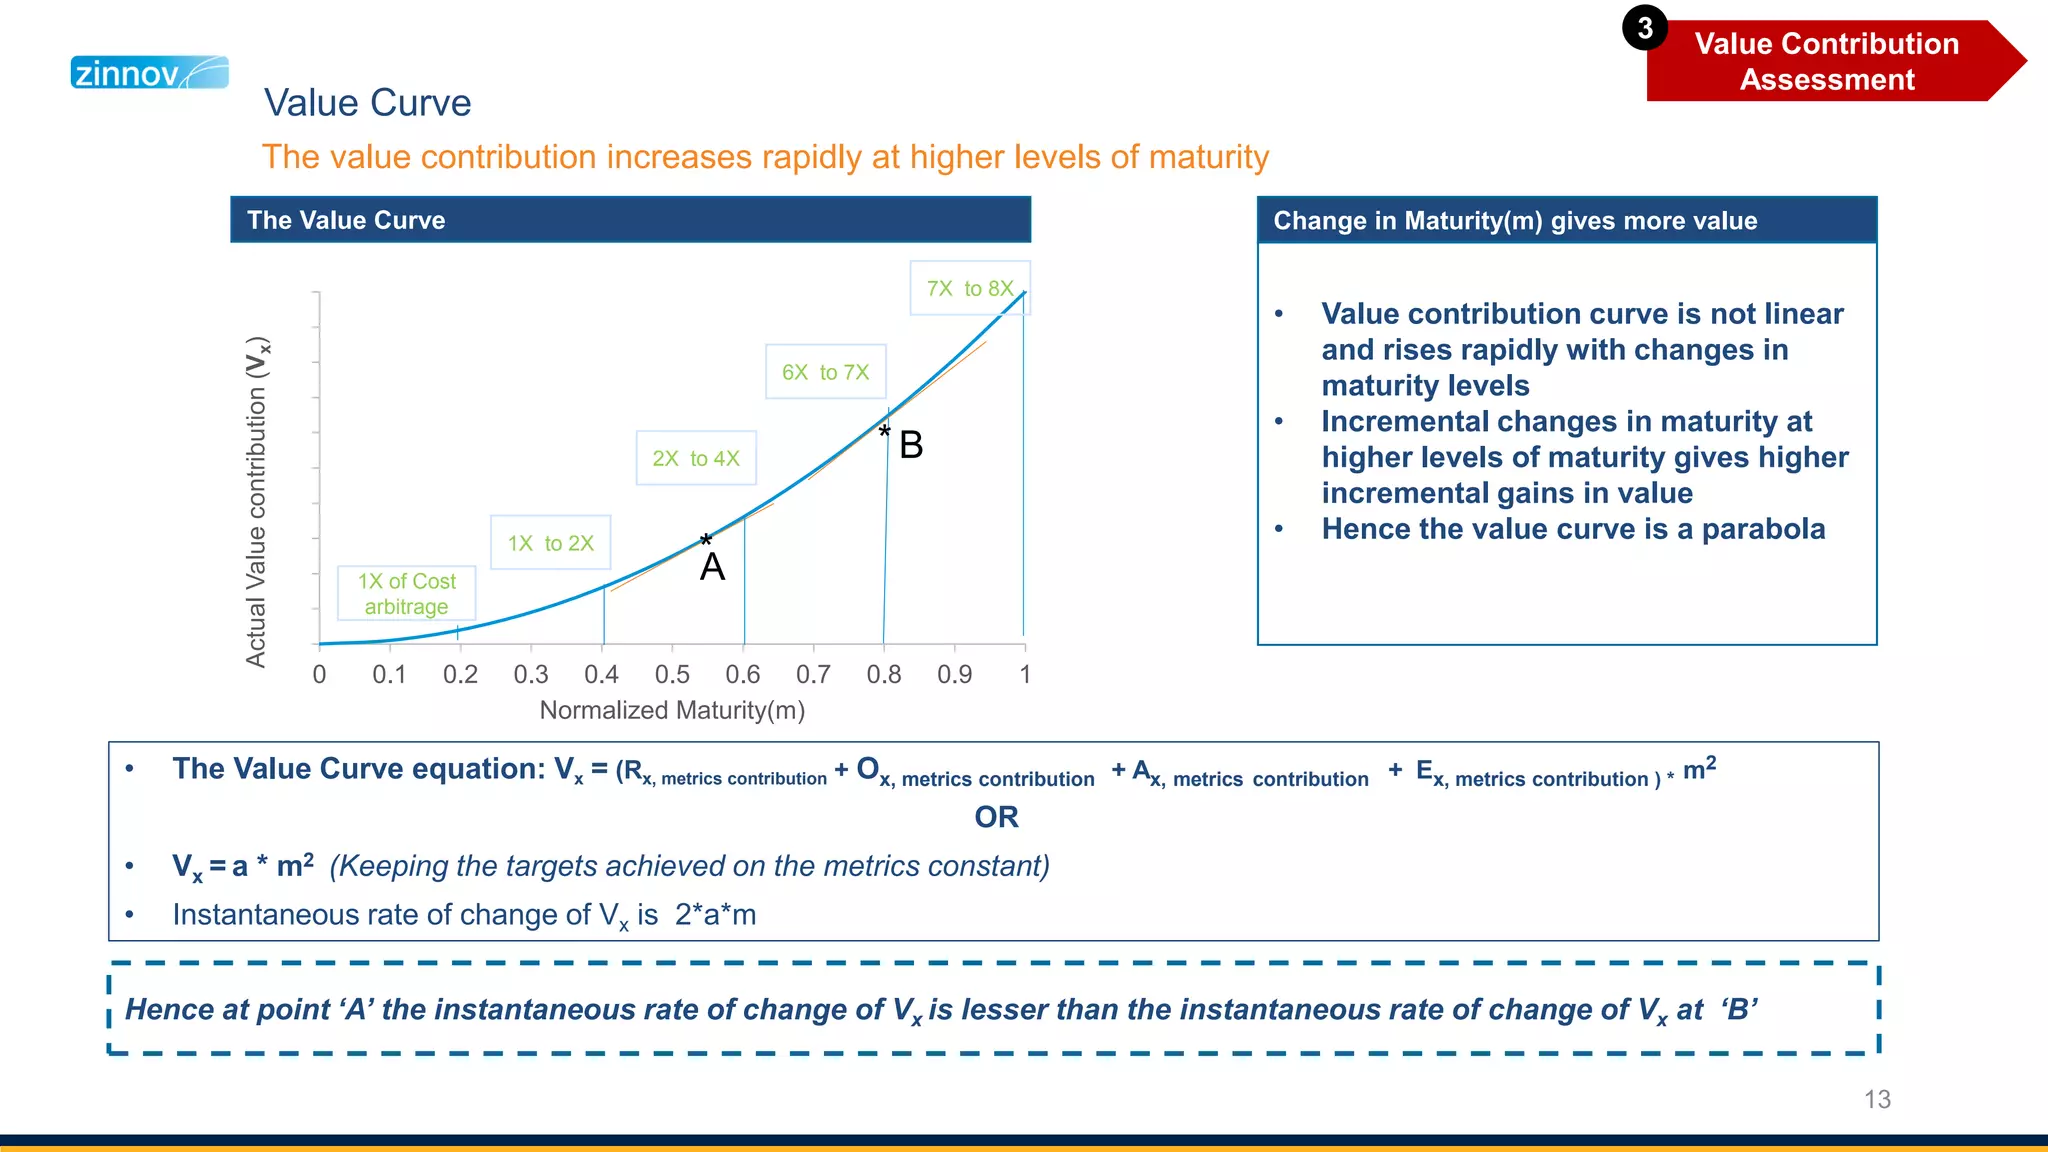

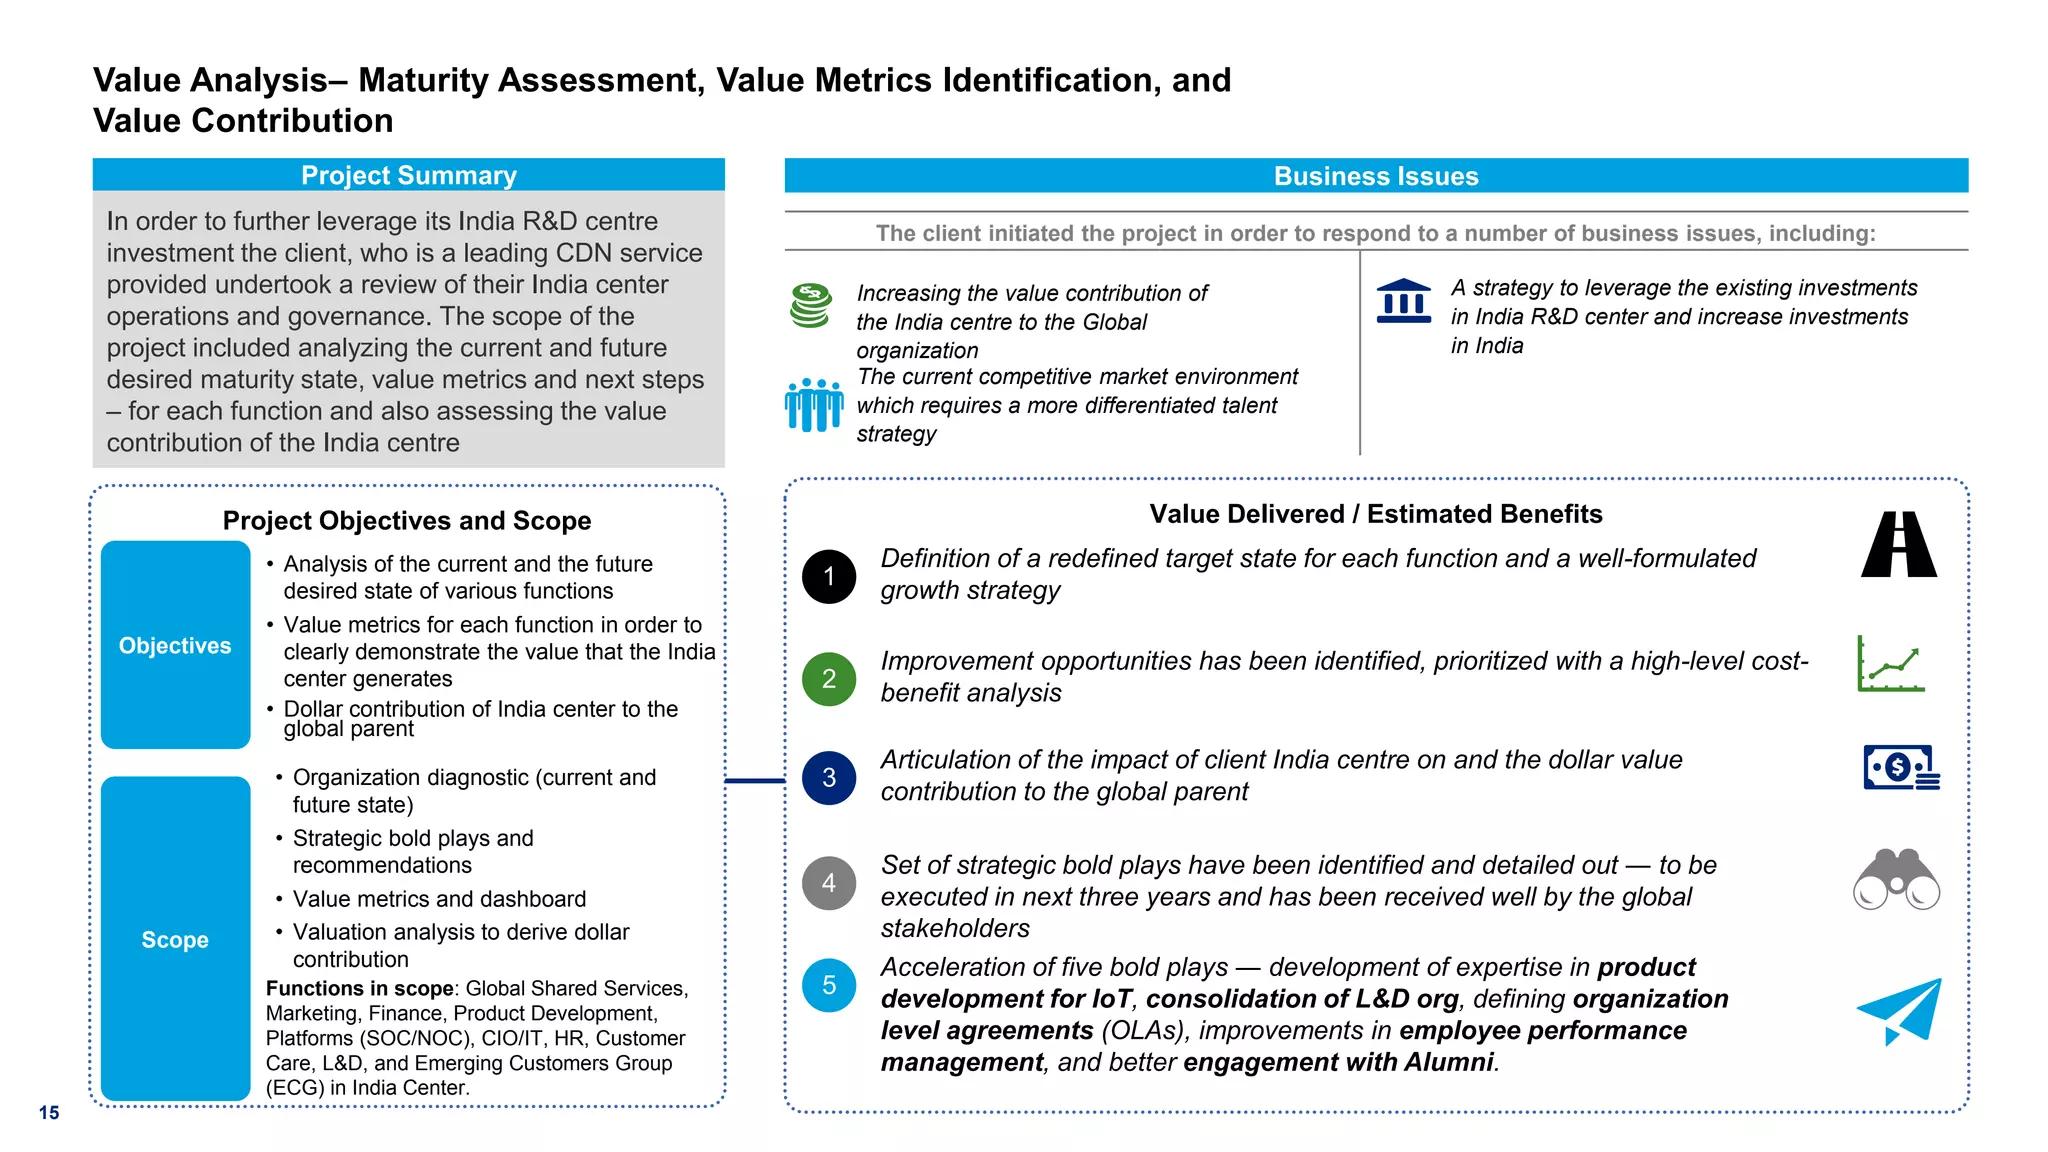


The document details a comprehensive value assessment and maturity analysis for a global in-house center, focusing on identifying current and desired maturity levels, key performance metrics, and overall value contribution to the parent organization. It outlines a structured methodology involving stakeholder interviews, data collection, and strategic analysis to estimate the financial impact and potential improvements for various business units. Key outcomes include clear value metric definitions, prioritization of improvement opportunities, and strategic recommendations aimed at enhancing the center's contributions to the global parent over the next three years.


![[Fabernovel study] New economy, new KPI: the customer era](https://cdn.slidesharecdn.com/ss_thumbnails/neweconomynewkpis-thecustomerera-190924165123-thumbnail.jpg?width=640&height=640&fit=bounds)


![Vibe Coding vs. Spec-Driven Development [Free Meetup]](https://cdn.slidesharecdn.com/ss_thumbnails/vibecodingvsspecdrivendevelopment-251209105622-43f455e7-thumbnail.jpg?width=640&height=640&fit=bounds)


![Coded Agents – with UiPath SDK + LangGraph [Virtual Hands-on Workshop]](https://cdn.slidesharecdn.com/ss_thumbnails/codedagentsdeck-251215155422-5497c599-thumbnail.jpg?width=640&height=640&fit=bounds)


