Download to read offline
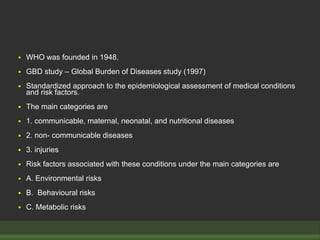

The document discusses strategies for assessing global disease burden, including the Global Burden of Disease study established by WHO. It examines hypertension specifically, defining it and discussing its prevalence, risk factors, and relationship to cardiovascular outcomes. Hypertension is a leading cause of mortality and disability worldwide according to DALYs. Family history, lifestyle factors like diet and exercise, and conditions like obesity influence hypertension risk.


