Presented to the Hamilton County GIS User Group meeting on 01.26.2010. Overview of ArcGIS Server Flex applications built to assist in damage assessment and visualization after an EF-4 tornado in Murfreesboro, Tennessee.
Google Maps is a web mapping service developed by Google that offers satellite imagery, aerial photography, street maps, 360° interactive panoramic street views, real-time traffic conditions, and route planning capabilities. It was originally created as a desktop program in C++ but was later acquired by Google in 2004 and converted into a web application, launching in 2005 with additional features. Google Maps satellite view uses high-resolution aerial photography of cities taken from low-flying aircraft as well as satellite imagery.
Ericsson’s latest service-enablement offering is the generator that feeds the official event apps with data in real time, and enables an immersive viewing experience for spectators anywhere. By ingesting all the different types of data associated with the championships, like live TV streams, location data and real-time positioning information from skiers as they race, the system can create an enriched context for all event content. By exposing this premium content in the form of an application programming interface (API), this offering allows event data to be separated completely from application and functionality – reducing development time and increasing re-usability.
This document discusses Vancouver International Airport's (YVR) process for mapping indoor spaces in their terminals. It involves a multi-stage workflow using FME and GIS software:
1) CAD floor plans are converted to GIS formats, cleaned up, and attributes added.
2) Rooms are aggregated and classified as public or non-public areas for use in passenger maps and apps.
3) Data is converted nightly to GeoJSON and uploaded to YVR's digital gateway for developers.
4) Additional refinement and conversions are done to meet Apple's AVF specification for indoor maps.
Automation, standards, documentation and QA/QC are emphasized to keep the indoor maps accurate and
The document summarizes the key features and capabilities of the British Columbia Ministry of Forests and Range Dispatch Program. It provides an overview of the program's situational awareness tools like airtanker tracking, resource tracking, incident mapping, weather monitoring, and interagency cooperation functions for sharing resources across different agencies.
Universal ground control software (UGCs) allows operators to control multiple unmanned vehicles with a single software. It enables operators to draw flight plans, monitor telemetry data, and analyze flight history. The software focuses on efficiency and convenience since at least 50% of operation speed and productivity depends on software. It provides tools for tasks like aerial imagery and inspection through functions like drawing waypoints, areas, and selecting buildings.
Generation of high resolution DSM using UAV Images Nepal Flying Labs
A final year project by Geomatics Engineering Students at Kathmandu University,Dhulikhel,Kavre.
All the datasets required for this project have been downloaded from the popular Trimble Company.This project makes use of 27 high resolution (2.4 cm average spatial resolution) UAV-acquired images of a sand mine at Tielt-Winge, Belgium . These images have been acquired by a Sony Nex-5R digital camera mounted on a Trimble UX5 Imaging Rover, a fixed wing UAV. Three software: LPS, AgiSoft PhotoScan and PIX4D were used for image processing.
The team members:
1.Uttam Pudasaini : utmpudasaini@hotmail.com
2.Niroj Panta : sadrose777@gmail.com
3.Biplov Bhandari : bionicbiplov45@gmail.com
4.Upendra Oli : Upendraoli@gmail.com
UgCS Pro is a sophisticated mission planning software for unmanned vehicles that allows users to deploy and monitor multiple UAVs simultaneously from a single server. It provides an unlimited operational area without restrictions, supports importing of 3D models and terrain data for accurate flight path planning, and notifies users of approaching aircraft through integrated ADS-B receivers for safer flights. UgCS Pro also records and stores all flight data and telemetry on the server for replay and analysis.
The document discusses a trailer tracking system that provides executive summaries, maps, timelines, and graphs of key fleet data. It allows users to view trailer locations, activity, journeys, and maintenance records. The system collects basic data from trailers like GPS position, speed, load percentage, and mileage, as well optional data like tyre pressure and temperature. It is described as creating opportunities to reduce empty running hours and time spent loaded but uncoupled. The technology in the data collection units and web application is presented as the future of trailer management, with minimal investment but great return on investment.
NDGeospatialSummit2019 - OMF Project – Leveraging High Accuracy GIS to Enhanc...North Dakota GIS Hub
This document discusses Whiting Oil & Gas's implementation of a new Operations Mapping Framework (OMF) using GIS technology. The OMF aims to improve safety, accuracy, efficiency, collaboration, and technological adoption. Destin Cole of Whiting and Michael Clancy of EcoPoint Inc introduced the project to enhance field workflows using high accuracy GIS mapping. Key aspects of the OMF include collecting and managing GIS data on underground infrastructure, developing applications like Survey123 for field data collection and a workforce tracking dashboard, and plans for future enhancements like additional data collection and AR applications.
This document discusses mobile apps that can be used for planning, managing, and measuring fieldwork. It provides lists of apps for tasks like establishing field conditions, mapping, tracking, recording, surveying, managing data, and measuring variables like slope, aspect, and species identification. The document recommends testing apps before fieldwork, planning for connectivity needs, considering hardware requirements, and getting creative by combining apps or developing your own.
The document summarizes a project by the City of Maple Grove to collect high-accuracy GIS data on utilities infrastructure in real-time using Trimble GPS units, ArcGIS for Windows Mobile software, and Trimble Positions. Interns were hired and deployed with the mobile devices and software to inventory utility structures and sync the data in real-time to reduce overhead. The project was designed to increase confidence in maps, complete an asset inventory, and improve field data accessibility and efficiency with minimal resources required once deployed.
UAVs and FME: Powering Your Drone and Its Data with FMESafe Software
This presentation will look at some typical UAV support workflows where FME can help both with flight planning and post processing. Examples include examining flight restrictions and obstacles to determine where it is safe to fly. For post processing, FME's tools for managing imagery will be examined, including georeferencing and mosaicking. The results from local test flights on a low-cost UAV platform will be reviewed. We will wrap with a summary of some customer applications where FME has been used to support UAV operations, and some of the challenges and opportunities that this rapidly growing industry presents in the near future.
Disaster response involves rapid integration of diverse data sources in order to derive spatial information critical to an effective disaster response. This presentation will look at a range of use cases where FME has been used in both disaster response scenarios and practical applications. Safe participated in a recent OGC Testbed that involved a flood disaster response scenario for the San Francisco Bay area. A number of national mapping and environment agencies use FME for managing their flood data, weather data and disaster response resources. Typical disaster response workflows and formats will also be reviewed, including how FME works with DEMs, imagery, time series data and live web feeds to integrate real time with base map data and provide the results planners need to respond effectively. FME's strong support for open standards related to emergency response will also be discussed.
1. The document discusses using infrared technology, GPS, and GIS mapping capabilities from aircraft to provide situational awareness and fire mapping for ground crews.
2. It describes software and mobile apps that allow overlaying fire perimeter maps, infrastructure data, and infrared footage on detailed topo maps for coordination between air and ground teams.
3. Future plans include developing smartphone apps to deliver daily fire maps offline, track personnel and equipment, and potentially transmit live video from aircraft to ground crews.
EnviroInsite can serve as a Web Map Service client. Presentation describes procedures for selecting the coordinate system and the features from a particular web map service.
Supporting Situational Awareness at LAX using FME ServerSafe Software
The document discusses how Los Angeles World Airports (LAWA) used FME Server to integrate disparate datasets to support situational awareness at Los Angeles International Airport (LAX). Key datasets from systems like CAD, Oracle, Maximo, and Nice Situator were brought together, cleaned, and formatted to build a redundant database and streamline information sharing for stakeholders like the Airport Response Coordination Center. This improved response coordination and situational awareness across systems at LAX.
The document summarizes the process of collecting and processing LiDAR data from aircraft for geospatial applications. Key steps include planning flights to cover a project area, flying the aircraft equipped with a laser scanner and GPS, processing raw laser and GPS data to determine point locations, extracting useful data, ensuring accuracy by inspecting overlaps between flight lines, and delivering the final data products to clients.
A two-person surveying firm in southeast England has successfully utilized HDS (high definition surveying) technology in their work for over 15 years. The document details how the firm is able to complete many surveying projects with just one person in the field using an HDS scanner, GPS, and total station. It discusses the phases of incorporating HDS into their business, metrics on HDS use, and examples of projects where HDS provided benefits over traditional surveying methods.
This document summarizes an undergraduate final year project on developing an autonomous rover using simultaneous localization and mapping (SLAM). The project uses occupancy grid mapping and a particle filter for SLAM. The hardware includes a laser sensor, Arduino, Raspberry Pi, and other components. The SLAM algorithm represents maps as grids and uses position estimation and exploration. The particle filter localizes the rover by updating particle weights based on sensor data and map correlation. The project aims to enable autonomous navigation and environment surveillance.
The Sky view factor (SVF) represents the fraction of visible sky from a location and is used to estimate the urban heat island effect, energy balance, and thermal comfort. This document describes an online GIS tool that calculates SVF values based on building footprints, heights, and observer locations. The tool divides the hemisphere into slices, calculates elevation angles and distances to buildings to determine the fraction of sky obstructed at each observer point. Calculated SVF values are uploaded to ArcGIS Online to share maps of SVF distributions for urban planning and analysis of different design proposals.
@healthmap shared detailed anonymised data. Filter England data to match Local Authority boundaries. Pivot-table them into time-series attributes per Local Authority. Use @kennethfield coxcombs in ArcGIS. Parse the class_ field into dates. Post the newly time-enabled coxcombs to fan out and show infectuous arrivals. Step-by-step starts slide 11.
UAV and LIDAR surveys were conducted of a 5-acre site to compare elevation measurements. The UAV survey had a vertical RMSE of 7 cm and captured 271 images at 60m altitude. The LIDAR data had a resolution of 1m and vertical RMSE of 8cm after correction. Comparisons showed the UAV and LIDAR elevations varied by less than 10cm at control points and had a 90% correlation at 100 verification points, demonstrating the surveys produced comparable results.
The document discusses Middle Tennessee Electric Membership Corporation's (MTEMC) transition from a custom Flex-based web dashboard to apps built with Esri's Web AppBuilder and Portal for ArcGIS Server. The goals were to streamline tools, focus on mobile use, eliminate the need for VPN access, and enable use on any device. Challenges included enterprise logins, managing complex map services, consistent access across networks, and avoiding customization. These were addressed through Web AppBuilder widgets, composite locators, basemap templates, and custom widgets for incidents and tracing. The new system increased GIS adoption and prepared MTEMC for future mobile and web applications outside the corporate network.
Presented at the 2013 Esri Southeast User Conference. User case story showing how ArcGIS Online was used to publish a public-facing outage map for an electric utility. Presented at the 2013 Esri Southeast User Conference in Jacksonville, FL.
This document provides an overview of True North Geographic Technologies, a company that provides web and mobile GIS solutions. It discusses True North's background and clients in local government and utilities. It then outlines how they have developed mobile and web-based dashboards to help utilities manage assets and share information. It details their process of starting with a Flex-based web dashboard, then creating new versions to reduce custom code and add tools. It also explains how they expanded into mobile apps in response to client needs, developing both connected and offline mobile apps for utilities to conduct tasks like damage assessment.
Overview of Next-Gen 911 in Tennessee and how the Address Data Management tools solution can be used to support data maintenance for 911.
Presented at the 2015 Esri Southeast User Conference in Nashville, Tennessee.
Overview of GIS applications recently deployed at Middle Tennessee Electric Membership Corporation. Older apps built on the ArcGIS Viewer for Flex were replaced with newer responsive versions based on the Web AppBuilder for ArcGIS.
Presented at the 2015 Esri Southeast User Conference in Nashville, Tennessee.
Basemap data is often an afterthought in utility GIS implementations. Parcels, streets, and imagery from multiple jurisdictions are stacked at the bottom of the layer list in desktop and web apps, leaving users with an assortment of inconsistent cartography and data attributes to sort through. Esri provides tools through the Local and State Government Solution Centers that create a framework for building and maintaining a consistent, seamless landbase that is easier to use and that provides more meaningful context for utility applications.
Provides an overview of how Putnam County, TN and the City of Cookeville partnered to share resources an collaborate on data maintenance in order to grow their respective GIS programs. Presented at the 2013 Esri Southeast User Conference in Jacksonville, FL.
This document summarizes a discussion on engaging physics students through inquiry-based learning methods. It suggests raising students' curiosity by relating concepts to their daily experiences on the bus or with falling objects. Competitive games like an egg drop challenge can promote skills in creativity, problem-solving, and collaboration. Exploring counterintuitive phenomena can stimulate discussion. Asking open-ended "what if" questions allows students to apply their knowledge in new ways. Understanding the history of physics pioneers' thinking can help students develop metacognition. The conclusion emphasizes that understanding comes from fun, lively exploration, rather than passive lecturing.
Burning fossil fuels increases greenhouse gas emissions and introduces more carbon dioxide into the atmosphere. This can be addressed using anaerobic digestion to convert biomass waste into biogas for energy. Anaerobic digestion is an efficient process where different types of bacteria break down organic waste into methane gas without oxygen. There are three main types of digesters - covered lagoons, complete mix digesters, and plug-flow digesters - that vary in their solid concentrations and mechanisms for waste breakdown and biogas collection. Anaerobic digestion has advantages such as being environmentally friendly, economically profitable, improving air quality, and reducing odors.
The document provides step-by-step instructions for installing Oracle Data Integrator 11g, including selecting an installation type, checking prerequisites, specifying installation locations, configuring repositories, specifying agent details, reviewing installation summaries, and completing the installation process. Key steps include selecting between developer, standalone, or Java EE installation types; configuring the master and work repositories; specifying the agent name and port; and reviewing and saving the installation configuration.
The document provides step-by-step instructions for installing Adobe Reader and Flash Player. It guides the user through downloading, running, and completing the installation packages for both programs over several pages. The final steps instruct the user to click "Finish" after Adobe Reader installation and "Done" once Flash Player installation is complete.
This is a presentation given at the Center for Nonprofit Excellence on useful legal and compliance tips for officers and directors of nonprofit organizations. The featured speaker was Richmond, Virginia business and nonprofit attorney Eric Perkins, who also shared with the group his Five Finger Philosophy of Nonprofit Board Composition. Which finger are you? Email eric@ericperkinslaw.com for copies of the program handouts.
Improving Weather Information Data Services with FMESafe Software
Iowa Department of Transportation needed to modernize their WeatherView web application which provides weather data to the public. This data comes from both AWOS (Automated Weather Observation System) and RWIS (Roadway Weather Information System) data feeds. The existing WeatherView application used a combination of direct database and REST services. Iowa DOT has moved to an open data model for their geospatial data and wanted to revamp the AWOS and RWIS REST services to provide more data to the public and to be leveraged in multiple applications/solutions.
I leveraged FME due to the complexity of processing the data. The data sources included JSON feeds, database views and an FTP folder. I needed to leverage startup Python Scripts for moving RWIS images between two FTP folders. The Maintenance Office wanted to add a ‘Spatial Buddy Check’ for several sensors on the RWIS data feed to exclude outlier values. Finally, Iowa DOT leverages ArcGIS Online Feature Collections for high availability data feeds. This requires a custom shutdown Python script to update Feature Collections after the AGOL Feature Service is updated.
This presentation will cover the different methods used to modernize the AWOS and RWIS weather data feeds so they could be leveraged by the public and in other geospatial solutions.
WeatherView URL: weatherview.iowadot.gov
Putting Asset Management Tools on the web and mobile devices with Cartegraph ...GeCo in the Rockies
1) The City of Golden implemented an online and mobile asset management system using Cartegraph and GIS to increase accessibility and efficiency of their asset data.
2) This allows staff to access up-to-date asset information and complete work orders from mobile devices in the field.
3) The system integrates asset and spatial data, enables real-time progress monitoring, and improved citizen request management through a web portal.
OpenGeoData Italia 2014 - Domenico Grandoni "Come rispondere ad un evento eme...giovannibiallo
This document discusses e-GEOS Emergency Mapping Service's response to emergency events by exploiting open data and COSMO-SkyMed satellite imagery. The service provides reference maps within 6 hours of activation and damage assessment maps within 3 hours of satellite data availability. Key challenges addressed are quick access to open geodata for reference maps and crisis data for post-event maps. The workflow involves checking satellite tasking opportunities, downloading open data, preparing reference maps, processing imagery, analyzing changes to prepare crisis maps. e-GEOS' Geodata Toolkit provides a single access point to heterogeneous open geospatial data to generate detailed base maps in under 30 minutes. An example response to the 2013 Oklahoma tornado is presented.
The document provides examples of how various organizations are using FME to solve spatial data challenges. Key examples include:
- Kansas DOT using FME to generate 3D airspace polygons from FAA descriptions to evaluate effects of vertical constructions on airports.
- UVM Systems automating model and terrain data preparation with FME to create navigable 3D worlds with thousands of buildings.
- San Antonio Water System integrating multiple systems and data types across departments using FME to handle data integration.
- Municipality of Tuusula using FME's vectorization transformers to convert environmental observation JPGs with drawn areas, lines, and symbols to vector data.
This document discusses using an enhanced Web Map Service (WMS) to visualize four-dimensional environmental data on the web. It describes the Godiva2 system, which allows interactive exploration of geospatial raster datasets through a web interface. Godiva2 enhances the standard WMS by adding extra metadata and visualization methods for scientific data like time series plots. It provides a way to visualize large and complex environmental modeling outputs.
John Jeffery Kyzer has over 15 years of experience processing satellite and aerial imagery into orthorectified and mosaic image products using software such as ArcGIS and PCI. He has a background in geography with a focus on remote sensing, cartography, GIS and physics. Kyzer also has experience as an electronic warfare technician in the U.S. Navy from 1985-1993 and currently serves in the Air National Guard where he deploys and maintains satellite communications equipment.
FME Around the World (FME Trek Part 1): Ken Bragg - Safe Software FME World T...IMGS
Aim: "To seek out innovative FME users
throughout the galaxy, sharing
their stories and ideas to inspire
you to take your data where no
data has gone before."
Aerial Services, Inc. (ASI) is an integrated team of professionals providing premier services and products to government, utilities, engineers, and other geospatial customers. Based in the Iowa heartland for over 40 years, Aerial Services’ Midwestern work ethic, cutting-edge technology, and experienced staff combine to harness the power of geographic information and provide solutions you need.
Overview of MassGIS Web Mapping Servicesaleda_freeman
MassGIS provides geographic data and web mapping services to government agencies and the public. It has offered OGC standard web map and feature services since the early 2000s, initially through ArcIMS and now via GeoServer. A variety of desktop and web-based clients can access and display MassGIS data, including ArcGIS, Google Earth, and custom applications created by MassGIS and other organizations for uses like forestry management and broadband surveys. MassGIS services support over 20,000 requests per day and continue to expand their data and capabilities.
IR+GIS enables aerial fire teams to work more effectively. Includes actual flight over wildfire in Yosemite National Park in 2009. Shows the use of multi-layer moving map GIS in the cockpit that is coupled with passive Infrared. Enables Air Attacks to fly more effectively over smoke and dark. Operational instructions at www.AerialFireTech.org. I want to help other countries of the world get this capability - contact me.
The document discusses how engineering technology can improve data analysis using robotics and wireless data access. It proposes integrating detailed inspection planning, mobile situational awareness software, and robotic technology to increase efficiency and safety. Detailed inspection planning would focus on priority items and reduce scope. Mobile software would provide real-time visibility of tasks and processes for accountability. Robotic technology could increase safety by reducing risk and eliminating the need for human entry into hazardous areas, while also providing significant cost savings through efficiency gains. The integration of these approaches aims to standardize processes while documenting outcomes for continuous improvement.
Drone photography was used to map 116 acres of land in Manipur, India for development of Manipur Technical University. Over 4000 aerial images were taken with a DJI Phantom 4 drone and stitched together to create a high resolution digital elevation model and orthophoto of the site. This accurate 3D model and aerial imagery allowed planners to easily demarcate the plot boundaries, calculate elevations, and estimate development costs. The drone survey was much faster and more precise than relying on outdated paper maps and low resolution satellite imagery.
Help Us Prevent Another Yarnell Hill Tragedy! Bill King
This presentation highlights the capabilities of a new wildland fire incident management program. Prometheus' Shield is a comprehensive system designed specifically to protect the lives of wildland firefighters and emergency responders in the field.
New Satellite GPS service for FirefightersBill King
Introducing the first incident management program for wildland fires with satellite GPS tracking. This comprehensive, web-based system was designed specifically to protect the lives of emergency responders.
How You Can Help Save the Life of a Firefighter!Bill King
Prometheus' Shield is an incident management system that uses satellite GPS tracking to provide real-time location tracking of firefighters and equipment. It displays their locations on a touchscreen map at the incident command post. This helps prevent tragedies like the 19 firefighters who perished at the Yarnell Hill Fire by guaranteeing communication between firefighters and command. The system utilizes satellite technology, electronic ID tags, and aerial imagery to provide situational awareness and ensure firefighter safety.
The Only Satellite GPS tracking Service for Firefighters and Emergency Repson...Bill King
Introducing the only program for wildland fire management with satellite GPS tracking. This comprehensive, web-based system was designed specifically to protect the lives of emergency responders.
Introducing the first incident management program for wildland fires. This comprehensive, web-based system was designed specifically to protect the lives of emergency responders.
Similar to GIS Applications for Tornado Damage Visualization (20)
Securing your Kubernetes cluster_ a step-by-step guide to success !KatiaHIMEUR1
Today, after several years of existence, an extremely active community and an ultra-dynamic ecosystem, Kubernetes has established itself as the de facto standard in container orchestration. Thanks to a wide range of managed services, it has never been so easy to set up a ready-to-use Kubernetes cluster.
However, this ease of use means that the subject of security in Kubernetes is often left for later, or even neglected. This exposes companies to significant risks.
In this talk, I'll show you step-by-step how to secure your Kubernetes cluster for greater peace of mind and reliability.
Communications Mining Series - Zero to Hero - Session 1DianaGray10
This session provides introduction to UiPath Communication Mining, importance and platform overview. You will acquire a good understand of the phases in Communication Mining as we go over the platform with you. Topics covered:
• Communication Mining Overview
• Why is it important?
• How can it help today’s business and the benefits
• Phases in Communication Mining
• Demo on Platform overview
• Q/A
Alt. GDG Cloud Southlake #33: Boule & Rebala: Effective AppSec in SDLC using ...James Anderson
Effective Application Security in Software Delivery lifecycle using Deployment Firewall and DBOM
The modern software delivery process (or the CI/CD process) includes many tools, distributed teams, open-source code, and cloud platforms. Constant focus on speed to release software to market, along with the traditional slow and manual security checks has caused gaps in continuous security as an important piece in the software supply chain. Today organizations feel more susceptible to external and internal cyber threats due to the vast attack surface in their applications supply chain and the lack of end-to-end governance and risk management.
The software team must secure its software delivery process to avoid vulnerability and security breaches. This needs to be achieved with existing tool chains and without extensive rework of the delivery processes. This talk will present strategies and techniques for providing visibility into the true risk of the existing vulnerabilities, preventing the introduction of security issues in the software, resolving vulnerabilities in production environments quickly, and capturing the deployment bill of materials (DBOM).
Speakers:
Bob Boule
Robert Boule is a technology enthusiast with PASSION for technology and making things work along with a knack for helping others understand how things work. He comes with around 20 years of solution engineering experience in application security, software continuous delivery, and SaaS platforms. He is known for his dynamic presentations in CI/CD and application security integrated in software delivery lifecycle.
Gopinath Rebala
Gopinath Rebala is the CTO of OpsMx, where he has overall responsibility for the machine learning and data processing architectures for Secure Software Delivery. Gopi also has a strong connection with our customers, leading design and architecture for strategic implementations. Gopi is a frequent speaker and well-known leader in continuous delivery and integrating security into software delivery.
LF Energy Webinar: Electrical Grid Modelling and Simulation Through PowSyBl -...DanBrown980551
Do you want to learn how to model and simulate an electrical network from scratch in under an hour?
Then welcome to this PowSyBl workshop, hosted by Rte, the French Transmission System Operator (TSO)!
During the webinar, you will discover the PowSyBl ecosystem as well as handle and study an electrical network through an interactive Python notebook.
PowSyBl is an open source project hosted by LF Energy, which offers a comprehensive set of features for electrical grid modelling and simulation. Among other advanced features, PowSyBl provides:
- A fully editable and extendable library for grid component modelling;
- Visualization tools to display your network;
- Grid simulation tools, such as power flows, security analyses (with or without remedial actions) and sensitivity analyses;
The framework is mostly written in Java, with a Python binding so that Python developers can access PowSyBl functionalities as well.
What you will learn during the webinar:
- For beginners: discover PowSyBl's functionalities through a quick general presentation and the notebook, without needing any expert coding skills;
- For advanced developers: master the skills to efficiently apply PowSyBl functionalities to your real-world scenarios.
Generative AI Deep Dive: Advancing from Proof of Concept to ProductionAggregage
Join Maher Hanafi, VP of Engineering at Betterworks, in this new session where he'll share a practical framework to transform Gen AI prototypes into impactful products! He'll delve into the complexities of data collection and management, model selection and optimization, and ensuring security, scalability, and responsible use.
Full-RAG: A modern architecture for hyper-personalizationZilliz
Mike Del Balso, CEO & Co-Founder at Tecton, presents "Full RAG," a novel approach to AI recommendation systems, aiming to push beyond the limitations of traditional models through a deep integration of contextual insights and real-time data, leveraging the Retrieval-Augmented Generation architecture. This talk will outline Full RAG's potential to significantly enhance personalization, address engineering challenges such as data management and model training, and introduce data enrichment with reranking as a key solution. Attendees will gain crucial insights into the importance of hyperpersonalization in AI, the capabilities of Full RAG for advanced personalization, and strategies for managing complex data integrations for deploying cutting-edge AI solutions.
Threats to mobile devices are more prevalent and increasing in scope and complexity. Users of mobile devices desire to take full advantage of the features
available on those devices, but many of the features provide convenience and capability but sacrifice security. This best practices guide outlines steps the users can take to better protect personal devices and information.
Observability Concepts EVERY Developer Should Know -- DeveloperWeek Europe.pdfPaige Cruz
Monitoring and observability aren’t traditionally found in software curriculums and many of us cobble this knowledge together from whatever vendor or ecosystem we were first introduced to and whatever is a part of your current company’s observability stack.
While the dev and ops silo continues to crumble….many organizations still relegate monitoring & observability as the purview of ops, infra and SRE teams. This is a mistake - achieving a highly observable system requires collaboration up and down the stack.
I, a former op, would like to extend an invitation to all application developers to join the observability party will share these foundational concepts to build on:
Essentials of Automations: The Art of Triggers and Actions in FMESafe Software
In this second installment of our Essentials of Automations webinar series, we’ll explore the landscape of triggers and actions, guiding you through the nuances of authoring and adapting workspaces for seamless automations. Gain an understanding of the full spectrum of triggers and actions available in FME, empowering you to enhance your workspaces for efficient automation.
We’ll kick things off by showcasing the most commonly used event-based triggers, introducing you to various automation workflows like manual triggers, schedules, directory watchers, and more. Plus, see how these elements play out in real scenarios.
Whether you’re tweaking your current setup or building from the ground up, this session will arm you with the tools and insights needed to transform your FME usage into a powerhouse of productivity. Join us to discover effective strategies that simplify complex processes, enhancing your productivity and transforming your data management practices with FME. Let’s turn complexity into clarity and make your workspaces work wonders!
A tale of scale & speed: How the US Navy is enabling software delivery from l...sonjaschweigert1
Rapid and secure feature delivery is a goal across every application team and every branch of the DoD. The Navy’s DevSecOps platform, Party Barge, has achieved:
- Reduction in onboarding time from 5 weeks to 1 day
- Improved developer experience and productivity through actionable findings and reduction of false positives
- Maintenance of superior security standards and inherent policy enforcement with Authorization to Operate (ATO)
Development teams can ship efficiently and ensure applications are cyber ready for Navy Authorizing Officials (AOs). In this webinar, Sigma Defense and Anchore will give attendees a look behind the scenes and demo secure pipeline automation and security artifacts that speed up application ATO and time to production.
We will cover:
- How to remove silos in DevSecOps
- How to build efficient development pipeline roles and component templates
- How to deliver security artifacts that matter for ATO’s (SBOMs, vulnerability reports, and policy evidence)
- How to streamline operations with automated policy checks on container images
How to Get CNIC Information System with Paksim Ga.pptxdanishmna97
Pakdata Cf is a groundbreaking system designed to streamline and facilitate access to CNIC information. This innovative platform leverages advanced technology to provide users with efficient and secure access to their CNIC details.
Maruthi Prithivirajan, Head of ASEAN & IN Solution Architecture, Neo4j
Get an inside look at the latest Neo4j innovations that enable relationship-driven intelligence at scale. Learn more about the newest cloud integrations and product enhancements that make Neo4j an essential choice for developers building apps with interconnected data and generative AI.
UiPath Test Automation using UiPath Test Suite series, part 6DianaGray10
Welcome to UiPath Test Automation using UiPath Test Suite series part 6. In this session, we will cover Test Automation with generative AI and Open AI.
UiPath Test Automation with generative AI and Open AI webinar offers an in-depth exploration of leveraging cutting-edge technologies for test automation within the UiPath platform. Attendees will delve into the integration of generative AI, a test automation solution, with Open AI advanced natural language processing capabilities.
Throughout the session, participants will discover how this synergy empowers testers to automate repetitive tasks, enhance testing accuracy, and expedite the software testing life cycle. Topics covered include the seamless integration process, practical use cases, and the benefits of harnessing AI-driven automation for UiPath testing initiatives. By attending this webinar, testers, and automation professionals can gain valuable insights into harnessing the power of AI to optimize their test automation workflows within the UiPath ecosystem, ultimately driving efficiency and quality in software development processes.
What will you get from this session?
1. Insights into integrating generative AI.
2. Understanding how this integration enhances test automation within the UiPath platform
3. Practical demonstrations
4. Exploration of real-world use cases illustrating the benefits of AI-driven test automation for UiPath
Topics covered:
What is generative AI
Test Automation with generative AI and Open AI.
UiPath integration with generative AI
Speaker:
Deepak Rai, Automation Practice Lead, Boundaryless Group and UiPath MVP
zkStudyClub - Reef: Fast Succinct Non-Interactive Zero-Knowledge Regex ProofsAlex Pruden
This paper presents Reef, a system for generating publicly verifiable succinct non-interactive zero-knowledge proofs that a committed document matches or does not match a regular expression. We describe applications such as proving the strength of passwords, the provenance of email despite redactions, the validity of oblivious DNS queries, and the existence of mutations in DNA. Reef supports the Perl Compatible Regular Expression syntax, including wildcards, alternation, ranges, capture groups, Kleene star, negations, and lookarounds. Reef introduces a new type of automata, Skipping Alternating Finite Automata (SAFA), that skips irrelevant parts of a document when producing proofs without undermining soundness, and instantiates SAFA with a lookup argument. Our experimental evaluation confirms that Reef can generate proofs for documents with 32M characters; the proofs are small and cheap to verify (under a second).
Paper: https://eprint.iacr.org/2023/1886
zkStudyClub - Reef: Fast Succinct Non-Interactive Zero-Knowledge Regex Proofs
GIS Applications for Tornado Damage Visualization
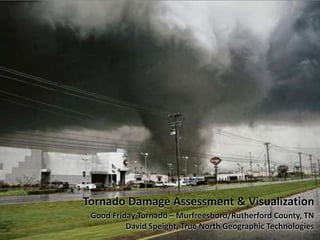
1. Tornado Damage Assessment & Visualization Good Friday Tornado – Murfreesboro/Rutherford County, TN David Speight, True North Geographic Technologies
2. FINAL SUMMARY (TIMES BASED ON RADAR)...STRENGTH...EF-4MAXIMUM WINDS...170 MPHPATH LENGTH...23.25 MILESWIDTH...MAXIMUM 750 YARDSTOUCHDOWN TIME...1219 PMTORNADO END TIME...1255 PM
3.
4.
5. Airport EOC MTSU 911 Special Ops Courthouse (OIT) ArcGIS Server ArcSDE Image Server Initial Estimated Damage Path
6. GIS Response Timeline Friday Afternoon (April 10, 2009) Prep for damage assessment data collection during the initial response phase Friday Evening – Sunday Evening Perform data entry for initial damage reports Create mapping tools for the EOC Sunday Morning Imagery for damage path acquired Monday – Friday Continue data entry/scrubbing for damage reports Monday Afternoon Receive new imagery; publish using AGS/Image Server Locate unassessed damage using new imagery Thursday Afternoon Roll out public information website
14. Public Information Site Property damage general Info Minimize public presence in damage area
15. What Worked Data collection prep GIS manager & techs @ Courthouse GIS public safety tech @ EOC Editing via remote desktop to Courthouse ArcSDE database for multi-editor feature classes ArcGIS Server/Image Server Able to construct map services & reuse for multiple applications Able to use existing map services from other agencies Able to quickly turn around new imagery & incorporate into web application Flex viewer Quick, easy access to essential data Provided EMA staff with up-to-the-minute progress info on damage estimates Flex API Stood up public facing web site within a week of event Powerful visualization tools
16. What Can Be Improved (technically) ? Data collection prep Emergency response data model Maps – editing/publishing Web dashboards Have a plan for document/photo management Data collection Eliminate paper & manual data entry Multiple mobile options Use cameras with geotagging capability Data integration Prepare existing systems to share data easily GeoRSS, XML, WMS, KML, web services