This document describes a bioinformatics tool that predicts gene expression in cancer using copy number alterations and methylation data as predictors in a linear model. The tool was created using data from The Cancer Genome Atlas and the R programming language. It analyzes specific cancers to identify oncogenes and tumor suppressor genes that are relevant to those cancers, and determines which genetic or epigenetic factors drive the expression of those genes. The tool provides comprehensive analysis of individual genes and ranks their relevance to different cancers. It allows researchers to efficiently understand disease-specific gene expression and identify additional genes involved in cancer.
Now a day’s, pharma research is facing challenges in
deciphering molecular understanding of disease initiation,
progress and establishment as well as performance
assessment of drug molecule on such phases of disease
development. Emerging of next generation sequencing
bases molecular tools were found to be a key method for
creating genome wide genomics landscape of gene
mutations, gene expression and gene regulation events.
Although NGS is a powerful tool for molecular research but
same time it have its own technical challenges. Few major
challenges of NGS based pharmacogenomics is
summarized below
Presentation by Scott Woodman, MD, PhD. Presented at the 2018 Eyes on a Cure: Patient & Caregiver Symposium, hosted by the Melanoma Research Foundation's CURE OM initiative.
A Classification of Cancer Diagnostics based on Microarray Gene Expression Pr...IJTET Journal
inAbstract— Pattern Recognition (PR) plays an important role in field of Bioinformatics. PR is concerned with processing raw measurement data by a computer to arrive at a prediction that can be used to formulate a decision to be taken. The important problem in which pattern recognition are applied have common that they are too complex to model explicitly. Diverse methods of this PR are used to analyze, segment and manage the high dimensional microarray gene data for classification. PR is concerned with the development of systems that learn to solve a given problem using a set of instances, each instances represented by a number of features. The microarray expression technologies are possible to monitor the expression levels of thousands of genes simultaneously. The microarrays generated large amount of data has stimulate the development of various computational methods to different biological processes by gene expression profiling. Microarray Gene Expression Profiling (MGEP) is important in Bioinformatics, it yield various high dimensional data used in various clinical applications like cancer diagnostics and drug designing. In this work a new schema has developed for classification of unknown malignant tumors into known class. According to this work an new classification scheme includes the transformation of very high dimensional microarray data into mahalanobis space before classification. The eligibility of the proposed classification scheme has proved to 10 commonly available cancer gene datasets, this contains both the binary and multiclass data sets. To improve the performance of the classification gene selection method is applied to the datasets as a preprocessing and data extraction step.
As an uncommon malignant tumor, hypopharyngeal cancer accounts for 3–5% of head and neck tumors [1]. Most pathological types of hypopharyngeal cancer are squamous cell carcinoma. Due to the occult anatomical location of hypopharyngeal cancer and poor surgical effect, local recurrence or distant metastasis often occurs in patients with hypopharyngeal cancer following surgery.
Presentation for Network Biology SIG 2013 by Thomas Kelder, Bioinformatics Scientist at TNO in The Netherlands. “Functional Network Signatures Link Anti-diabetic Interventions with Disease Parameters”
Presentation at the Canadian Cancer Research Conference satellite bioinformatics.ca workshop. This one is an introduction to tcga, icgc and cosmic databases.
An infographics about Web Design Trends done by Web Imp. We analyze all of our clients and this is what we found out.
Read the original article at https://www.webimp.com.sg/blog/2015/12/top-6-web-design-trends-in-2015/
My Final Presentation about Ed Tech 1 and 2. Jermaine Dabon
My over-all collections about what we have in our subject which is Educational Tech 1 and 2. BSEd- III HET from Cebu Technological University Moalboal, Cebu Moalboal Campus.
Angelika has shared amongst #passion4digital hashtag on Twitter all her findings within the Digital and Social Media Marketing MOOC on the iversity website.
Abbrevia, fondata a Trento nel 2006, è una società
specializzata nella valutazione investigata di clienti e
partner commerciali e nelle indagini finalizzate a individuare
la reperibilità e la consistenza economica e patrimoniale di
persone e aziende.
An understanding towards genetics and epigenetics is essential to cope up with the paradigm shift which is underway. Personalized medicine and gene therapy will confluence the days to come.
This review highlights traditional approaches as well as current advancements in the analysis of the gene expression data from cancer perspective.
Due to improvements in biometric instrumentation and automation, it has become easier to collect a lot of experimental data in molecular biology.
Analysis of such data is extremely important as it leads to knowledge discovery that can be validated by experiments. Previously, the diagnosis of complex genetic diseases has conventionally been done based on the non-molecular characteristics like kind of tumor tissue, pathological characteristics, and clinical phase.
The microarray data can be well accounted for high dimensional space and noise. Same were the reasons for ineffective and imprecise results. Several machine learning and data mining techniques are presently applied for identifying cancer using gene expression data.
While differences in efficiency do exist, none of the well-established approaches is uniformly superior to others. The quality of algorithm is important, but is not in itself a guarantee of the quality of a specific data analysis.
http://kaashivinfotech.com/
http://inplanttrainingchennai.com/
http://inplanttraining-in-chennai.com/
http://internshipinchennai.in/
http://inplant-training.org/
http://kernelmind.com/
http://inplanttraining-in-chennai.com/
http://inplanttrainingchennai.com/
Mining of Important Informative Genes and Classifier Construction for Cancer ...ijsc
Microarray is a useful technique for measuring expression data of thousands or more of genes simultaneously. One of challenges in classification of cancer using high-dimensional gene expression data is to select a minimal number of relevant genes which can maximize classification accuracy. Because of the distinct characteristics inherent to specific cancerous gene expression profiles, developing flexible and robust gene identification methods is extremely fundamental. Many gene selection methods as well as their corresponding classifiers have been proposed. In the proposed method, a single gene with high classdiscrimination capability is selected and classification rules are generated for cancer based on gene expression profiles. The method first computes importance factor of each gene of experimental cancer dataset by counting number of linguistic terms (defined in terms of different discreet quantity) with high class discrimination capability according to their depended degree of classes. Then initial important genes are selected according to high importance factor of each gene and form initial reduct. Then traditional kmeans clustering algorithm is applied on each selected gene of initial reduct and compute missclassification errors of individual genes. The final reduct is formed by selecting most important genes with respect to less miss-classification errors. Then a classifier is constructed based on decision rules induced by selected important genes (single) from training dataset to classify cancerous and non-cancerous samples of experimental test dataset. The proposed method test on four publicly available cancerous gene expression test dataset. In most of cases, accurate classifications outcomes are obtained by just using important (single) genes that are highly correlated with the pathogenesis cancer are identified. Also to prove the robustness of proposed method compares the outcomes (correctly classified instances) with some existing well known classifiers.
MINING OF IMPORTANT INFORMATIVE GENES AND CLASSIFIER CONSTRUCTION FOR CANCER ...ijsc
Microarray is a useful technique for measuring expression data of thousands or more of genes
simultaneously. One of challenges in classification of cancer using high-dimensional gene expression data
is to select a minimal number of relevant genes which can maximize classification accuracy. Because of the
distinct characteristics inherent to specific cancerous gene expression profiles, developing flexible and
robust gene identification methods is extremely fundamental. Many gene selection methods as well as their
corresponding classifiers have been proposed. In the proposed method, a single gene with high classdiscrimination
capability is selected and classification rules are generated for cancer based on gene
expression profiles. The method first computes importance factor of each gene of experimental cancer
dataset by counting number of linguistic terms (defined in terms of different discreet quantity) with high
class discrimination capability according to their depended degree of classes. Then initial important genes
are selected according to high importance factor of each gene and form initial reduct. Then traditional kmeans
clustering algorithm is applied on each selected gene of initial reduct and compute missclassification
errors of individual genes. The final reduct is formed by selecting most important genes with
respect to less miss-classification errors. Then a classifier is constructed based on decision rules induced
by selected important genes (single) from training dataset to classify cancerous and non-cancerous samples
of experimental test dataset. The proposed method test on four publicly available cancerous gene
expression test dataset. In most of cases, accurate classifications outcomes are obtained by just using
important (single) genes that are highly correlated with the pathogenesis cancer are identified. Also to
prove the robustness of proposed method compares the outcomes (correctly classified instances) with some
existing well known classifiers.
Interrogating differences in expression of targeted gene sets to predict brea...Enrique Moreno Gonzalez
Genomics provides opportunities to develop precise tests for diagnostics, therapy selection and monitoring. From analyses of our studies and those of published results, 32 candidate genes were identified, whose expression appears related to clinical outcome of breast cancer. Expression of these genes was validated by qPCR and correlated with clinical follow-up to identify a gene subset for development of a prognostic test.
Clustering Approaches for Evaluation and Analysis on Formal Gene Expression C...rahulmonikasharma
Enormous generation of biological data and the need of analysis of that data led to the generation of the field Bioinformatics. Data mining is the stream which is used to derive, analyze the data by exploring the hidden patterns of the biological data. Though, data mining can be used in analyzing biological data such as genomic data, proteomic data here Gene Expression (GE) Data is considered for evaluation. GE is generated from Microarrays such as DNA and oligo micro arrays. The generated data is analyzed through the clustering techniques of data mining. This study deals with an implement the basic clustering approach K-Means and various clustering approaches like Hierarchal, Som, Click and basic fuzzy based clustering approach. Eventually, the comparative study of those approaches which lead to the effective approach of cluster analysis of GE.The experimental results shows that proposed algorithm achieve a higher clustering accuracy and takes less clustering time when compared with existing algorithms.
Developing a framework for for detection of low frequency somatic genetic alt...Ronak Shah
Cancer is a complex, heterogeneous disease of the genome. Most cancers result
from an accumulation of multiple genetic alterations that lead to dysfunction of cancer-associated
genes and pathways. Recent advances in sequencing technology have enabled comprehensive
profiling of genetic alterations in cancer. We have established a targeted sequencing platform
(IMPACT: Integrated Mutation Profiling of Actionable Cancer Targets) using hybridization capture and
next-generation sequencing (NGS) technology, which can reveal mutations, indels and copy number
alterations involving 340 cancer related genes.
EFFICACY OF NON-NEGATIVE MATRIX FACTORIZATION FOR FEATURE SELECTION IN CANCER...IJDKP
Over the past few years, there has been a considerable spread of microarray technology in many biological patterns, particularly in those pertaining to cancer diseases like leukemia, prostate, colon cancer, etc. The primary bottleneck that one experiences in the proper understanding of such datasets lies in their dimensionality, and thus for an efficient and effective means of studying the same, a reduction in their dimension to a large extent is deemed necessary. This study is a bid to suggesting different algorithms and approaches for the reduction of dimensionality of such microarray datasets.This study exploits the matrix-like structure of such microarray data and uses a popular technique called Non-Negative Matrix Factorization (NMF) to reduce the dimensionality, primarily in the field of biological data. Classification accuracies are then compared for these algorithms.This technique gives an accuracy of 98%.
EFFICACY OF NON-NEGATIVE MATRIX FACTORIZATION FOR FEATURE SELECTION IN CANCER...IJDKP
Over the past few years, there has been a considerable spread of microarray technology in many
biological patterns, particularly in those pertaining to cancer diseases like leukemia, prostate, colon
cancer, etc. The primary bottleneck that one experiences in the proper understanding of such datasets lies
in their dimensionality, and thus for an efficient and effective means of studying the same, a reduction in
their dimension to a large extent is deemed necessary. This study is a bid to suggesting different algorithms
and approaches for the reduction of dimensionality of such microarray datasets.This study exploits the
matrix-like structure of such microarray data and uses a popular technique called Non-Negative Matrix
Factorization (NMF) to reduce the dimensionality, primarily in the field of biological data. Classification
accuracies are then compared for these algorithms.This technique gives an accuracy of 98%
Clinical Assessment In Incorporating a Personal GenomeDiego Herrera
This presentation goes in-depth in the growing field of personal genome sequencing. The advances in high-throughput DNA sequencing has made the process of mapping structural deviations in an individual's genetic totality more economical. The advantages in health care makes this technology more like to be fully integrated in medicine within the next ten years.
1. Predicting Gene Expression By Copy Number Alterations and
Methylation Data in Cancer
Abstract
Cancer cells harm the body through proliferation, caused by (epi)-genetic
mutations or factors, such as copy number alterations and methylation changes
influencing genetic activity through differential gene expression. Cancer is driven by
irregular expression of certain oncogenes that alter the cell cycle, cause proliferation, or
inhibit normal function.
To investigate these oncogenes, I created a bioinformatics tool to model
oncogene expression as a linear model predicted by copy number and methylation. The
statistical model identifies oncogenes and tumor-suppressor genes relevant to specific
cancers and which (epi)-genomic factors drive their expression. It extracts the latest live
data and selects only relevant copy number data and methylation clusters in analysis,
increasing accuracy of the expression model.
We used the R programming language to package the model, using data from
The Cancer Genome Atlas (TCGA), a cancer database, to retrieve expression data.
Starting with glioblastoma and rapidly expanding to include all cancers in TCGA, I
developed a program that summarizes the disease by genes most instrumental to its
expression and offers a comprehensive individual analysis per gene. A ranking
algorithm sorts genes by relevance and displays influencing factors. Conclusions about
disease-specific gene expression can be quickly derived with this package.
2. 1
Predicting Gene Expression By Copy Number Alterations and
Methylation Data in Cancer
1 INTRODUCTION
Cancer is a life-threatening disease that kills over 20,000 people every day. Multiple
types of cancers exist and they can strike at any part of the body. Cancer is caused by irregular
gene expression, and genes control all functions of the body.1
Certain cancer-causing genes,
labeled as oncogenes when mutated to inhibit normal function, can lead to unwanted cell
proliferation, cell-cycle irregularities, and tumor progression when activated. It is important to
identify these oncogenes; however, cancer is a very general term for multiple specific diseases
and specific cancers have different oncogenes that control their expression. Our goal is to find a
way to identify a wide array of these oncogenes and their level of impact on a specific cancer. It
is also desired to find which genetic or epigenetic factors control the expression of these
oncogenes.
Throughout the field of cancer biology, researchers search for genes that control
cancerous mechanisms, such as cell cycle acceleration, proliferation, and malignant behavior.
Many advances have been made in the field with regard to finding these oncogenes, and targeted
drug delivery to inhibit the activity of these oncogenes has greatly increased life expectancy for
cancer.2
The death rate due to cancer goes down each year due to medicinal advancement and the
discovery of these important oncogenes.3
Bioinformaticians have studied cancer using the wide
variety of data available in databases spanning the world wide web. Many databases, websites,
and critical papers have investigated the role of specific genes in specific cancers, allowing for
medicinal treatment and drug delivery to accommodate for these genes and greatly improve
preventive treatment.4
This data analysis is huge to the field of cancer, as without targeted gene
analysis new cancer-causing pathways and mechanisms would not be discovered. In lieu of this
3. 2
information, we decided to create a comprehensive tool that studies gene expression using
genetic or epigenetic predictors to ultimately provide a comprehensive gene analysis that
pinpoints the most important oncogenes in any given cancer and understand their expression.
Further research can be applied on these genes of high importance in cancer to facilitate cancer
research and improve gene-targeted drug delivery to cure various forms of cancer. We aim to
create a product that can help to identify more of the many genes listed as cancer biomarkers.5
A bioinformatics package was created to model oncogene expression in cancer. Gene
expression was modeled with a linear fit, using copy number alterations and methylation data as
predictors for the model. Copy number alterations specifically refer to the amount of copies of
the gene relative to its expression. We retrieve this data through a GISTIC analysis of raw copy
number data.6
Methylation is an epigenetic factor that controls gene expression by attaching a
methyl-group to a CpG site, commonly located on the promoter region of the gene, which
compresses the DNA and generally inhibits transcription.7
Raw human methylation data with
general consensus clustering is used to study methylation directly related to these oncogenes.
Methylation can also be modeled using MethylMix, an algorithm which uses differential
and functional methylation states to group methylation into clusters.8
Gene expression can be
mapped using mRNA sequencing data (mRNAseq) or gene expression microarray data, both
standard ways to acquire gene expression data from patients.
The package acquires this wealth of data from The Cancer Genome Atlas (TCGA). The
Cancer Genome Atlas is a source that is home to data from over 30 cancers and compiles genetic
data retrieved from multiple patients. TCGA is where the methylation, copy number, and gene
expression data are retrieved. The use of the R programming language for statistics was essential
in the creation of this package. The finished package will be released for users to enter the cancer
4. 3
on which they desire to conduct research and to request the types of expression and methylation
data they want. The package allows users to quickly come to conclusions on which oncogenes
drive which cancers, and whether copy number, methylation, or both predictors drive the
expression of these oncogenes. The R package, once completed, will be released on
Bioconductor,9
a home for bioinformaticians to release software and will be available to any user
who quickly wants to come to conclusions on oncogenes in cancers.
For users, the package will run using the following general pipeline: The datasets, with
the specific types of data they desire for methylation and gene expression, will be downloaded
securely and locally to their hard drive, where a series of preprocessing steps will occur,
including batch correction, missing value estimation, and patient matching for multiple datasets.
A pool of genes of interest is extracted from the datasets, applying a variance filter to select a
percent of genes specified by the user. A linear model is applied to these genes, combining only
relevant and statistically significant parts of the model for each gene to ensure the most accurate
predictive model for the gene and its drivers. Copy number alterations are added to the model by
relevance and relevant methylation clusters are combined in a linear combination to produce the
final methylation coefficient. Only relevant components of the expression model of the gene,
whether it is copy number alterations, methylation clusters, or both, are included in the
individual gene model. In this manner, extremely accurate and unique models are created for
each gene of interest for a given cancer.
It was decided to run our software on glioblastoma (GBM), a rare yet well-documented
brain cancer, to compare the results retrieved from our package to established results on the
disease. The package then was quickly expanded to be able to implement the model on all
cancers available through TCGA. The code produces individual gene graphs, presents raw data,
5. 4
and shows a full disease summary view, indicating the most important genes for specific cancers
and how they are driven. The disease summary allows users to see incredibly accurate models for
expression that are fitted for multiple genes of interest and show how a specific cancer is being
driven as a whole, making it a great tool to find genes in cancers for further research.
Overall, the model was a success in finding genes relevant to the expression of GBM. It
is able to differentiate between genes driven only by copy number alterations, by methylation
clusters, or both. The package is still under development and it will be released soon. In future
updates to the software, more complex, higher dimensional models may be used. 3D graphs may
be used to display these complex gene models, and new predictors may accompany copy number
and methylation as drivers for the expression model. A grounds-up, simple approach to creating
a gene overview tool for cancers is necessary and is now implemented through using data from
TCGA and analysis via the R programming language.
2 MATERIALS AND METHODS
The expression model using copy number and methylation as predictors is implemented
as a user package rather than a 1-time analysis of genes. As such, the methods outlined here can
be thought of as a pipeline that the package goes through upon its execution rather than a
traditional procedure.
2.1 Downloading Data
A designated R script is used to dynamically download data from the Broad Institute’s
TCGA server. I initially wrote the script using the Broad Institute’s Firehose tool to acquire the
data, but a graduate student updated the script to use curl and wget commands to retrieve data
from Broad Institute URLs; the script can retrieve all the files we need to process and analyze.
There are two types of data the user can select from for gene expression, which are mRNAseq
6. 5
data and microarray data. Selections for methylation data include raw clustered methylation and
MethylMix data. Copy number data used in the model are raw data run through a GISTIC
analysis. The user decides for which cancer to retrieve data, and by the end of the downloading
phase, expression, copy number, and methylation datasets are locally stored on the user’s
computer.
2.2 Preprocessing
While the datasets are retrieved, many steps of preprocessing must be achieved to get the
datasets ready for analysis. All these separate processes are stored in separate datasets so the user
has access to the raw data at every step. A series of scripts written by my mentor processes the
data to move to the next step. The code begins by estimating missing values using the k-nearest-
neighbor method. A 10% threshold of missing values is used to determine whether to eliminate a
gene or patient from the dataset. Standard TCGA batch correction is done on the resulting dataset
to normalize patient data across multiple facilities of data collection. I also had to accommodate
for mismatched patients and genes to ensure modeling is accurate across those multiple datasets.
The algorithm only tests patients with a pure form of the cancer, so I had to remove pan-cancer,
metastatic, and healthy control patients. After these steps, the data are ready for linear modeling
analysis.
2.3 Linear Modeling of Genomic and Epigenomic Data
After the data are ready, the program starts analysis by selecting a pool of genes, which
we label as the genes of interest, given a user prompt for the percentage of total genes available.
To select genes of interest, a filter that maximizes data information regarding deviation, such as
variance, interquartile range, and mean absolute deviation, sorts all genes. The code selects a
percent of all genes to be the genes of interest based on user input. Individual gene analysis is
7. 6
performed on these genes. The variance filter is a very basic and fast way to generally take a
percent of genes for analysis.
The linear model for expression (EXP) using copy number (CN) and methylation (MET)
as predictors can be easily interpreted as a linear combination of beta values for copy number
alterations and methylation data for each gene, and can be stated as follows.
EXP GENE = β1 * CN GENE + β2 * MET GENE .
The linear model executes by splitting itself up into its two-dimensional components and
combining the statistically significant beta values into the above equation. The first step in this
process is to model expression based on copy number and methylation separately:
EXP GENE = β1 * CN GENE , EXP GENE = β2 * MET GENE .
The copy number portion of the model is rendered separately, and if the beta values of
this separate regression are significant, this beta is included in the overall model for gene
expression. On the other hand, methylation has another nuance in clusters. The separate model
for expression based on methylation can be modeled as a linear combination of the different n
methylation clusters for each gene as shown here:
EXP GENE =
C=1
n
å β2-ClusterC * MET GENE-ClusterC .
A linear regression is applied on the clustered methylation model and significant
coefficients are included in a second regression model for methylation, including only significant
beta values. A linear regression is applied on the subsequent equation to retrieve fitted values.
The linear coefficient for these fitted values can be determined as the significant beta value for
methylation as a whole. So, the linear model can now be summed up in the following simple
equation based on significance:
EXP GENE = β1-signif * CN GENE + β2-signif * MET GENE .
8. 7
If an entire driver, whether it be copy number or methylation, is insignificant, the final
model will simply be rendered without that driver. Sometimes both copy number and
methylation data are completely insignificant, implying that the gene has little to no role in
cancer. In this way, we have created a powerful tool that lists the most significant genes and how
they are expressed, creating a unique model for each and every gene.
The beta values are filled in once the regression is applied. For a high correlation with a
gene to a specific cancer, we look for low p-values and r-squared values, statistics associated
with linear regression. Throughout the process of evaluation for statistical significance, we use a
p-value filter determined by the user to remove statistically insignificant parts of the model. The
p-value is associated with the accuracy of the model, or how close the actual values are to the
fitted values of the regression model. The r-squared value refers to the coverage of the model, or
how well the fit corresponds to all data points. We look for low p-values and high r-squared
values to determine statistical significance of a gene in a given cancer.
In user interpretation of these linear models, one would look for positive copy number
coefficients and negative methylation coefficients. Recalling that copy number refers to the
number of copies of the gene and methylation refers to the protection of the gene, one can
interpret that copy number and methylation must have positive and negative correlations on gene
expression. However, due to the epigenetic and undiscovered true nature of methylation, we
leave this part of the model up to interpretation.
2.4 Data Visualization
Users can see results instantaneously upon visualizing the data generated. Three ways to
visualize the data are available through this package, designed to work together to understand
gene expression in any given cancer.
9. 8
All raw data are shown, and users can see whether genes are driven by copy number,
methylation, or both. The user can also see graphs of individual gene-by-gene analysis, which
shows the linear fit line across copy number and methylation and displays correlation statistics of
the gene. A disease summary allows the user to see how genes are being driven across the entire
disease. It also shows the genes with the highest statistical correlation in the dataset.
I created these data visualization tools using the R package ggplot2, a graphics engine
that allows for several types of data visualization.
3 RESULTS
All results displayed here are run on the brain cancer glioblastoma using microarray data
for gene expression, GISTIC data for copy number alterations, and MethylMix for methylation
clusters. However, the pipeline can be run on any disease, with options for types of data in
expression and methylation.
10. 9
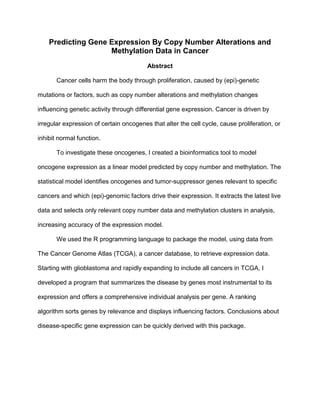
3.1 Individual Gene Analysis
Graphs are printed of the linear regression of individual genes. Plotting the regression is
the fastest way to quickly obtain a visualization of the gene. This example shows a model for
expression based on only methylation for the gene FABP5, which controls fatty acids and
regulates control of growth factors.10
Without proper gene expression, the cell’s growth factor
communication may lose control, resulting in cancerous tumor growth.
Figure 1: Modeling expression by methylation in FABP5. Noticing the 59% coverage as indicated by the r-squared
value, we can infer that this gene is being downregulated by methylation in glioblastoma patients.
11. 10
EGFR is a growth factor involved in cell division and proliferation, and it tends to have a high
correlation with copy number in many cancers, including glioblastoma.11
Figure 2: Individual gene analysis of EGFR in glioblastoma. This gene holds a statistical correlation for copy
number and MethylMix methylation. As the two separate models (blue) are combined (red), we can see that this
gene is driven by copy number alteration.
12. 11
PDLIM4 is a gene that is heavily methylated in several cancers, and its repression due to this
hypermethylation is listed as a biomarker for several cancers.
Figure 3: Individual gene analysis of PDLIM4, an actin protein coding gene, in glioblastoma. This gene holds a
statistical correlation for copy number and MethylMix methylation. As the two separate models (blue) are combined
(red), we can see that this gene is driven by copy number alteration.
13. 12
3.2 Raw Linear Model Data
The raw data shows accuracy and scope of the expression model with relation to copy
number alterations, methylation data, or both predictors. In this chart, analysis of raw data has
been done to see if genes driven by copy number, methylation, or both factors. All of these genes
have both copy number and methylation rendered as significant, or higher than the p-value filter
(default p-value filter is < 0.05).
Figure 4: Linear Model Data – Users are given all the raw data for genes of interest in glioblastoma. Combining
copy number and methylation into one model facilitates analysis of drivers for gene expression. (0* indicates value
<1 e-10)
3.3 Disease Summary
The disease summary describes in a holistic view how the disease is being driven. A pie
chart displays the genes driven by copy number, methylation, or both factors, and a percent of
genes will be labeled insignificant. Sorting the genes of interest by relevance can show the most
important genes for any cancer. Because of the selection for only relevant clusters, we can
14. 13
eliminate a number of genes as insignificant, and we can accurately and precisely model the
expression of important genes, as shown in the disease summary.
Figure 5: Pie chart showing drivers for significant genes of a pool of genes of interest in glioblastoma.
The model maximizes the number of genes that are not significant by selecting for the most significant
coefficients, allowing for a wider spread of genes. 73% of genes all have unique models, as shown here.
15. 14
Figure 5: Top genes listed in a disease summary for glioblastoma. At a glance, users can see genes sorted by
relevance for any given cancer. Relevance is denoted using the r-squared value.
4 DISCUSSION
Through the three visualization tools of the linear model software, we can find the most
important genes in a cancer, visualize them separately, determine the dominant factor in these
oncogenes, and get a glimpse of how the disease is driven overall.
In executing only methylation or copy number values, we can see easily how the gene is
being driven. For example, methylation in FABP5 is downregulating gene expression, as it
should according to the traditional view of methylation blocking transcription. We can then infer
that, because FABP5 has a large 59% coverage and a very low p-value, that methylation in
FABP5 could be instrumental to the regulation of GBM and should require further research.
EGFR and PDLIM4 in glioblastoma are examples of linear models that incorporate both
copy number alteration and methylation clusters. We can see that EGFR has a strong correlation
in copy number and methylation, but its relevance is much higher with copy number than with
methylation. If EGFR was studied with just copy number or methylation, we would not be able
16. 15
to see the copy number dominate the expression of EGFR as in the combined model. Similarly,
in PDLIM4, we see methylation as the ultimate driver for expression after the copy number and
methylation models are combined.
The separate copy number and methylation models can also work together and promote
synergy, as shown in the raw data for PDGFRA. We can see the relevance of the model increase
from 41% in methylation and 22% in copy number to 55% overall in the combined model. This
synergy shows an inherent strength in the model to combine components and increase accuracy
and relevance of the model.
Summarizing the disease based on its drivers allows us to see the overall expression of
the disease. It also shows the package’s efficacy in combining models, producing 25% of models
as combined models with copy number and methylation. By selecting only for relevant parts of
the model, the model also inherently selects for the relevant genes, allowing the code to
maximize the number of irrelevant genes and permitting the user to focus on the genes that have
statistical relevance to the cancer.
5 CONCLUSIONS AND FUTURE WORK
Overall, the linear model package is a simple yet effective way to model gene expression
in cancer. It allows us to come to striking conclusions by analyzing data available on TCGA in
real time. The package provides a comprehensive view of genes with a strong correlation to other
specific factors, which allows users to find and continue research on unexplored genes that are
found using this tool. Mechanisms related to these undiscovered genes with high correlation to
copy number, methylation, or both factors can be explored to study the reason for specific
cancers and to ultimately invert the mechanism and do a better job treating cancer.
17. 16
Simple and comprehensive as the linear model is, it has its faults. For example,
exponential, logarithmic, polynomial, and otherwise nonlinear relationships between gene
expression and copy number alterations or methylation data can go unnoticed. In the future, these
complex relationships can be added to find more genes that have strong correlations to cancer.
We intend to add 3D modeling to gene-by-gene graphs to visualize the linear fit as a
plane equation spanning in the areas of copy number and methylation. More predictors to
analyze gene expression such as miRNA may be included in the model in the future to give more
factors to gene expression and make the model more accurate.13
These more complex higher-
dimensional models allow more places for strong statistical correlations between gene expression
and its predictors, and allow multiple statistically significant predictors to work together in
synergy.
Creating the software package from scratch was a great way to explore the field of
bioinformatics. By providing data analysis tools, I learned more about the biological and
statistical concepts of this field. My lab provided the introduction and the framework necessary
for my understanding on how to create this product, and through this background, I built a
powerful product that can service the bioinformatics field.
In summation, we modeled gene expression as a linear model using copy number and
methylation, and the result is a fast, elegant, and comprehensive way to find important
oncogenes and analyze their behavior and impact on any given cancer.