Received January 29,2021, accepted March 3, 2021, date of publication March 8, 2021, date of current version March 15,
2021.
Digital Object Identifier 10.1109/ACCESS.2021.3064390
Gesture Recognition With
Ultrasounds and Edge Computing
BORJA SAEZ 1, JAVIER MENDEZ1, MIGUEL MOLINA1, ENCARNACIÓN
CASTILLO
2,
MANUEL PEGALAJAR3, AND DIEGO P
. MORALES
2
1 Infineon Technologies AG, 85579 Neubiberg, Germany
2 Department of Electronics and Computer Technology, University of Granada, 18071 Granada, Spain
3 Department of Computer Science and Artificial Intelligence, University of Granada, 18071 Granada, Spain
Corresponding author: Borja Saez (borja.saezmingorance@infineon.com)
This work was supported in part by the context of the project SILENSE under EU Project 737487 and under German Project
16ESE0161K, in part by the European Union’s Horizon 2020 Programme (ECSEL), and in part by the German Federal Ministry of
Education and Research (BMBF), Germany—National Authorities.
ABSTRACT The aim of this work is to prove that it is possible to develop a system able to detect gestures
based only on ultrasonic signals and Edge devices. A set of 7 gestures plus idle has been defined, being
possible to combine them to increase the recognized gestures. In order to recognize them, Ultrasound
transceivers will be used to detect the 2 dimensional gestures. The Edge device approach implies that
the whole data is processed in the device at the network edge rather than depending on external devices
or services such as Cloud Computing. The system presented in this paper has been proven to be able to
measure Time of Flight (ToF) signals that can be used to recognize multiple gestures by the integration of
two transceivers, with an accuracy between 84.18% and 98.4%. Due to the optimization of the
preprocessing correlation technique to extract the ToF from the echo signals and our specific firmware
design to enable the parallelization of concurrent processes, the system can be implemented as an Edge
Device.
INDEX TERMS Edge computing, gesture recognition, human system interaction (HSI), ultrasound.
I. INTRODUCTION
The communication among humans is based on a
multi-modal system, which includes not only verbal
commu- nication but also face and body expressions to
intensify the meaning of the verbal content. The Human
System Interac- tion (HSI) trend is evolving, leading to the
research of emerg- ing technologies that mimic this
natural communication, minimizing the use of interfaces
like touchscreens, buttons or sliders. Well known virtual
personal assistants such as Alexa or Siri, developed by
Amazon and Apple respectively which allow communication
with the system using only voice commands. There are
also several systems that introduce gesture control to the
system, i.e. SoundWave [1], AudioGest [2], Dolphin [3], or
UltraGesture [4]. All of them use low frequency
ultrasound signals to recognize between 5 and 12
gestures, which are mostly based on Doppler shift effect
(frequency variation due to movement) while running the
recognition algorithms on PC or Smartphones.
This work is licensed under a Creative Commons Attribution 4.0 License. For more information, see
https://creativecommons.org/licenses/by/4.0/
38999
VOLUME 9,
2021
The associate editor coordinating the review of this manuscript
and approving it for publication was Maurizio Tucci.
The aim of this work is to prove the possibility to develop
a system able to detect gestures based only on ultrasonic
signals and to execute the signal processing in Edge devices,
without using neither a PC nor a cloud environment. For
testing, a set of 7 gestures plus idle has been defined, being
possible to combine them to increase the recognized
gestures. In order to recognize them, 2 transceivers will be
used, since it is the minimum number of transceivers
required to detect 2 dimensional gestures.
This device works as an active sonar system: it transmits
ultrasonic waveforms, which are reflected back when they
collide with any solid obstacle, to its environment. Then the
transceivers receive these indirect echo signals in order to
locate the echo produced by the obstacle. The transceivers
are located on the same device. Thanks to this, it does not
need an external synchronization signal to get the time-of-
flight (ToF) value, which is the time between the transmitted
signal emission and the echo signal reception. These mea-
surements enable the system to have a great resolution in
the depth dimension due to the direct relation between time-
of-flight and the distance between the reflector object and
2.
B. Saez etal.: Gesture Recognition With Ultrasounds and Edge
Computing
the system. This is an advantage over 2D cameras or Electric
Near Field sensors, which are more sensitive to noise and
need to infer the distance from the strength of the received
signals. However, it has low positioning accuracy when it
comes to the lateral range. In spite of higher processing
time, it could be solved by adding more devices to the
system, getting a combination of time-of-flights estimations
between them.
This article is structured as follows: Section II introduces
the state of the art in Ultrasound technologies for gesture
recognition and the advantages of use Edge Computing for
this purpose. Section III explains in detail the system devel-
oped in this work, as well as the firmware developed for the
signal acquisition and ToF calculation. Section IV describes
the gestures defined for the experiment and the algorithms
studied for the recognition and classification. Section V sum-
marizes the results obtained. Finally, Section VI focuses on
conclusions of this work.
39000 VOLUME 9,
2021
II. PRIOR WORK/STATE OF THE ART
A. ULTRASOUNDS
Originally, ultrasound technology started to be used to
increase the perception under the sea for navigation
purposes, known as sonar devices [5]. However, ultrasounds
were soon applied to medicine [6] and quickly found in more
application fields, such as non-destructive testing methods
[7].
Nowadays, ultrasounds are used for object recognition [8],
which aim to reduce the power consumption, computation,
and cost of current optical sensors. In [9], DasIvan et al.
created an ultrasonic-based hand-gesture recognition device
using a single piezoelectric transducer and an 8-element
microphone array. Despite the fact that the accuracy was
lower than in devices using optical sensors, it increased the
number of gestures supported by a factor of 200 within
the same energy budget. The developed system uses the
Sound-Source Localization (SSL) algorithm.
However, other approaches have tried different
techniques
with the same goal. UltraGesture [4] uses the
Channel Impulse Response (CIR) for finger motion
perception and recognition, getting a resolution of 7 mm
in the measure- ments. Soundwave [1], AudioGest [2],
and Dolphin [3] measure the frequency variation of the
hand in the incoming signal due to the movement of the
user, known as Doppler effect. All three works use
commercial speakers and micro- phones embedded in
existing systems.
The difference among the previously commented
systems
are the developed algorithms for the gesture
recognition. SoundWave [1] implements a threshold-based
dynamic peak tracking technique to capture the Doppler
shifts recorded by a laptop. Similarly, AudioGest [2] adds
some of the signal contexts to the estimation of the hand
in-air time, average waving speed as well as hand moving
range. Smart mobile devices have also been used for a
closer interaction with the user, using the same Doppler
papers [3]. A further comparison of these studies will be
shown in Section V.
Apart from large-scale gestures as studied in our paper,
ultrasound signals have also been used for multiple ges-
ture types. An example of this is the classification
of micro-gestures based on the micro-Doppler effect.
Sang et al. [10] and Zeng et al. [11] proposed two different
models for this purpose. The data to classify in these papers
are seven and five finger-based gestures respectively. Both
models are based on Recurrent Neuronal Networks (RNN)
and Convolutional Neuronal Networks (CNN) to study the
temporal evolution of the micro-Doppler images, achieving
an accuracy over 90% in both cases.
One of the reasons for the integration of ultrasound
sensors
when using these techniques rather than other
technologies is its robust behaviour against the ambient
light or visibility changes. At the same time, while cameras
or microphones can easily differentiate not only the gestures
or voice commands, but also who is doing it, they may
incur privacy concerns. Ultrasounds only get relevant
information of the movement and, consequently, capture
fewer attributes from the users, which hardens user
tracking and identification but improves the privacy of the
user.
One of the goals of the proposed system in this
paper
is to integrate it into different multi-purpose large
systems. Therefore, in order to reduce the complexity of
the integra- tion of the ultrasound module, an Edge
approach has been researched. This implies that the whole
data is preprocessed in the device at the network edge
instead of depending on external devices or services such as
Cloud Computing. At the same time, this approach would
increase privacy since the raw data is not transmitted but
only the final processed gesture classification is. The next
subsection gives details about the advantages of this
approach as well as a deeper description of Edge Computing.
B. EDGE COMPUTING
Edge Computing [12] is aimed at reducing Cloud workload
to process device data. To do so, some preprocessing and/or
computing tasks are executed at the network edge when
pos- sible. Thus, Edge Computing is suitable in scenarios
where low latency is required for the user, or where the end
device application has time critical constraints [13].
At the same time, this technique ensures integrity and
confidentiality of the information [14]. As a result of not
com- municating the information with external devices, the
energy consumption for the data transmission is
reduced [15]. By preprocessing the data in the device,
the confidential information which is not relevant for the
final task can be masked/deleted before being shared with
an external device. This process also can be used to
standardize the format of the transmitted data in order to
create a shared format that all the devices can understand
even if initially the format of each device was different
[16]. This is especially relevant when multiple devices are
collaborating as it is in the Internet of Things environment.
3.
B. Saez etal.: Gesture Recognition With Ultrasounds and Edge
Computing
III. HARDWARE DESCRIPTION AND SIGNAL
ACQUISITION
The proposed system uses two modules, as shown in Figure
1. The first one is used to control two transducers to generate
the outgoing signal and acquire the incoming echo. This
module also calculates the time elapsed between the
emission and the reception of the signal for each
transceiver. This time is known as Time of Flight (ToF).
The first module also integrates the analog circuitry
needed for the echo signals amplification. The second
module receives the ToF values and, after filtering them,
performs the recognition algorithm to determine the gesture
realized by the user. If needed, this module can integrate an
external Neuroshield board, to per- form the recognition
algorithm, and control an external device (such as a led strip)
to display the detected gesture.
FIGURE 1. System diagram.
Both modules are composed of a XMC4700 microcon-
troller performing the acquisition/recognition task, as well as
a Bluetooth HC-05 device for the communication between
them. This communication technology has been chosen to
add a wireless channel between both modules to have flex-
ibility on how to place them, but other technologies can be
used as well.
The ultrasound transducers used in this work are based
on a dual-backplate MEMS microphone technology
allowing a combined use as an airborne ultrasonic
transceiver and audio microphone. Those transducers need a
low bias voltage and offer an audio performance of 68
dB(A) signal-to-noise ratio (SNR) and between 80 and 90
dB SNR in the ultrasonic frequency range. After the
emission of the pulses, a free oscil- lation of the membrane
(ringing) can override the incoming echo, producing a
shadow zone that allows obstacle detection from 10 cm on
[17].
A. SIGNAL EMISSION AND RECEPTION
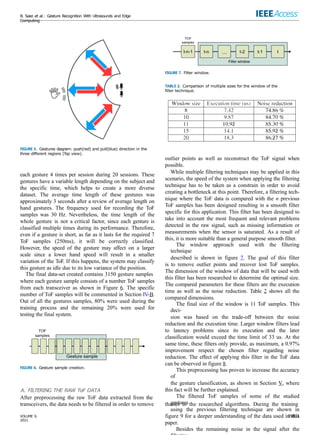
The signal emission and reception are performed by the
mod- ule 1, whose block diagram is shown in Figure 2. The
signal to transmit is a square signal generated by a Pulse
Width Modulation (PWM) block integrated into the
processor. This signal is later transformed into an acoustic
wave by one of the transducers. As soon as the PWM
block finishes the pulse generation, the microcontroller
starts collecting sam- ples using two Analog Digital
Converter (ADC) in parallel, one for each transceiver, to
minimize time skew between samples. The echo received
by the transducer, as an analog signal, carry some noise
from the environment (as could be
FIGURE 2. Transducer control and ToF calculation.
that have been seen to be harmful to the device’s operating
frequency). A band-pass amplifier was developed for this
task, which amplifies the lower ultrasonic band (20 kHz to
100 kHz) while filters out all other frequencies. After this
filter, the signal must be digitalized by the microcontroller
ADC module for further processing, as it is explained in the
next subsection.
B. TIME OF FLIGHT
After the signal is acquired it has to be processed to identify
if there is an incoming echo, and the position of this if
appli- cable. The ToF calculus has to be done while the
following frame is being acquired, running both processes in
parallel as shown in Figure 3.
The signal can be processed in different domains to calcu-
late the ToF, finding in the literature several methods for each
domain, as collected by Jackson et al. [18]. and summarized
in table 1.
FIGURE 3. Firmware task parallelization to minimize execution time.
TABLE 1. Example of ToF calculus techniques.
the use of buttons from a computer’s keyboard or mouse,
39001
VOLUME 9,
2021
4.
B. Saez etal.: Gesture Recognition With Ultrasounds and Edge
Computing
Some methods try to imitate the nature systems to
calculate the ToF. for example, Hayward et al. [19]
developed the ‘‘Biologically Inspired Ranging Algorithm
(BIRA)’’ based on the bats hearing system for echolocation.
Other models are based in the frequency domain, as for
example Huang and Huang [20] use the phased difference of
a single frequency signal to calculate the ToF. Also, signal
with more than one frequency component has been studied
to calculate the desired parameter, as for example Cowell
and Freear [21] used chirp-signals to increase the accuracy
of the estimated ToF. This approach also avoids multi-path
problems and differentiates between several emitters.
Due to the low computation power required and
good
results, most works base this calculus on time domain
meth- ods, based i.e. on the amplitude of the incoming
signal or in the cross-correlation of the echo with the
sent (or expected) signal. The cross-correlation method
reduces the high influence of noise in the amplitude
method, since the cross-correlation, which acts as matched
filtering, produces a time-domain signal with a maximum at
the time when the echo was received [18], [22].
The ToF calculation proposed in this system can be
divided
in four steps as described in Figure 4. First, the
acquired signal is cross-correlated with the template of the
expecting echo, giving a maximum value where the
expected and real echo overlap. Then, the envelope of the
previous signal is obtained using a low pass filter. After
that, the envelope is evaluated to extract the first cut with
a dynamic threshold. This threshold represents the
attenuation of the signal due to the distance traveled. It
can be adjusted according to the ambient noise level of
each specific scenario. Finally, the maximum of the cross-
correlated signal is searched on a window with center in the
threshold-envelope crossing value, giving the position of the
ToF in number of samples. Once the number of ToF
samples is determined, it can be easily converted to time
knowing the ADC sampling frequency.
Using only one transceiver as emitter brings a non-
desire
effect in the ToF calculus. The distance from the obstacle
to the transmitter is a direct relation with the ToF
estimated, as shown in (1), but the ToF estimated in the
signal of the second transceiver is a relation of the distance
between the obstacle with both transceivers, as shown in (2).
The solution to this effect will be further discussed in
following sections.
ToF1 = (1)
ToF2 =
2d1
cs
d1 + d2
cs
where ToFn indicate the ToF for the transceiver n, dn the
distance between the target and the transceiver n and cs the
speed of the sound.
The proposed system is robust also to temperature
changes. The speed of the sound in the air depends,
among other environmental effects, on the air
temperature [23]. This dependency is significant enough
to allow the estimation
IV. GESTURE RECOGNITION METHODS
Seven gestures, and idle, have been selected for this experi-
ment: front push, front pull, right push, right pull, left push,
left pull, static position, and no gesture. These gestures are
well defined arm or hand movements in two dimensions
to minimize the gesture complexity and reduce to two the
required transceivers. Therefore, all gestures must be con-
tained in this plane and so they are assumed to be in the
front part of the sensors as shown in Figure 5. Otherwise,
the system won’t be able to track the gesture, due to the
transceiver’s unidirectional sensitivity and radiation pattern.
This is an effect of the package to protect the membranes
and
(2) electronics, which is also used to increase the strength of the emitted
signal.
These gestures are measured using both transceivers simul-
taneously. By extracting the ToF from each sensor in each
moment, as explained in IV-A by (1) and (2), it is possible to
determine the movement direction and the region of the
plane where the movement has been done.
Four individuals performed these gestures in different
con-
ditions within a distance of 15-50 cm from the device to
col-
FIGURE 4. ToF calculus algorithm: cross-correlation signal (blue),
cross-correlation signal envelope (red), threshold for echo
detection (yellow) and peak value detected (black).
of air temperature based on the difference between ToF lect data from different conditions. Each individual repeated
39002 VOLUME 9,
2021
measurement as shown by Annibale et al. [24]. Once more,
the use of the relation between ToF of both transceivers
provides the mitigation of this non desire effect.
5.
B. Saez etal.: Gesture Recognition With Ultrasounds and Edge
Computing
FIGURE 5. Gestures diagram: push(red) and pull(blue) direction in the
three different regions (Top view).
each gesture 4 times per session during 20 sessions. These
gestures have a variable length depending on the subject and
the specific time, which helps to create a more diverse
dataset. The average time length of these gestures was
approximately 3 seconds after a review of average length on
hand gestures. The frequency used for recording the ToF
samples was 30 Hz. Nevertheless, the time length of the
whole gesture is not a critical factor, since each gesture is
classified multiple times during its performance. Therefore,
even if a gesture is short, as far as it lasts for the required 7
ToF samples (250ms), it will be correctly classified.
However, the speed of the gesture may affect on a larger
scale since a lower hand speed will result in a smaller
variation of the ToF. If this happens, the system may classify
this gesture as idle due to its low variance of the position.
The final data-set created contains 3150 gesture samples
where each gesture sample consists of a number ToF samples
from each transceiver as shown in Figure 6. The specific
number of ToF samples will be commented in Section IV-B.
Out of all the gestures samples, 80% were used during the
training process and the remaining 20% were used for
testing the final system.
FIGURE 6. Gesture sample creation.
A. FILTERING THE RAW ToF DATA
After preprocessing the raw ToF data extracted from the
FIGURE 7. Filter window.
TABLE 2. Comparison of multiple sizes for the window of the
filter technique.
outlier points as well as reconstruct the ToF signal when
possible.
While multiple filtering techniques may be applied in this
scenario, the speed of the system when applying the filtering
technique has to be taken as a constrain in order to avoid
creating a bottleneck at this point. Therefore, a filtering tech-
nique where the ToF data is compared with the n previous
ToF samples has been designed resulting in a smooth filter
specific for this application. This filter has been designed to
take into account the most frequent and relevant problems
detected in the raw signal, such as missing information or
measurements when the sensor is saturated. As a result of
this, it is more suitable than a general purpose smooth filter.
The window approach used with the filtering
technique
described is shown in figure 7. The goal of this filter
is to remove outlier points and recover lost ToF samples.
The dimension of the window of data that will be used with
this filter has been researched to determine the optimal size.
The compared parameters for these filters are the execution
time as well as the noise reduction. Table 2 shows all the
compared dimensions.
The final size of the window is 11 ToF samples. This
deci-
sion was based on the trade-off between the noise
reduction and the execution time. Larger window filters lead
to latency problems since its execution and the later
classification would exceed the time limit of 33 us. At the
same time, these filters only provide, as maximum, a 0.97%
improvement respect the chosen filter regarding noise
reduction. The effect of applying this filter in the ToF data
can be observed in figure 8.
This preprocessing has proven to increase the accuracy
of
the gesture classification, as shown in Section V, where
this fact will be further explained.
The filtered ToF samples of some of the studied
gestures
using the previous filtering technique are shown in
figure 9 for a deeper understanding of the data used in this
paper.
Besides the remaining noise in the signal after the
transceivers, the data needs to be filtered in order to remove thanks to the researched algorithms. During the training
39003
VOLUME 9,
2021
6.
B. Saez etal.: Gesture Recognition With Ultrasounds and Edge
Computing
FIGURE 8. T
oF data before and after applying filter.
FIGURE 9. Filtered ToF samples of left and right push and pull
gestures.
process, at the same time the AI models learn to classify the
input data, they learn as well to adapt themselves to the
noise of the signals. Further explanations of these
algorithms are done in Section IV-B.
B. ALGORITHMS
Multiple classification algorithms were applied to the gath-
ered data aiming to compare the gesture recognition
accuracy based on the collected data explained in the
previous sec- tions. The data used for the classification has
been explained in Subsection IV, where Figure 6 shows
how each gesture sample is created as a succession of ToF
samples from both transceivers. This enables the system to
learn the time evolu- tion of the signal without using
complex algorithms such as LSTM neural networks.
Each time a new ToF sample is received, the window
slides creating a new gesture sample including the new ToF
sample and removing the oldest one. The sliding window
enables the system to generate more gesture samples for the
learning phase than dividing the whole data-set into sub-
datasets of n ToF samples.
Since the algorithms used for the classification are
based
to be preprocessed to obtain the real distances with respect
to each transceiver. At the same time, the algorithms learn
to overcome the possible remaining noise in the data after
the first filter explained in Subsection IV-A.
Finally, from each gesture sample, the slope of the ges-
ture sample from each transceiver as well as the difference
between their mean values were used as input features for
the classification algorithms.
The relevant information of the gesture data for its
clas-
sification is the evolution of the value of the ToF
signals. Therefore, a study to decide the number of ToF
samples contained in each gesture sample was carried
out. As the gesture data will be preprocessed to extract
the previously explained features, the number of inputs for
the algorithms is independent from the number of ToF
samples per gesture sample. The comparison was based
on the final accuracy achieved in Multilayer Perceptron
(MLP) [25] that will be commented in this section, as
shown in Table 3.
TABLE 3. Comparison of multiple number of T
oF samples per
gesture sample.
As a result of this study, the number of ToF samples per
gesture sample was set to 7. The reason for this decision is
its high accuracy in the MLP model as well as its reduced
number of samples. The latest reason leads to an increase
of the number of gestures samples created. This is beneficial
during the training phase of the models. Its higher accuracy
in comparison with the cases of a higher number of ToF
samples is due to the fact this increase leads to problems
during transitions between gestures.
Three algorithms have been researched in this paper:
• Deep Learning model. Different structures of Deep
Neural Networks (DNN) were researched, such as MLP
[25], Long Short Term memory (LST) DNN [26] and
Convolutional Neural Network [27]. Since the features
used for the classification do not require a time
evolution study or a further feature extraction, we
concluded the MLP was the structure that fits in this
application among the DNN structure researched. This
decision was based on the time required to re-train the
DNN in case new gestures are added to the system
as well as its speed to compute the result. In case
any of the other DNN structure were implemented,
the latency of the system would increase leading to
bottleneck problems in the classification step of the
pipeline.
The proposed MLP model was designed keeping in
mind
on a supervised learning approach, the ToF data does not
have
the number of layers as well as artificial neurons while
39004 VOLUME 9,
2021
7.
B. Saez etal.: Gesture Recognition With Ultrasounds and Edge
Computing
FIGURE 10. MLP network structure.
achieving high accuracy results. The chosen structure is
an MLP of 4 layers as Figure 10 shows. The input layer
includes 3 artificial neurons, which represent the
number of features that will be fed into this DNN.
Following the input layer, there are two hidden layers
with 6 and 9 neu- rons respectively. The output layer
contains 8 neurons to match the number of gestures
(including idle) studied in this paper. In the structure,
batch normalization layers have been added between
each layer to increase the stability of the DNN.
As a result, this model could be implemented in an
Edge
Device for the inference process due to its low memory
requirements as well as the speed to process the input
data.
• Deep Learning model based on Neuroshield device.
Another approach researched in this paper was the
implementation of the classification task in the Neu-
roshield device [28]. This device includes 576 artificial
neurons programmed with a radial basis activation func-
tion [29] rather than the previously commented DNN.
This activation function computes the distance, in the
feature representation plane, of the established center of
each neuron with the input data as shown in Figure 11.
After calculating all the distances, it calculates which
neuron is the closest to the input data and, in case the
distance is smaller than the activation distance, the
input activates the corresponding artificial neuron.
This optimized algorithm, apart from moving the infer-
ence stage to the network edge due to its reduced
latency, enables the execution of the training of the
AI model at the network edge. The limitations of this
model fall on the fact the DNN designed for this
device must be
trained using the same technique, radial basis
activation function.
• Decision Tree model. This model is based on a set of
rules which are defined during the training stage in
order to classify the gesture by comparing the input data
with a list of conditional clauses where the data is
divided into different decisions according to a certain
parameter [30] leading to a final decision based on the
results of these conditional clauses. This model is less
computing-power demanding due to its simplicity to
classify a new data sample. At the same time, this
simplicity makes it diffi- cult to maintain its accuracy
when the complexity of the data increases.
The features fed into the classification techniques were
the same: the slope of the ToF signal measured from the
first transceiver and the average value of the last seven ToF
samples as well as the difference of the mean values of
the ToF signals measured with both transceivers. The same
postprocessing technique has been applied to all the previous
algorithms in order to further improve their accuracy while
still being able to compare them. The postprocessing tech-
nique applied is a sliding window to extract the most
frequent classification results in the last 5 classification
results. There- fore, outlier classification results are filtered,
maintaining a slow and continuous change between
gestures. The improve- ment of the accuracy when
applying this technique can be observed in Section V.
V. RESULTS
The results obtained with the previously explained techniques
are presented in this section using the same data to ensure a
correct comparison of the algorithms.
Due to the fact that all these techniques accomplish with
the time restriction of the system, the compared parameter in
this section is the accuracy, which is measured in this
experiment as correct classifications over all the
classifications.
The Table 4 shows the accuracy achieved using each
clas-
sification approach. At the same time, this table
compares the accuracy results obtained when using the raw
signal (first column), the filtered ToF data (second column),
and using all the previously explained preprocessing
techniques as well as the window to filter the output
classification results.
TABLE 4. Accuracy results without any filter or window (acc. 1),
without the window (acc. 2) and using all the filtering techniques (acc.
3).
The results obtained with the Neuroshield device
achieved the highest accuracy among the researched
techniques, both scenarios of not applying or applying
the postprocessing technique. However, this system lacks the
flexibility the other
two techniques can provide due to the fact that this device
can
FIGURE 11. Neuroshield activation function structure.
39005
VOLUME 9,
2021
8.
B. Saez etal.: Gesture Recognition With Ultrasounds and Edge
Computing
only execute one kind of DNN and it can not be transferred
to another device different from a Neuroshield device.
The Decision Tree algorithm achieved a final accuracy
of 5.6% and 1.46% lower than the Neuroshield device,
with- out the postprocessing and including it respectively.
Never- theless, this technique is the less power requiring
due to its simplicity in comparison with the DNN structures
presented in the paper.
The MLP classificator achieved a final accuracy of
6.59%
and 5.53% lower than the Neuroshield devices,
without the postprocessing and including it respectively. In
spite of achieving the lowest accuracy among these
techniques, this one provides the highest flexibility since
the structure of the DNN and the activation function can be
modified easily as well as transferred to other devices.
For a deeper comparison of the accuracy achieved for
each
gesture, Figures 12, 13 and 14 show the confusion matrix
of the final algorithms (including all the filtering
techniques). It is possible to observe how all the
researched algorithms achieve high accuracy for all the
gestures, being the low- est one the accuracy achieved for
the gesture 5 (left push),
FIGURE 12. MLP confusion matrix.
FIGURE 14. Decision tree confusion matrix.
TABLE 5. Comparison of the size of the researched
algorithms.
83.1%, when using the MLP algorithm. Therefore, we can
conclude all these models can generalize the data properly.
As previously commented, these tables also show how the
MLP model achieves the lowest accuracy results for all the
gestures among the researched algorithms. The main differ-
ence we can observe from these confusion matrices is the
error distribution. While the errors in the MLP and decision
tree models are distributed across all the gestures, the errors
of the Neuroshield model are concentrated in the last 4
gestures. Another relevant factor to compare among the
researched algorithms is the memory consumption of the
different mod- els since this is one of the restrictive
parameters in Edge Devices. Table 5 shows this
comparison, where it is possible to observe how the MLP
model, even when its accuracy is approximately 5% lower
than the best model of the Neu- roshield device, leads to
a memory consumption reduction
for the model of an 83.1%.
The latency of these models has not been compared since
all of them satisfied the restriction of the 33ms established
by the hardware providing a classification result for any
new data before receiving the next one.
A comparison of the studies described in Section II
is
presented in Table 6. Even though it is not possible to
com- pare the performance of the algorithms due to the
lack of a common public dataset as well as the difference
in the data structure each technique requires, significant
parameters of each system can be compared. The future
development of gesture recognition systems based on
ultrasound technology could benefit from a common data
framework, thus allowing the cooperative development of
algorithms with much more
FIGURE 13. Neuroshield algorithm confusion matrix. data and from different sources and conditions.
39006 VOLUME 9,
2021
9.
B. Saez etal.: Gesture Recognition With Ultrasounds and Edge
Computing
TABLE 6. Comparison of state-of-the-art techniques for gesture recognition with
ultrasounds.
One of the features that we can compare is the devices
integrated into these systems. It is possible to observe how
the majority of the researchers are basing the systems on
a multi-sensor approach where a separated microphone and
speaker are integrated. On the other hand, our proposed
system tries to reduce the number of devices integrating
transceivers.
Syst. - CHI, 2012, pp. 1911–1914. vol. 60, no. 2, pp. 343–355, Feb.
2013.
39007
VOLUME 9,
2021
VI. CONCLUSION
The system presented in this paper has been proven to be
able to measure ToF signals that can be later used to
recognize multiple gestures by the integration of two
transceivers. Due to the optimization of the preprocessing
correlation technique to extract the ToF from the echo
signals and the specific design of the firmware to enable
the parallelization of con- current processes, the system can
be implemented as an Edge Device. This system does not
require any external device or cloud server to preprocess the
information.
At the same time, by using the Neuroshield device, which
enables the implementation of an AI classificator at the net-
work edge, or the MLP implemented in an Edge Device, it
is also possible to execute the full process from data
gather- ing to extract the classification at the network
edge while maintaining high accuracy results. It has been
shown how the researched algorithms provided high
accuracy, where the best result is extracted from the
Neuroshield with a 98.4% accuracy.
The memory sizes of the models are also a relevant
feature
to compare since it is one of the main constrains in
Edge Devices. Because of this, this feature has been
taken into account during the optimization of the models.
As a result of this, the size of all the proposed models has
been reduced,
i.e. the proposed MLP, whose size is 23 KB while it
stills
achieves an accuracy of 92.87% in our dataset.
REFERENCES
[1] S. Gupta, D. Morris, S. Patel, and D. Tan, ‘‘SoundWave: Using the
Doppler effect to sense gestures,’’in Proc. ACM Annu. Conf. Hum.
Factors Comput.
2 W. Ruan, Q. Z. Sheng, L. Yang, T. Gu, P. Xu, and L. Shangguan, ‘‘Audio-
Gest: Enabling fine-grained hand gesture detection by decoding
echo signal,’’ in Proc. ACM Int. Joint Conf. Pervasive Ubiquitous
Comput., Sep. 2016, pp. 474–485.
3 Y. Qifan, T. Hao, Z. Xuebing, L. Yin, and Z. Sanfeng, ‘‘Dolphin:
Ultrasonic-based gesture recognition on smartphone platform,’’ in Proc.
IEEE 17th Int. Conf. Comput. Sci. Eng., Dec. 2014, pp. 1461–1468.
4 K. Ling, H. Dai, Y
. Liu, and A. X. Liu, ‘‘UltraGesture: Fine-grained
gesture sensing and recognition,’’ in Proc. 15th Annu. IEEE Int.
Conf. Sens., Commun., Netw. (SECON), Jun. 2018, pp. 1–9.
5 J. Lewiner, ‘‘Paul langevin and the birth of ultrasonics,’’ Jpn. J. Appl.
Phys., vol. 30, no. S1, p. 5, Jan. 1991.
6 A. Carovac, F. Smajlovic, and D. Junuzovic, ‘‘Application of ultrasound
in medicine,’’ Acta Inf. Medica, vol. 19, no. 3, p. 168, 2011.
7 M. G. Silk, ‘‘Ultrasonic transducers for nondestructive
testing,’’ Adam Hilger, Accord, MA, USA, Tech. Rep., 1984.
8 Y. Gao, M. A. Maraci, and J. A. Noble, ‘‘Describing ultrasound video
content using deep convolutional neural networks,’’ in Proc. IEEE 13th
Int. Symp. Biomed. Imag. (ISBI), Apr. 2016, pp. 787–790.
9 A. Das, I. Tashev, and S. Mohammed, ‘‘Ultrasound based gesture recogni-
tion,’’ in Proc. IEEE Int. Conf. Acoust., Speech Signal Process. (ICASSP),
Mar. 2017, pp. 406–410.
10 Y
. Sang, L. Shi, and Y
. Liu, ‘‘Micro hand gesture recognition system
using ultrasonic active sensing,’’ IEEE Access, vol. 6, pp. 49339–
49347, 2018.
11 Q. Zeng, Z. Kuang, S. Wu, and J. Yang, ‘‘A method of ultrasonic finger
gesture recognition based on the micro-Doppler effect,’’ Appl. Sci., vol.
9, no. 11, p. 2314, Jun. 2019.
12 P. P. Ray, D. Dash, and D. De, ‘‘Edge computing for Internet of Things:
A survey, e-healthcare case study and future direction,’’ J. Netw. Comput.
Appl., vol. 140, pp. 1–22, Aug. 2019.
13 M. Satyanarayanan, ‘‘The emergence of edge computing,’’ Computer,
vol. 50, no. 1, pp. 30–39, Jan. 2017.
14 I. Sittón-Candanedo, R. S. Alonso, J. M.
Corchado,
S. Rodríguez-González, and R. Casado-Vara, ‘‘A review of edge
computing reference architectures and a new global edge
proposal,’’ Future Gener. Comput. Syst., vol. 99, pp. 278–294, Oct.
2019.
15 W. Shi, J. Cao, Q. Zhang, Y
. Li, and L. Xu, ‘‘Edge computing: Vision and
challenges,’’ IEEE Internet Things J., vol. 3, no. 5, pp. 637–646, Oct.
2016.
16 W. Yu, F. Liang, X. He, W. Grant Hatcher, C. Lu, J. Lin, and X. Yang,
‘‘A survey on the edge computing for the Internet of Things,’’ IEEE
Access, vol. 6, pp. 6900–6919, 2018.
17 S. Anzinger, C. Bretthauer, J. Manz, U. Krumbein, and A. Dehe, ‘‘Broad-
band acoustical MEMS transceivers for simultaneous range finding
and microphone applications,’’ in Proc. 20th Int. Conf. Solid-State
Sensors, Actuat. Microsyst. Eurosensors XXXIII (TRANSDUCERS
EUROSENSORS XXXIII), Jun. 2019, pp. 865–868.
18 J. C. Jackson, R. Summan, G. I. Dobie, S. M. Whiteley, S. G. Pierce,
and G. Hayward, ‘‘Time-of-flight measurement techniques for airborne
ultrasonic ranging,’’ IEEE Trans. Ultrason., Ferroelectr., Freq. Control,
10.
B. Saez etal.: Gesture Recognition With Ultrasounds and Edge
Computing
19 G. Hayward, F. Devaud, and J. J. Soraghan, ‘‘P1G-3 evaluation of a bio-
inspired range finding algorithm (BIRA),’’ in Proc. IEEE Ultrason.
Symp., Oct. 2006, pp. 1381–1384.
20 K.-N. Huang and Y.-P. Huang, ‘‘Multiple-frequency ultrasonic distance
measurement using direct digital frequency synthesizers,’’ Sens.
Actuators A, Phys., vol. 149, no. 1, pp. 42–50, Jan. 2009.
21 D. M. J. Cowell and S. Freear, ‘‘Separation of overlapping linear fre-
quency modulated (LFM) signals using the fractional Fourier
trans- form,’’ IEEE Trans. Ultrason., Ferroelectr., Freq. Control, vol. 57,
no. 10,
pp. 2324–2333, Oct. 2010.
22 J. Chen, F. Yu, J. Yu, and L. Lin, ‘‘A three-dimensional pen-like ultrasonic
positioning system based on quasi-spherical PVDF ultrasonic
transmitter,’’ IEEE Sensors J., vol. 21, no. 2, pp. 1756–1763, Jan. 2021.
23 D. A. Bohn, ‘‘Environmental effects on the speed of sound,’’ J. Audio
Eng.
Soc., Audio Eng. Soc. Conv., vol. 83, 1987.
24 P. Annibale, J. Filos, P. A. Naylor, and R. Rabenstein, ‘‘TDOA-based
speed of sound estimation for air temperature and room geometry
infer- ence,’’ IEEE Trans. Audio, Speech, Language Process., vol.
21, no. 2,
pp. 234–246, Feb. 2013.
[25] M.-C. Popescu, E. Valentina Balas, L. Perescu-Popescu, and
N. Mastorakis, Multilayer Perceptron: Architecture Optimization and
Training with Mixed Activation Functions. New York, NY, USA:
Association for Computing Machinery, 2017.
26 S. Hochreiter and J. Schmidhuber, ‘‘Long short-term memory,’’ Neural
Comput., vol. 9, no. 8, pp. 1735–1780, 1997.
27 S. Albawi, T. A. Mohammed, and S. Al-Zawi, ‘‘Understanding of a
convolutional neural network,’’ in Proc. Int. Conf. Eng. Technol. (ICET),
Aug. 2017, pp. 1–6.
[28] Neuroshield, General Vision, Petaluma, CA, USA. Accessed:
Apr. 20, 2020.
29 S. Elanayar V
. T. and Y
. C. Shin, ‘‘Radial basis function neural network
for approximation and estimation of nonlinear stochastic dynamic
systems,’’ IEEE Trans. Neural Netw., vol. 5, no. 4, pp. 594–603, Jul.
1994.
30 S. R. Safavian and D. Landgrebe, ‘‘A survey of decision tree classi-
fier methodology,’’ IEEE Trans. Syst., Man, Cybern., vol. 21, no. 3,
pp. 660–674, May 1991.
BORJA SAEZ received the B.Sc. degree
in telecommunication engineering from the
Univer- sity of Granada, in 2015, and the
M.Sc. degree in telecommunication
engineering from ICAI, Universidad
Pontificia Comillas, Madrid, Spain, in 2017.
He is currently pursuing the Ph.D. degree with
the University of Granada. He joined Infineon
Technologies AG, in September 2017. He is cur-
rently working on applications of signal
process- ing and gesture recognition. His
current research
interests include artificial inteligence, deep learning, and human
systems
integration.
JAVIER MENDEZ received the B.Sc. degree
in electronics engineering from the
University of Granada, in 2018, and the
M.Sc. degree in electronics, robotics and
automatics engineering from the University of
Sevilla, Spain, in 2019. He joined Infineon
Technologies AG, in Octo- ber 2019, where
he is currently pursuing the Ph.D. degree in
collaboration with the University of
Granada, with a focus on artificial intelligence
at the network edge as well as sensor fusion
algo-
rithms. His current research interests include edge computing, deep
learning,
and sensor fusion. He received the award as the Head of the graduating
class
MIGUEL MOLINA received the B.Sc. degree
in electronics engineering from the University
of Granada, in 2019, and the M.Sc. degree in
elec- tronic systems engineering from the
Polytechnic University of Madrid, in 2020.
He is currently pursuing the Ph.D. degree with
the University of Granada. He joined Infineon
Technologies AG, in August 2020. He is
currently working on applications of sensor
fusion for drones and into hardware
implementations of neural networks,
especially for spiking neural networks (SNNs). His main research
interests
include field-programmable gate arrays (FPGAs), edge computing,
neural networks, and Industry 4.0.
ENCARNACIÓN CASTILLO received the
M.Sc. and Ph.D. degrees in electronic
engineering from the University of Granada,
Granada, Spain, in 2002 and 2008,
respectively. From 2003 to 2005, she was a
Research Fellow with the Depart- ment of
Electronics and Computer Technology,
University of Granada, where she is currently
an Associate Professor. During a Research
Fellow- ship, she carried out part of her
research with the Department of Electrical and
Computer Engi-
neering, Florida State University, Tallahassee, FL, USA. She has authored
over 50 technical articles in international journals and conferences.
Her current research interests include the protection of IP protection
of very large-scale integration (VLSI) and field-programmable gate
array-based sys- tems, as well as residue number system arithmetic,
VLSI and FPL signal processing systems, and the combination of digital
and analog programmable technologies for smart instrumentation for
biosignal processing. She also serves regularly as a reviewer for IEEE
journals.
MANUEL PEGALAJAR graduated in computer
engineering in 2003. He received the Ph.D.
degree in 2006 with a focus on time series
prediction, parameter identification, and
neural networks. He is currently a full-time
Teacher with the Depart- ment of Computer
Science and Artificial Intel- ligence, University
of Granada, Granada, Spain. He has worked
in multivariate image analysis and real-time
control tasks. His research interests include
neural and social networks, evolutionary
optimization, and fuzzy systems.
DIEGO P
. MORALES received the B.Sc.,
M.Eng., and Ph.D. degrees in electronics
engineering from the University of Granada,
in 2001 and 2011, respectively. Since 2001,
he has been an Asso- ciate Professor with the
Department of Computer Architecture and
Electronics, University of Alme- ria, before
joining the Department of Electronics and
Computer Technology, University of Granada, in
2006, where he currently serves as a tenured
Professor. He is the Co-Founder of the Biochem-
istry and Electronics as Sensing Technologies (BEST) Research Group,
Uni-
versity of Granada. He has coauthored more than 80 scientific
contributions. His current research interests include low-power energy
conversion, energy harvesting for wearable sensing systems, and new
materials for electronics and sensors.
from the University of Sevilla.
39008 VOLUME 9,
2021
![Received January 29, 2021, accepted March 3, 2021, date of publication March 8, 2021, date of current version March 15,
2021.
Digital Object Identifier 10.1109/ACCESS.2021.3064390
Gesture Recognition With
Ultrasounds and Edge Computing
BORJA SAEZ 1, JAVIER MENDEZ1, MIGUEL MOLINA1, ENCARNACIÓN
CASTILLO
2,
MANUEL PEGALAJAR3, AND DIEGO P
. MORALES
2
1 Infineon Technologies AG, 85579 Neubiberg, Germany
2 Department of Electronics and Computer Technology, University of Granada, 18071 Granada, Spain
3 Department of Computer Science and Artificial Intelligence, University of Granada, 18071 Granada, Spain
Corresponding author: Borja Saez (borja.saezmingorance@infineon.com)
This work was supported in part by the context of the project SILENSE under EU Project 737487 and under German Project
16ESE0161K, in part by the European Union’s Horizon 2020 Programme (ECSEL), and in part by the German Federal Ministry of
Education and Research (BMBF), Germany—National Authorities.
ABSTRACT The aim of this work is to prove that it is possible to develop a system able to detect gestures
based only on ultrasonic signals and Edge devices. A set of 7 gestures plus idle has been defined, being
possible to combine them to increase the recognized gestures. In order to recognize them, Ultrasound
transceivers will be used to detect the 2 dimensional gestures. The Edge device approach implies that
the whole data is processed in the device at the network edge rather than depending on external devices
or services such as Cloud Computing. The system presented in this paper has been proven to be able to
measure Time of Flight (ToF) signals that can be used to recognize multiple gestures by the integration of
two transceivers, with an accuracy between 84.18% and 98.4%. Due to the optimization of the
preprocessing correlation technique to extract the ToF from the echo signals and our specific firmware
design to enable the parallelization of concurrent processes, the system can be implemented as an Edge
Device.
INDEX TERMS Edge computing, gesture recognition, human system interaction (HSI), ultrasound.
I. INTRODUCTION
The communication among humans is based on a
multi-modal system, which includes not only verbal
commu- nication but also face and body expressions to
intensify the meaning of the verbal content. The Human
System Interac- tion (HSI) trend is evolving, leading to the
research of emerg- ing technologies that mimic this
natural communication, minimizing the use of interfaces
like touchscreens, buttons or sliders. Well known virtual
personal assistants such as Alexa or Siri, developed by
Amazon and Apple respectively which allow communication
with the system using only voice commands. There are
also several systems that introduce gesture control to the
system, i.e. SoundWave [1], AudioGest [2], Dolphin [3], or
UltraGesture [4]. All of them use low frequency
ultrasound signals to recognize between 5 and 12
gestures, which are mostly based on Doppler shift effect
(frequency variation due to movement) while running the
recognition algorithms on PC or Smartphones.
This work is licensed under a Creative Commons Attribution 4.0 License. For more information, see
https://creativecommons.org/licenses/by/4.0/
38999
VOLUME 9,
2021
The associate editor coordinating the review of this manuscript
and approving it for publication was Maurizio Tucci.
The aim of this work is to prove the possibility to develop
a system able to detect gestures based only on ultrasonic
signals and to execute the signal processing in Edge devices,
without using neither a PC nor a cloud environment. For
testing, a set of 7 gestures plus idle has been defined, being
possible to combine them to increase the recognized
gestures. In order to recognize them, 2 transceivers will be
used, since it is the minimum number of transceivers
required to detect 2 dimensional gestures.
This device works as an active sonar system: it transmits
ultrasonic waveforms, which are reflected back when they
collide with any solid obstacle, to its environment. Then the
transceivers receive these indirect echo signals in order to
locate the echo produced by the obstacle. The transceivers
are located on the same device. Thanks to this, it does not
need an external synchronization signal to get the time-of-
flight (ToF) value, which is the time between the transmitted
signal emission and the echo signal reception. These mea-
surements enable the system to have a great resolution in
the depth dimension due to the direct relation between time-
of-flight and the distance between the reflector object and](https://image.slidesharecdn.com/gesturerecognitionwithultrasoundsandedgecomputing-250218135540-5343cad2/85/Gesture_Recognition_With_Ultrasounds_and_Edge_Computing-pptx-1-320.jpg)
![B. Saez et al.: Gesture Recognition With Ultrasounds and Edge
Computing
the system. This is an advantage over 2D cameras or Electric
Near Field sensors, which are more sensitive to noise and
need to infer the distance from the strength of the received
signals. However, it has low positioning accuracy when it
comes to the lateral range. In spite of higher processing
time, it could be solved by adding more devices to the
system, getting a combination of time-of-flights estimations
between them.
This article is structured as follows: Section II introduces
the state of the art in Ultrasound technologies for gesture
recognition and the advantages of use Edge Computing for
this purpose. Section III explains in detail the system devel-
oped in this work, as well as the firmware developed for the
signal acquisition and ToF calculation. Section IV describes
the gestures defined for the experiment and the algorithms
studied for the recognition and classification. Section V sum-
marizes the results obtained. Finally, Section VI focuses on
conclusions of this work.
39000 VOLUME 9,
2021
II. PRIOR WORK/STATE OF THE ART
A. ULTRASOUNDS
Originally, ultrasound technology started to be used to
increase the perception under the sea for navigation
purposes, known as sonar devices [5]. However, ultrasounds
were soon applied to medicine [6] and quickly found in more
application fields, such as non-destructive testing methods
[7].
Nowadays, ultrasounds are used for object recognition [8],
which aim to reduce the power consumption, computation,
and cost of current optical sensors. In [9], DasIvan et al.
created an ultrasonic-based hand-gesture recognition device
using a single piezoelectric transducer and an 8-element
microphone array. Despite the fact that the accuracy was
lower than in devices using optical sensors, it increased the
number of gestures supported by a factor of 200 within
the same energy budget. The developed system uses the
Sound-Source Localization (SSL) algorithm.
However, other approaches have tried different
techniques
with the same goal. UltraGesture [4] uses the
Channel Impulse Response (CIR) for finger motion
perception and recognition, getting a resolution of 7 mm
in the measure- ments. Soundwave [1], AudioGest [2],
and Dolphin [3] measure the frequency variation of the
hand in the incoming signal due to the movement of the
user, known as Doppler effect. All three works use
commercial speakers and micro- phones embedded in
existing systems.
The difference among the previously commented
systems
are the developed algorithms for the gesture
recognition. SoundWave [1] implements a threshold-based
dynamic peak tracking technique to capture the Doppler
shifts recorded by a laptop. Similarly, AudioGest [2] adds
some of the signal contexts to the estimation of the hand
in-air time, average waving speed as well as hand moving
range. Smart mobile devices have also been used for a
closer interaction with the user, using the same Doppler
papers [3]. A further comparison of these studies will be
shown in Section V.
Apart from large-scale gestures as studied in our paper,
ultrasound signals have also been used for multiple ges-
ture types. An example of this is the classification
of micro-gestures based on the micro-Doppler effect.
Sang et al. [10] and Zeng et al. [11] proposed two different
models for this purpose. The data to classify in these papers
are seven and five finger-based gestures respectively. Both
models are based on Recurrent Neuronal Networks (RNN)
and Convolutional Neuronal Networks (CNN) to study the
temporal evolution of the micro-Doppler images, achieving
an accuracy over 90% in both cases.
One of the reasons for the integration of ultrasound
sensors
when using these techniques rather than other
technologies is its robust behaviour against the ambient
light or visibility changes. At the same time, while cameras
or microphones can easily differentiate not only the gestures
or voice commands, but also who is doing it, they may
incur privacy concerns. Ultrasounds only get relevant
information of the movement and, consequently, capture
fewer attributes from the users, which hardens user
tracking and identification but improves the privacy of the
user.
One of the goals of the proposed system in this
paper
is to integrate it into different multi-purpose large
systems. Therefore, in order to reduce the complexity of
the integra- tion of the ultrasound module, an Edge
approach has been researched. This implies that the whole
data is preprocessed in the device at the network edge
instead of depending on external devices or services such as
Cloud Computing. At the same time, this approach would
increase privacy since the raw data is not transmitted but
only the final processed gesture classification is. The next
subsection gives details about the advantages of this
approach as well as a deeper description of Edge Computing.
B. EDGE COMPUTING
Edge Computing [12] is aimed at reducing Cloud workload
to process device data. To do so, some preprocessing and/or
computing tasks are executed at the network edge when
pos- sible. Thus, Edge Computing is suitable in scenarios
where low latency is required for the user, or where the end
device application has time critical constraints [13].
At the same time, this technique ensures integrity and
confidentiality of the information [14]. As a result of not
com- municating the information with external devices, the
energy consumption for the data transmission is
reduced [15]. By preprocessing the data in the device,
the confidential information which is not relevant for the
final task can be masked/deleted before being shared with
an external device. This process also can be used to
standardize the format of the transmitted data in order to
create a shared format that all the devices can understand
even if initially the format of each device was different
[16]. This is especially relevant when multiple devices are
collaborating as it is in the Internet of Things environment.](https://image.slidesharecdn.com/gesturerecognitionwithultrasoundsandedgecomputing-250218135540-5343cad2/85/Gesture_Recognition_With_Ultrasounds_and_Edge_Computing-pptx-2-320.jpg)
![B. Saez et al.: Gesture Recognition With Ultrasounds and Edge
Computing
III. HARDWARE DESCRIPTION AND SIGNAL
ACQUISITION
The proposed system uses two modules, as shown in Figure
1. The first one is used to control two transducers to generate
the outgoing signal and acquire the incoming echo. This
module also calculates the time elapsed between the
emission and the reception of the signal for each
transceiver. This time is known as Time of Flight (ToF).
The first module also integrates the analog circuitry
needed for the echo signals amplification. The second
module receives the ToF values and, after filtering them,
performs the recognition algorithm to determine the gesture
realized by the user. If needed, this module can integrate an
external Neuroshield board, to per- form the recognition
algorithm, and control an external device (such as a led strip)
to display the detected gesture.
FIGURE 1. System diagram.
Both modules are composed of a XMC4700 microcon-
troller performing the acquisition/recognition task, as well as
a Bluetooth HC-05 device for the communication between
them. This communication technology has been chosen to
add a wireless channel between both modules to have flex-
ibility on how to place them, but other technologies can be
used as well.
The ultrasound transducers used in this work are based
on a dual-backplate MEMS microphone technology
allowing a combined use as an airborne ultrasonic
transceiver and audio microphone. Those transducers need a
low bias voltage and offer an audio performance of 68
dB(A) signal-to-noise ratio (SNR) and between 80 and 90
dB SNR in the ultrasonic frequency range. After the
emission of the pulses, a free oscil- lation of the membrane
(ringing) can override the incoming echo, producing a
shadow zone that allows obstacle detection from 10 cm on
[17].
A. SIGNAL EMISSION AND RECEPTION
The signal emission and reception are performed by the
mod- ule 1, whose block diagram is shown in Figure 2. The
signal to transmit is a square signal generated by a Pulse
Width Modulation (PWM) block integrated into the
processor. This signal is later transformed into an acoustic
wave by one of the transducers. As soon as the PWM
block finishes the pulse generation, the microcontroller
starts collecting sam- ples using two Analog Digital
Converter (ADC) in parallel, one for each transceiver, to
minimize time skew between samples. The echo received
by the transducer, as an analog signal, carry some noise
from the environment (as could be
FIGURE 2. Transducer control and ToF calculation.
that have been seen to be harmful to the device’s operating
frequency). A band-pass amplifier was developed for this
task, which amplifies the lower ultrasonic band (20 kHz to
100 kHz) while filters out all other frequencies. After this
filter, the signal must be digitalized by the microcontroller
ADC module for further processing, as it is explained in the
next subsection.
B. TIME OF FLIGHT
After the signal is acquired it has to be processed to identify
if there is an incoming echo, and the position of this if
appli- cable. The ToF calculus has to be done while the
following frame is being acquired, running both processes in
parallel as shown in Figure 3.
The signal can be processed in different domains to calcu-
late the ToF, finding in the literature several methods for each
domain, as collected by Jackson et al. [18]. and summarized
in table 1.
FIGURE 3. Firmware task parallelization to minimize execution time.
TABLE 1. Example of ToF calculus techniques.
the use of buttons from a computer’s keyboard or mouse,
39001
VOLUME 9,
2021](https://image.slidesharecdn.com/gesturerecognitionwithultrasoundsandedgecomputing-250218135540-5343cad2/85/Gesture_Recognition_With_Ultrasounds_and_Edge_Computing-pptx-3-320.jpg)
![B. Saez et al.: Gesture Recognition With Ultrasounds and Edge
Computing
Some methods try to imitate the nature systems to
calculate the ToF. for example, Hayward et al. [19]
developed the ‘‘Biologically Inspired Ranging Algorithm
(BIRA)’’ based on the bats hearing system for echolocation.
Other models are based in the frequency domain, as for
example Huang and Huang [20] use the phased difference of
a single frequency signal to calculate the ToF. Also, signal
with more than one frequency component has been studied
to calculate the desired parameter, as for example Cowell
and Freear [21] used chirp-signals to increase the accuracy
of the estimated ToF. This approach also avoids multi-path
problems and differentiates between several emitters.
Due to the low computation power required and
good
results, most works base this calculus on time domain
meth- ods, based i.e. on the amplitude of the incoming
signal or in the cross-correlation of the echo with the
sent (or expected) signal. The cross-correlation method
reduces the high influence of noise in the amplitude
method, since the cross-correlation, which acts as matched
filtering, produces a time-domain signal with a maximum at
the time when the echo was received [18], [22].
The ToF calculation proposed in this system can be
divided
in four steps as described in Figure 4. First, the
acquired signal is cross-correlated with the template of the
expecting echo, giving a maximum value where the
expected and real echo overlap. Then, the envelope of the
previous signal is obtained using a low pass filter. After
that, the envelope is evaluated to extract the first cut with
a dynamic threshold. This threshold represents the
attenuation of the signal due to the distance traveled. It
can be adjusted according to the ambient noise level of
each specific scenario. Finally, the maximum of the cross-
correlated signal is searched on a window with center in the
threshold-envelope crossing value, giving the position of the
ToF in number of samples. Once the number of ToF
samples is determined, it can be easily converted to time
knowing the ADC sampling frequency.
Using only one transceiver as emitter brings a non-
desire
effect in the ToF calculus. The distance from the obstacle
to the transmitter is a direct relation with the ToF
estimated, as shown in (1), but the ToF estimated in the
signal of the second transceiver is a relation of the distance
between the obstacle with both transceivers, as shown in (2).
The solution to this effect will be further discussed in
following sections.
ToF1 = (1)
ToF2 =
2d1
cs
d1 + d2
cs
where ToFn indicate the ToF for the transceiver n, dn the
distance between the target and the transceiver n and cs the
speed of the sound.
The proposed system is robust also to temperature
changes. The speed of the sound in the air depends,
among other environmental effects, on the air
temperature [23]. This dependency is significant enough
to allow the estimation
IV. GESTURE RECOGNITION METHODS
Seven gestures, and idle, have been selected for this experi-
ment: front push, front pull, right push, right pull, left push,
left pull, static position, and no gesture. These gestures are
well defined arm or hand movements in two dimensions
to minimize the gesture complexity and reduce to two the
required transceivers. Therefore, all gestures must be con-
tained in this plane and so they are assumed to be in the
front part of the sensors as shown in Figure 5. Otherwise,
the system won’t be able to track the gesture, due to the
transceiver’s unidirectional sensitivity and radiation pattern.
This is an effect of the package to protect the membranes
and
(2) electronics, which is also used to increase the strength of the emitted
signal.
These gestures are measured using both transceivers simul-
taneously. By extracting the ToF from each sensor in each
moment, as explained in IV-A by (1) and (2), it is possible to
determine the movement direction and the region of the
plane where the movement has been done.
Four individuals performed these gestures in different
con-
ditions within a distance of 15-50 cm from the device to
col-
FIGURE 4. ToF calculus algorithm: cross-correlation signal (blue),
cross-correlation signal envelope (red), threshold for echo
detection (yellow) and peak value detected (black).
of air temperature based on the difference between ToF lect data from different conditions. Each individual repeated
39002 VOLUME 9,
2021
measurement as shown by Annibale et al. [24]. Once more,
the use of the relation between ToF of both transceivers
provides the mitigation of this non desire effect.](https://image.slidesharecdn.com/gesturerecognitionwithultrasoundsandedgecomputing-250218135540-5343cad2/85/Gesture_Recognition_With_Ultrasounds_and_Edge_Computing-pptx-4-320.jpg)
![B. Saez et al.: Gesture Recognition With Ultrasounds and Edge
Computing
FIGURE 8. T
oF data before and after applying filter.
FIGURE 9. Filtered ToF samples of left and right push and pull
gestures.
process, at the same time the AI models learn to classify the
input data, they learn as well to adapt themselves to the
noise of the signals. Further explanations of these
algorithms are done in Section IV-B.
B. ALGORITHMS
Multiple classification algorithms were applied to the gath-
ered data aiming to compare the gesture recognition
accuracy based on the collected data explained in the
previous sec- tions. The data used for the classification has
been explained in Subsection IV, where Figure 6 shows
how each gesture sample is created as a succession of ToF
samples from both transceivers. This enables the system to
learn the time evolu- tion of the signal without using
complex algorithms such as LSTM neural networks.
Each time a new ToF sample is received, the window
slides creating a new gesture sample including the new ToF
sample and removing the oldest one. The sliding window
enables the system to generate more gesture samples for the
learning phase than dividing the whole data-set into sub-
datasets of n ToF samples.
Since the algorithms used for the classification are
based
to be preprocessed to obtain the real distances with respect
to each transceiver. At the same time, the algorithms learn
to overcome the possible remaining noise in the data after
the first filter explained in Subsection IV-A.
Finally, from each gesture sample, the slope of the ges-
ture sample from each transceiver as well as the difference
between their mean values were used as input features for
the classification algorithms.
The relevant information of the gesture data for its
clas-
sification is the evolution of the value of the ToF
signals. Therefore, a study to decide the number of ToF
samples contained in each gesture sample was carried
out. As the gesture data will be preprocessed to extract
the previously explained features, the number of inputs for
the algorithms is independent from the number of ToF
samples per gesture sample. The comparison was based
on the final accuracy achieved in Multilayer Perceptron
(MLP) [25] that will be commented in this section, as
shown in Table 3.
TABLE 3. Comparison of multiple number of T
oF samples per
gesture sample.
As a result of this study, the number of ToF samples per
gesture sample was set to 7. The reason for this decision is
its high accuracy in the MLP model as well as its reduced
number of samples. The latest reason leads to an increase
of the number of gestures samples created. This is beneficial
during the training phase of the models. Its higher accuracy
in comparison with the cases of a higher number of ToF
samples is due to the fact this increase leads to problems
during transitions between gestures.
Three algorithms have been researched in this paper:
• Deep Learning model. Different structures of Deep
Neural Networks (DNN) were researched, such as MLP
[25], Long Short Term memory (LST) DNN [26] and
Convolutional Neural Network [27]. Since the features
used for the classification do not require a time
evolution study or a further feature extraction, we
concluded the MLP was the structure that fits in this
application among the DNN structure researched. This
decision was based on the time required to re-train the
DNN in case new gestures are added to the system
as well as its speed to compute the result. In case
any of the other DNN structure were implemented,
the latency of the system would increase leading to
bottleneck problems in the classification step of the
pipeline.
The proposed MLP model was designed keeping in
mind
on a supervised learning approach, the ToF data does not
have
the number of layers as well as artificial neurons while
39004 VOLUME 9,
2021](https://image.slidesharecdn.com/gesturerecognitionwithultrasoundsandedgecomputing-250218135540-5343cad2/85/Gesture_Recognition_With_Ultrasounds_and_Edge_Computing-pptx-6-320.jpg)
![B. Saez et al.: Gesture Recognition With Ultrasounds and Edge
Computing
FIGURE 10. MLP network structure.
achieving high accuracy results. The chosen structure is
an MLP of 4 layers as Figure 10 shows. The input layer
includes 3 artificial neurons, which represent the
number of features that will be fed into this DNN.
Following the input layer, there are two hidden layers
with 6 and 9 neu- rons respectively. The output layer
contains 8 neurons to match the number of gestures
(including idle) studied in this paper. In the structure,
batch normalization layers have been added between
each layer to increase the stability of the DNN.
As a result, this model could be implemented in an
Edge
Device for the inference process due to its low memory
requirements as well as the speed to process the input
data.
• Deep Learning model based on Neuroshield device.
Another approach researched in this paper was the
implementation of the classification task in the Neu-
roshield device [28]. This device includes 576 artificial
neurons programmed with a radial basis activation func-
tion [29] rather than the previously commented DNN.
This activation function computes the distance, in the
feature representation plane, of the established center of
each neuron with the input data as shown in Figure 11.
After calculating all the distances, it calculates which
neuron is the closest to the input data and, in case the
distance is smaller than the activation distance, the
input activates the corresponding artificial neuron.
This optimized algorithm, apart from moving the infer-
ence stage to the network edge due to its reduced
latency, enables the execution of the training of the
AI model at the network edge. The limitations of this
model fall on the fact the DNN designed for this
device must be
trained using the same technique, radial basis
activation function.
• Decision Tree model. This model is based on a set of
rules which are defined during the training stage in
order to classify the gesture by comparing the input data
with a list of conditional clauses where the data is
divided into different decisions according to a certain
parameter [30] leading to a final decision based on the
results of these conditional clauses. This model is less
computing-power demanding due to its simplicity to
classify a new data sample. At the same time, this
simplicity makes it diffi- cult to maintain its accuracy
when the complexity of the data increases.
The features fed into the classification techniques were
the same: the slope of the ToF signal measured from the
first transceiver and the average value of the last seven ToF
samples as well as the difference of the mean values of
the ToF signals measured with both transceivers. The same
postprocessing technique has been applied to all the previous
algorithms in order to further improve their accuracy while
still being able to compare them. The postprocessing tech-
nique applied is a sliding window to extract the most
frequent classification results in the last 5 classification
results. There- fore, outlier classification results are filtered,
maintaining a slow and continuous change between
gestures. The improve- ment of the accuracy when
applying this technique can be observed in Section V.
V. RESULTS
The results obtained with the previously explained techniques
are presented in this section using the same data to ensure a
correct comparison of the algorithms.
Due to the fact that all these techniques accomplish with
the time restriction of the system, the compared parameter in
this section is the accuracy, which is measured in this
experiment as correct classifications over all the
classifications.
The Table 4 shows the accuracy achieved using each
clas-
sification approach. At the same time, this table
compares the accuracy results obtained when using the raw
signal (first column), the filtered ToF data (second column),
and using all the previously explained preprocessing
techniques as well as the window to filter the output
classification results.
TABLE 4. Accuracy results without any filter or window (acc. 1),
without the window (acc. 2) and using all the filtering techniques (acc.
3).
The results obtained with the Neuroshield device
achieved the highest accuracy among the researched
techniques, both scenarios of not applying or applying
the postprocessing technique. However, this system lacks the
flexibility the other
two techniques can provide due to the fact that this device
can
FIGURE 11. Neuroshield activation function structure.
39005
VOLUME 9,
2021](https://image.slidesharecdn.com/gesturerecognitionwithultrasoundsandedgecomputing-250218135540-5343cad2/85/Gesture_Recognition_With_Ultrasounds_and_Edge_Computing-pptx-7-320.jpg)
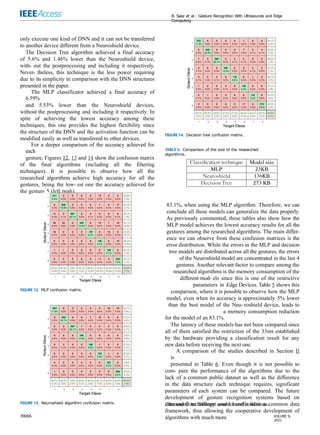
![B. Saez et al.: Gesture Recognition With Ultrasounds and Edge
Computing
TABLE 6. Comparison of state-of-the-art techniques for gesture recognition with
ultrasounds.
One of the features that we can compare is the devices
integrated into these systems. It is possible to observe how
the majority of the researchers are basing the systems on
a multi-sensor approach where a separated microphone and
speaker are integrated. On the other hand, our proposed
system tries to reduce the number of devices integrating
transceivers.
Syst. - CHI, 2012, pp. 1911–1914. vol. 60, no. 2, pp. 343–355, Feb.
2013.
39007
VOLUME 9,
2021
VI. CONCLUSION
The system presented in this paper has been proven to be
able to measure ToF signals that can be later used to
recognize multiple gestures by the integration of two
transceivers. Due to the optimization of the preprocessing
correlation technique to extract the ToF from the echo
signals and the specific design of the firmware to enable
the parallelization of con- current processes, the system can
be implemented as an Edge Device. This system does not
require any external device or cloud server to preprocess the
information.
At the same time, by using the Neuroshield device, which
enables the implementation of an AI classificator at the net-
work edge, or the MLP implemented in an Edge Device, it
is also possible to execute the full process from data
gather- ing to extract the classification at the network
edge while maintaining high accuracy results. It has been
shown how the researched algorithms provided high
accuracy, where the best result is extracted from the
Neuroshield with a 98.4% accuracy.
The memory sizes of the models are also a relevant
feature
to compare since it is one of the main constrains in
Edge Devices. Because of this, this feature has been
taken into account during the optimization of the models.
As a result of this, the size of all the proposed models has
been reduced,
i.e. the proposed MLP, whose size is 23 KB while it
stills
achieves an accuracy of 92.87% in our dataset.
REFERENCES
[1] S. Gupta, D. Morris, S. Patel, and D. Tan, ‘‘SoundWave: Using the
Doppler effect to sense gestures,’’in Proc. ACM Annu. Conf. Hum.
Factors Comput.
2 W. Ruan, Q. Z. Sheng, L. Yang, T. Gu, P. Xu, and L. Shangguan, ‘‘Audio-
Gest: Enabling fine-grained hand gesture detection by decoding
echo signal,’’ in Proc. ACM Int. Joint Conf. Pervasive Ubiquitous
Comput., Sep. 2016, pp. 474–485.
3 Y. Qifan, T. Hao, Z. Xuebing, L. Yin, and Z. Sanfeng, ‘‘Dolphin:
Ultrasonic-based gesture recognition on smartphone platform,’’ in Proc.
IEEE 17th Int. Conf. Comput. Sci. Eng., Dec. 2014, pp. 1461–1468.
4 K. Ling, H. Dai, Y
. Liu, and A. X. Liu, ‘‘UltraGesture: Fine-grained
gesture sensing and recognition,’’ in Proc. 15th Annu. IEEE Int.
Conf. Sens., Commun., Netw. (SECON), Jun. 2018, pp. 1–9.
5 J. Lewiner, ‘‘Paul langevin and the birth of ultrasonics,’’ Jpn. J. Appl.
Phys., vol. 30, no. S1, p. 5, Jan. 1991.
6 A. Carovac, F. Smajlovic, and D. Junuzovic, ‘‘Application of ultrasound
in medicine,’’ Acta Inf. Medica, vol. 19, no. 3, p. 168, 2011.
7 M. G. Silk, ‘‘Ultrasonic transducers for nondestructive
testing,’’ Adam Hilger, Accord, MA, USA, Tech. Rep., 1984.
8 Y. Gao, M. A. Maraci, and J. A. Noble, ‘‘Describing ultrasound video
content using deep convolutional neural networks,’’ in Proc. IEEE 13th
Int. Symp. Biomed. Imag. (ISBI), Apr. 2016, pp. 787–790.
9 A. Das, I. Tashev, and S. Mohammed, ‘‘Ultrasound based gesture recogni-
tion,’’ in Proc. IEEE Int. Conf. Acoust., Speech Signal Process. (ICASSP),
Mar. 2017, pp. 406–410.
10 Y
. Sang, L. Shi, and Y
. Liu, ‘‘Micro hand gesture recognition system
using ultrasonic active sensing,’’ IEEE Access, vol. 6, pp. 49339–
49347, 2018.
11 Q. Zeng, Z. Kuang, S. Wu, and J. Yang, ‘‘A method of ultrasonic finger
gesture recognition based on the micro-Doppler effect,’’ Appl. Sci., vol.
9, no. 11, p. 2314, Jun. 2019.
12 P. P. Ray, D. Dash, and D. De, ‘‘Edge computing for Internet of Things:
A survey, e-healthcare case study and future direction,’’ J. Netw. Comput.
Appl., vol. 140, pp. 1–22, Aug. 2019.
13 M. Satyanarayanan, ‘‘The emergence of edge computing,’’ Computer,
vol. 50, no. 1, pp. 30–39, Jan. 2017.
14 I. Sittón-Candanedo, R. S. Alonso, J. M.
Corchado,
S. Rodríguez-González, and R. Casado-Vara, ‘‘A review of edge
computing reference architectures and a new global edge
proposal,’’ Future Gener. Comput. Syst., vol. 99, pp. 278–294, Oct.
2019.
15 W. Shi, J. Cao, Q. Zhang, Y
. Li, and L. Xu, ‘‘Edge computing: Vision and
challenges,’’ IEEE Internet Things J., vol. 3, no. 5, pp. 637–646, Oct.
2016.
16 W. Yu, F. Liang, X. He, W. Grant Hatcher, C. Lu, J. Lin, and X. Yang,
‘‘A survey on the edge computing for the Internet of Things,’’ IEEE
Access, vol. 6, pp. 6900–6919, 2018.
17 S. Anzinger, C. Bretthauer, J. Manz, U. Krumbein, and A. Dehe, ‘‘Broad-
band acoustical MEMS transceivers for simultaneous range finding
and microphone applications,’’ in Proc. 20th Int. Conf. Solid-State
Sensors, Actuat. Microsyst. Eurosensors XXXIII (TRANSDUCERS
EUROSENSORS XXXIII), Jun. 2019, pp. 865–868.
18 J. C. Jackson, R. Summan, G. I. Dobie, S. M. Whiteley, S. G. Pierce,
and G. Hayward, ‘‘Time-of-flight measurement techniques for airborne
ultrasonic ranging,’’ IEEE Trans. Ultrason., Ferroelectr., Freq. Control,](https://image.slidesharecdn.com/gesturerecognitionwithultrasoundsandedgecomputing-250218135540-5343cad2/85/Gesture_Recognition_With_Ultrasounds_and_Edge_Computing-pptx-9-320.jpg)
![B. Saez et al.: Gesture Recognition With Ultrasounds and Edge
Computing
19 G. Hayward, F. Devaud, and J. J. Soraghan, ‘‘P1G-3 evaluation of a bio-
inspired range finding algorithm (BIRA),’’ in Proc. IEEE Ultrason.
Symp., Oct. 2006, pp. 1381–1384.
20 K.-N. Huang and Y.-P. Huang, ‘‘Multiple-frequency ultrasonic distance
measurement using direct digital frequency synthesizers,’’ Sens.
Actuators A, Phys., vol. 149, no. 1, pp. 42–50, Jan. 2009.
21 D. M. J. Cowell and S. Freear, ‘‘Separation of overlapping linear fre-
quency modulated (LFM) signals using the fractional Fourier
trans- form,’’ IEEE Trans. Ultrason., Ferroelectr., Freq. Control, vol. 57,
no. 10,
pp. 2324–2333, Oct. 2010.
22 J. Chen, F. Yu, J. Yu, and L. Lin, ‘‘A three-dimensional pen-like ultrasonic
positioning system based on quasi-spherical PVDF ultrasonic
transmitter,’’ IEEE Sensors J., vol. 21, no. 2, pp. 1756–1763, Jan. 2021.
23 D. A. Bohn, ‘‘Environmental effects on the speed of sound,’’ J. Audio
Eng.
Soc., Audio Eng. Soc. Conv., vol. 83, 1987.
24 P. Annibale, J. Filos, P. A. Naylor, and R. Rabenstein, ‘‘TDOA-based
speed of sound estimation for air temperature and room geometry
infer- ence,’’ IEEE Trans. Audio, Speech, Language Process., vol.
21, no. 2,
pp. 234–246, Feb. 2013.
[25] M.-C. Popescu, E. Valentina Balas, L. Perescu-Popescu, and
N. Mastorakis, Multilayer Perceptron: Architecture Optimization and
Training with Mixed Activation Functions. New York, NY, USA:
Association for Computing Machinery, 2017.
26 S. Hochreiter and J. Schmidhuber, ‘‘Long short-term memory,’’ Neural
Comput., vol. 9, no. 8, pp. 1735–1780, 1997.
27 S. Albawi, T. A. Mohammed, and S. Al-Zawi, ‘‘Understanding of a
convolutional neural network,’’ in Proc. Int. Conf. Eng. Technol. (ICET),
Aug. 2017, pp. 1–6.
[28] Neuroshield, General Vision, Petaluma, CA, USA. Accessed:
Apr. 20, 2020.
29 S. Elanayar V
. T. and Y
. C. Shin, ‘‘Radial basis function neural network
for approximation and estimation of nonlinear stochastic dynamic
systems,’’ IEEE Trans. Neural Netw., vol. 5, no. 4, pp. 594–603, Jul.
1994.
30 S. R. Safavian and D. Landgrebe, ‘‘A survey of decision tree classi-
fier methodology,’’ IEEE Trans. Syst., Man, Cybern., vol. 21, no. 3,
pp. 660–674, May 1991.
BORJA SAEZ received the B.Sc. degree
in telecommunication engineering from the
Univer- sity of Granada, in 2015, and the
M.Sc. degree in telecommunication
engineering from ICAI, Universidad
Pontificia Comillas, Madrid, Spain, in 2017.
He is currently pursuing the Ph.D. degree with
the University of Granada. He joined Infineon
Technologies AG, in September 2017. He is cur-
rently working on applications of signal
process- ing and gesture recognition. His
current research
interests include artificial inteligence, deep learning, and human
systems
integration.
JAVIER MENDEZ received the B.Sc. degree
in electronics engineering from the
University of Granada, in 2018, and the
M.Sc. degree in electronics, robotics and
automatics engineering from the University of
Sevilla, Spain, in 2019. He joined Infineon
Technologies AG, in Octo- ber 2019, where
he is currently pursuing the Ph.D. degree in
collaboration with the University of
Granada, with a focus on artificial intelligence
at the network edge as well as sensor fusion
algo-
rithms. His current research interests include edge computing, deep
learning,
and sensor fusion. He received the award as the Head of the graduating
class
MIGUEL MOLINA received the B.Sc. degree
in electronics engineering from the University
of Granada, in 2019, and the M.Sc. degree in
elec- tronic systems engineering from the
Polytechnic University of Madrid, in 2020.
He is currently pursuing the Ph.D. degree with
the University of Granada. He joined Infineon
Technologies AG, in August 2020. He is
currently working on applications of sensor
fusion for drones and into hardware
implementations of neural networks,
especially for spiking neural networks (SNNs). His main research
interests
include field-programmable gate arrays (FPGAs), edge computing,
neural networks, and Industry 4.0.
ENCARNACIÓN CASTILLO received the
M.Sc. and Ph.D. degrees in electronic
engineering from the University of Granada,
Granada, Spain, in 2002 and 2008,
respectively. From 2003 to 2005, she was a
Research Fellow with the Depart- ment of
Electronics and Computer Technology,
University of Granada, where she is currently
an Associate Professor. During a Research
Fellow- ship, she carried out part of her
research with the Department of Electrical and
Computer Engi-
neering, Florida State University, Tallahassee, FL, USA. She has authored
over 50 technical articles in international journals and conferences.
Her current research interests include the protection of IP protection
of very large-scale integration (VLSI) and field-programmable gate
array-based sys- tems, as well as residue number system arithmetic,
VLSI and FPL signal processing systems, and the combination of digital
and analog programmable technologies for smart instrumentation for
biosignal processing. She also serves regularly as a reviewer for IEEE
journals.
MANUEL PEGALAJAR graduated in computer
engineering in 2003. He received the Ph.D.
degree in 2006 with a focus on time series
prediction, parameter identification, and
neural networks. He is currently a full-time
Teacher with the Depart- ment of Computer
Science and Artificial Intel- ligence, University
of Granada, Granada, Spain. He has worked
in multivariate image analysis and real-time
control tasks. His research interests include
neural and social networks, evolutionary
optimization, and fuzzy systems.
DIEGO P
. MORALES received the B.Sc.,
M.Eng., and Ph.D. degrees in electronics
engineering from the University of Granada,
in 2001 and 2011, respectively. Since 2001,
he has been an Asso- ciate Professor with the
Department of Computer Architecture and
Electronics, University of Alme- ria, before
joining the Department of Electronics and
Computer Technology, University of Granada, in
2006, where he currently serves as a tenured
Professor. He is the Co-Founder of the Biochem-
istry and Electronics as Sensing Technologies (BEST) Research Group,
Uni-
versity of Granada. He has coauthored more than 80 scientific
contributions. His current research interests include low-power energy
conversion, energy harvesting for wearable sensing systems, and new
materials for electronics and sensors.
from the University of Sevilla.
39008 VOLUME 9,
2021](https://image.slidesharecdn.com/gesturerecognitionwithultrasoundsandedgecomputing-250218135540-5343cad2/85/Gesture_Recognition_With_Ultrasounds_and_Edge_Computing-pptx-10-320.jpg)