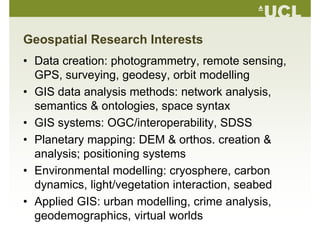
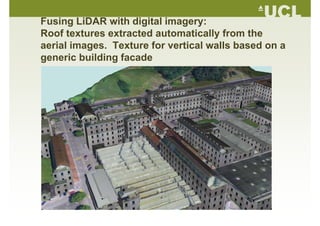
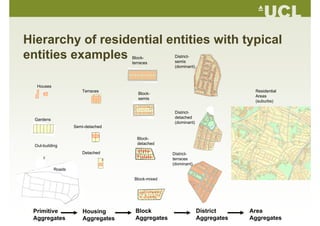
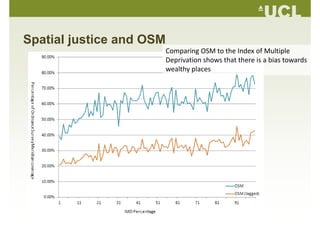
Presentation from EuroSDR 113th meeting, Cardiff, October 2008. An overview of some of the geospatial research carried out by the different departments, centres and groups at UCL.
1. Geospatial Research at UCL –
A presentation to EuroSDR Cardiff Oct 2008A presentation to EuroSDR, Cardiff, Oct. 2008
Jeremy Morley
Dept Civil Environmental & Geomatic EngineeringDept. Civil, Environmental & Geomatic Engineering,
UCL
2. University College London
20,000 students in 72
departments
• One of the top three UK
universitiesuniversities
– Largest research income
• 7th in Times Higher Education's7 in Times Higher Education s
World Universities table, 2008
• Founded in 1826
• Only Oxford and Cambridge are
older in England
Fi t t d it l bilit• First to admit only on ability
• First to begin many subjects at
universityuniversity
– E.g. law, architecture, medicine
• First professor of ‘surveying’p y g
appointed 58 years ago
3. A Multi-Faculty University
• UCL is not a solely engineering/sciences university
It 72 d t t bj t f L t• Its 72 departments cover subjects from Law to
Biochemical Engineering and from Physics &
Astronomy to Hebrew & Jewish Studies
• Similar span of departments doing "GeospatialSimilar span of departments doing Geospatial
Research"
Ai h i t h th b dth f h• Aim here is to show the breadth of research
• Apologies to all the uncited collaborating institutesp g g
and individual researchers!
4. Geospatial Research Groups at UCL
• Dept. Civil, Environmental & Geomatic Engineering
• Dept GeographyDept. Geography
• Dept. Space & Climate Physics (MSSL)
• CASA (Centre for Advanced Spatial Analysis)
• Jill Dando Institute of Crime Science• Jill Dando Institute of Crime Science
• UCL Chorley Institute
• Centre for Polar Observation & Modelling
• The Bartlett Faculty of the Built Environment• The Bartlett Faculty of the Built Environment
• Institute of Archaeology
5. Geospatial Research Interests
• Data creation: photogrammetry, remote sensing,
GPS surveying geodesy orbit modellingGPS, surveying, geodesy, orbit modelling
• GIS data analysis methods: network analysis,
semantics & ontologies, space syntax
• GIS systems: OGC/interoperability, SDSSGIS systems: OGC/interoperability, SDSS
• Planetary mapping: DEM & orthos. creation &
l i iti i tanalysis; positioning systems
• Environmental modelling: cryosphere, carbong y p ,
dynamics, light/vegetation interaction, seabed
• Applied GIS: urban modelling crime analysis• Applied GIS: urban modelling, crime analysis,
geodemographics, virtual worlds
7. Department of Civil, Environmental and
G ti E i iGeomatic Engineering
S ffStaff
• 39 academics
33 h f ll d i t t• 33 research fellows and assistants
• 12 technicians
Students
• ~75 PhD Students• ~75 PhD Students
• ~120 MSc students
• ~200 undergraduates• ~200 undergraduates
Three main research groupings:Three main research groupings:
• Civil Engineering (incl. Environmental Engineering)
• TransportTransport
• Geomatics (9 academics)
8. Geographic Information
Geomatics
Geographic Information
Science – Management of assets,
such as land, property, and
transportation infrastructure, planningtransportation infrastructure, planning
and computer modelling of natural
and urban environments
Photogrammetry, remote
sensing and scanning – non-
contact measurement technologies atcontact measurement technologies at
scales from the micron to planet level,
applications in terrain modelling,
industrial measurement, heritage, g
sector, city modelling
GPS, Geodesy and navigation –, y g
positioning on the surface of the Earth
and in near-Earth space,
measurement of plate tectonics, sea
level, modelling of the gravity field and
other reference surfaces, navigation
for safety critical applications and
mobile devices, time transfer
9. Photogram., remote sensing and scanning
Prof. Ian Dowman, Prof. Stuart Robson,
J M lJeremy Morley
• Optag: RFID & photogram. integrated trackingOptag: RFID & photogram. integrated tracking
• NASA Langley: dynamic structure monitoring
• Laser scanning: terrestrial & small objects
• Reference object properties in laser scanningReference object properties in laser scanning
• Lava flow in situ close-range montoring
• Sensor model for 3 line sensors using rigorous
orbital mechanics
• Mosaics for determining terrain evolution
F i f hi h l ti ti l d t ith LiDAR• Fusion of high resolution optical data with LiDAR
for building extraction
10. Engineering measurement facilities
• 10m x 5m x 2.5m metrology lab
• Camera calibration facility (visible and thermal)y ( )
• Kern ECDS & Leica Axyz
• 5m optical rail with interferometer
• Optical table with computer controlled motion and
rotation stages
M lti i i t d h t t i• Multi-camera imaging systems and photogrammetric
software
• Metris K-Scan*• Metris K-Scan
• Arius 3D Foundation system*
• Server array with 30TB of storage*Server array with 30TB of storage
11. Laser scanning
•Arius 3D scanner – RGBArius 3D scanner RGB
colour from three lasers,
80µm spot diameter, 100µm
sampling interval, maximumsampling interval, maximum
dimensional error 25µm.
•Metris K Scan –
photogrammetrically tracked -2
0
2
4
6
4 9 14 19 24
m)
White
Black
ROM
photogrammetrically tracked
hand scanner
•Instrument testing: Leica
HDS Mensi GS1 Minolta 10
12
14
16
18
cy
White
Neutral 8
Black
-14
-12
-10
-8
-6
-4
Offset(mm
Black
Blue
Green
Red
rtesyof
HDS, Mensi GS1, Minolta
V900, Surphaser
•Include range variation with
object colour measurement
2
4
6
8
10
Frequenc
Range from scanner to neutral 8 grey (m)
gescour
object colour, measurement
of step edges and
assessment with respect to
known engineering surfaces
0
10 -8 -6 -4 -2 0 2 4 6 8 10
Distribution from Mean
iusimag
known engineering surfaces
•Influence of data processing
•Project at JET fusion facility
Ari
13. Hawaii – Pahohoe Flows
1141oC
Control points
• ~ 15mm diameter white spheres (local craft shop),
mounted on short lengths of wire (cut up bike spokes)mounted on short lengths of wire (cut up bike spokes)
which could be inserted into crevices in the rock
Image acquisitiong q
• Pair of 6MP Canon EOS 300D cameras with 28mm lenses
synchronised together using a cable (~1 metre separation)
• 37 image pair sequence (1 image pair per minute)• 37 image pair sequence (1 image pair per minute)
• Cameras pre‐calibrated in laboratory, with calibration
refined by self calibration
16. Fusing LiDAR with digital imagery:g g g y
Roof textures extracted automatically from the
aerial images. Texture for vertical walls based on ag
generic building facade
17. RADARSAT urban SAR image analysis for
flood extent mappingflood extent mapping
C
A
D
B
18. GNSS & G dGNSS & Geodesy
Prof. Paul Cross, Prof. Marek Ziebart,
Dr Jonathon IliffeDr Jonathon Iliffe
• EO and GNSS satellite force modelling
• Centre for the Observation and Modelling of
Earthquakes and Tectonics (COMET)Earthquakes and Tectonics (COMET)
• Seamless Positioning in All Conditions and
Environments (SPACE)
• GNSS for Safety Critical Transport ApplicationsGNSS for Safety Critical Transport Applications
• City Models for GNSS Availability and Multipath
St diStudies
• Bear Ethology Around Romania (BEAR)
19. Snake Grid
Projection that keeps scale factor
near unity along a chosen sinuous
t d li li i t th d ftrend line – eliminates the need for
scale factor and height corrections on
i i j tengineering projects.
Software developed for commercialp
use in collaboration with UCL
Business.
20. VERTICAL OFFSHORE REFERENCE FRAMES
EquipotentialEquipotential
ODNODNODNODN
Local levellingLocal levelling
Mean sea levelMean sea level
“True” geoid“True” geoid
Local levellingLocal levelling
True geoidTrue geoid
CD1CD1
22CDCD
OSGM02OSGM02
ETRFETRF
22CDCD
22. Design of a navigation and communicationsDesign of a navigation and communications
system for manned landings on Mars (ESA)
• One year study covering space-to-
surface and surface-to-surface
i i i d i ipositioning and navigation
technologies
• System design incorporates micro• System design incorporates micro-
miniaturised atomic clocks, INS and
communication system overlay
ranging technologies
• First engineering use of HRSC
M DEMMars DEMs
• Single orbiter used to develop
landing site cartographic andlanding site cartographic and
navigation control using single
differenced phase observations
23. GIS research in UCL CEGE
Dr. Roderic Béra. Dr. Tao Cheng,
Dr. Muki Haklay, Jeremy Morley
• Graph theory applied to geographical networks
• Interoperability, WebGIS, mashups, communityInteroperability, WebGIS, mashups, community
mapping
S ti & t l i• Semantics & ontologies
• Multi-scale spatio-temporal data modelling,p p g,
analysis and reasoning
• Integration with environmental models• Integration with environmental models
• HCI theory applied to GIS usability
24. Knowledge discovery in topographic
d t bdatabases
OS d t hi d d t• OS produces topographic maps and data
• OS wish to diversify their products. This can be done by
Thi d ti ll ti th i i i f ti it– Third parties collecting the missing information on site
(problem: cost)
– Reusing what was already collected (preferred solution for costeus g at as a eady co ected (p e e ed so ut o o cost
reasons)
• To some extent land use can be derived from the
geometrical, topological and configurational information that
is implicitly stored in OS DB
Th i f thi j t i t fi d th l th t l t• The aim of this project is to find the rules that are relevant
for the extraction of this information and to include them
into a spatial ontology A reasoner is then used to infer landinto a spatial ontology. A reasoner is then used to infer land
use from the topographic data.
25. Hierarchy of residential entities with typical
titi lentities examples Block-
terraces
District-
semis
(dominant)
Houses
Terraces
Block-
semis
Residential
Areas
(suburbs)
Gardens
District-
detached
(dominant)
(suburbs)
S i d t h d
Out-building
Block-
detached
Semi-detached
Roads
Detached District-
terraces
(dominant)
Block-mixed
District
Aggregates
Primitive
Aggregates
Housing
Aggregates
Block
Aggregates
Area
Aggregates
27. Personalised systems
• Goes beyond interface designGoes beyond interface design
• Design of ontologies that can support multiple
conceptualisations
• Aims:
– To bridge mismatch between individual
conceptualisations,
– bridging between concepts and system
To bridge between human and machine– To bridge between human and machine
semantics
– To bridge gap between internal and
external representations
– To develop a framework for context-
based (spatial and temporal) semantics
Conceptualisation
Comparison Toolbox forbased (spatial and temporal) semantics
• Methods:
Comparison Toolbox for
comparing diverse semantics
in OWL-based user models
– Formalising and schematising types of
semantic mismatches
C t i ti– Capturing user semantics
– Aligning ‘expert’ and ‘naïve’ ontologies
28. OGC GEOSS D t tiOGC GEOSS Demonstration –
Disease Tracking Following Flooding (Mumbai)g g g ( )
Source: Mumbai Rain - Amit Kumar
http://www.ogcnetwork.net/node/167
FunOnTheNet
29. UCL CEGE / UCL Chorley Institute
• Community mapping public participationCommunity mapping, public participation
• Urban & suburban town centre mapping
• Usability engineering & HCI in GIS
• Volunteered geographic information qualityVolunteered geographic information quality
assessments
30. The Chorley Institute vision
The UCL Institute of Geospatial InformationThe UCL Institute of Geospatial Information
Sciences will act as a catalyst for interdisciplinary
research at UCL b ‘spatiall enabling’ UCL’sresearch at UCL, by ‘spatially enabling’ UCL’s
strategic research objectives.
The Institute will achieve that by:
• Providing the space and facilities for collaborationg p
• Promote and incentivise projects that are aligned
with UCL strategic research objectives and whichwith UCL strategic research objectives, and which
run by 2 or more departments.
Promote collaborations with industry through• Promote collaborations with industry, through
short collaborative secondments.
33. Spatial justice and OSM
Comparing OSM to the Index of MultipleComparing OSM to the Index of Multiple
Deprivation shows that there is a bias towards
wealthy places
34. Th l f 3D i i d tiThe role of 3D imaging and geomatics
in planetary explorationin planetary exploration
Jan-Peter Muller
Director, UK NASA RPIF
Head of Imaging Group
Chair, CEOS-WGCV “Terrain mapping sub-group”
Chair, ISPRS-IV/6 WG on “Global DEM Interoperability”
Point-of-Contact, GEO task DA-07-01 on “Global DEM”
Professor of Image Understanding and Remote Sensing
MODIS & MISR Science Team Member (NASA EOS Project)
HRSC S i T M b (ESA M E P j )HRSC Science Team Member (ESA Mars Express Project)
Stereo Panoramic Camera CoI (ESA ExoMars rover)
Dept. Space and Climate Physics / Mullard Space Science Lab
35. HRSC-CTX-HIRISE : Mars Athabasca Vallis (8ºN, 156ºE)
• Automated DTM production at multiple resolution using HRSC orthoimages as “map-Automated DTM production at multiple resolution using HRSC orthoimages as map
base” to find common tiepoints with higher resolution CTX (6m) and even higher
resolution HiRise (25cm)
• Subsequent stereo processing allows DTMs of 50m (HRSC), 18m (CTX) and 0.7-5mq p g ( ) ( )
(HiRise) to be produced
5m HiRISE stereo
DTM, the refinement
of 3 5 m HiRISE DTMof 3.5 m HiRISE DTM
400m MOLA DTM
0.7m HiRISE stereo
DTM, the refinement
of 1.5 m HiRISE DTM
50m HRSC DTM 18m CTX DTM 3.5m HRSC DTM
37. Centre of Polar Observation and ModellingCentre of Polar Observation and Modelling
P f D Wi h D S LProf. Duncan Wingham, Dr. Seymour Laxon,
Prof. Julian Hunt
• Sea Ice Dynamics and Thermodynamics
D t il d M d l f S I D i– Detailed Models of Sea Ice Dynamics
– Detailed Thermodynamics of Sea Ice
Optimisation of an Arctic Sea Ice Model using spaceborne– Optimisation of an Arctic Sea Ice Model using spaceborne
estimates of ice thickness
• Earth's Ice Mass Fluxes• Earth s Ice Mass Fluxes
– Antarctic Ice Mass Fluxes
– Arctic Ice Mass Fluxes– Arctic Ice Mass Fluxes
• Topography and Buoyancy in Polar Atmosphere and
OceanOcean
• ESA Cryosat / Cryosat 2 missions
40. Beyond blobology – crime mapping research
Hotspot map (KDE) Hotspots of significance (Gi*)
• The significance of where and
when (spatial significance – Gi*)
E g understand how unusual the– E.g. understand how unusual the
crime pattern is
– Space and time as a continuum
rather than a snapshotrather than a snapshot
• Why (spatial regression - GWR)
– E.g. relationship between why
crime happens where it doescrime happens where it does
against other features
– Not just as a global relationship
but as a local relationshipbut as a local relationship
• What if (spatial modelling - ABM)
– E.g. if we target an intervention
to a particular place what impactto a particular place what impact
may it have, including
displacement and diffusion of
benefit effects
41. Centre for Advanced Spatial Analysis,
GIS in Dept GeographyGIS in Dept. Geography
P f P l L lProf. Paul Longley,
Prof. Mike Batty,y
Dr. Andrew Hudson-Smith
Dr Alex SingletonDr. Alex Singleton
42. Surname profiler UK & now worldwideSurname profiler – UK & now worldwide
publicprofiler.org/worldnames
Singleton
46. My thanks to the various research groups at
UCLUCL
• Dept. Civil, Environmental & Geomatic Engineering
• Dept GeographyDept. Geography
• Dept. Space & Climate Physics (MSSL)
• CASA (Centre for Advanced Spatial Analysis)
• Jill Dando Institute of Crime Science• Jill Dando Institute of Crime Science
• UCL Chorley Institute
• Centre for Polar Observation & Measurement
• The Bartlett Faculty of the Built Environment• The Bartlett Faculty of the Built Environment
• Institute of Archaeology