
Download as PDF, PPTX

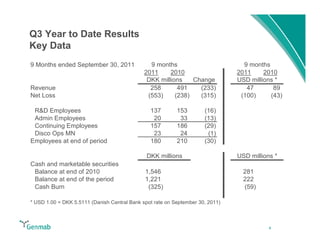
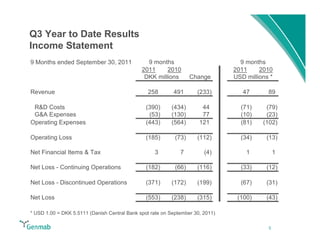
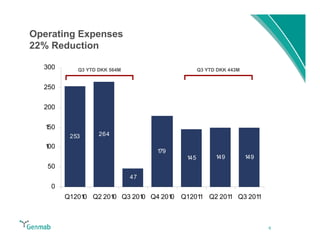
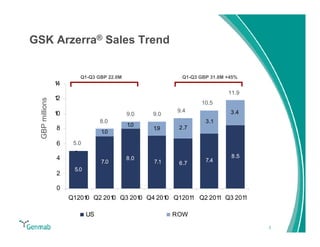
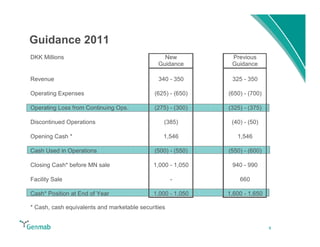
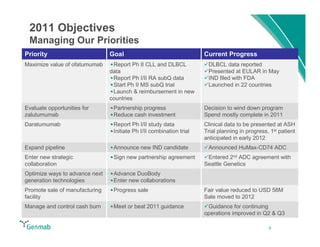

Genmab reported financial results for the first nine months of 2011, with revenue of DKK 258 million and a net loss of DKK 553 million. Operating expenses decreased 22% year-over-year due to lower R&D costs. GSK sales of ofatumumab increased 45% year-over-year. Genmab updated 2011 guidance and objectives, including maximizing ofatumumab value, evaluating opportunities for zalutumumab, advancing daratumumab, and expanding the pipeline.


