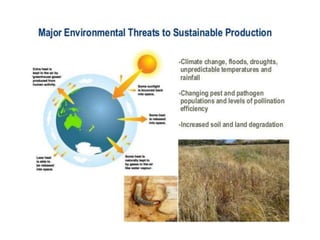
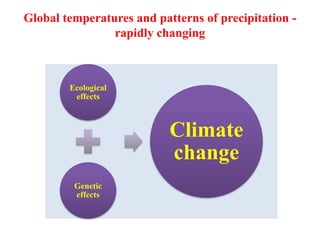
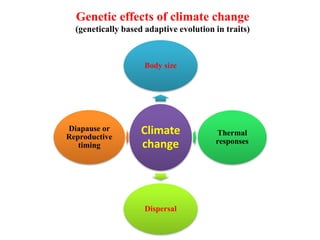
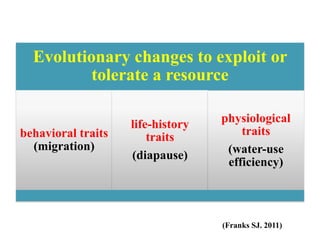
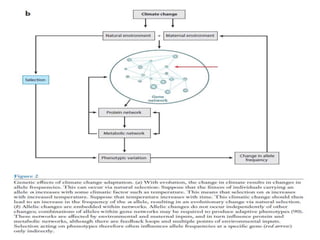
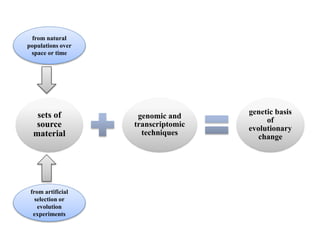
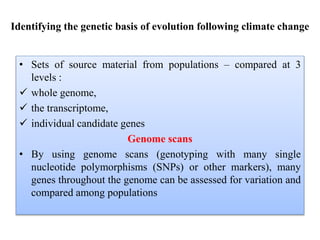
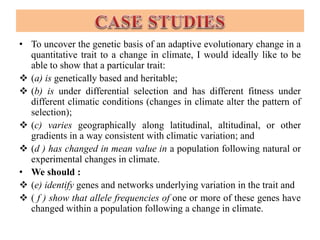
Climate change is causing rapid changes to global temperatures and precipitation patterns. This document discusses the genetic effects of climate change and methods to identify the genetic basis of adaptive evolution in response to climate change. Genome scans, transcriptome analysis, and examining candidate genes can be used to compare populations from different climatic conditions and identify genes related to climate adaptation. Studies in boreal black spruce and Arabidopsis thaliana have identified genes with single nucleotide polymorphisms associated with temperature and precipitation variables, providing candidate genes for climate change adaptation.
3. • Climate change: changes in global climatic
conditions, e.g., temperature, precipitation, and
frequency of extreme events such as storms
and droughts
• Adaptive evolution: evolution via natural
selection in which individuals with phenotypes
of higher fitness pass on more genes to the
next generation
4.
5. Global temperatures and patterns of precipitation -
rapidly changing
Ecological
effects
Genetic
effects
Climate
change
6. Ecological effects of climate change
Climate
change
Physiology
Behavior
Abundance
Distribution
7. Genetic effects of climate change
(genetically based adaptive evolution in traits)
Climate
change
Body size
Thermal
responses
Dispersal
Diapause or
Reproductive
timing
8.
9. Many - independently acting genes of small effect alternative and rapid
mode
Fewer - key regulatory genes within genetic and metabolic networks
Epigenetic
changes
Selection Evolution
Evolution
Climate
change
alternative and rapid mode
(Turner BM. 2009)
10. Evolution rescue populations from the
effects of climate change no evidence
commonly occur avoid a mass extinction and
loss of genetic biodiversity.
• In fact, a recent meta-analysis predicted major losses
in genetic diversity for northern plants owing to
climate change (Alsos IG, et al. 2012).
11.
12.
13. SELECTION TO EXPLOIT CONDITIONS OR TOLERATE
STRESSES
• A general framework on depicting how organisms may evolve
in response to various changes in climate (Figure 1)
• In this framework, changes in climatic conditions, such as
temperature, are separated from cues that indicate conditions
such as photoperiod.
• Organisms perceive the changes in conditions by 2 ways:
through matching cues to
new conditions
directly
14.
15. Climatic changes as agents of selection
Organisms evolve in response to climatic changes in
one of two general ways:
• evolving to take advantage of the new conditions- by
exploiting novel or increased resources (Figure 1a)
• or evolving to tolerate new conditions - to which the
population is not currently optimally adapted (Figure
1b).
16. Evolving to exploit
expanding their range
expanding the period across
which they are active
at higher latitudes
into high elevation areas
Changes in season length
migration and breeding
patterns of speciesselection for increased
dispersal
Evolving to tolerate
temperature
extremes
ocean
acidification
extreme events
influence species distributions
17. • Extreme conditions can select for increased resistance to stressful
conditions and/or ways of avoiding extremes, such as earlier flowering.
(Franks SJ, Sim S and Weis AE. 2007)
• increased resistance to drought or heat stress
• An increase in the frequency of extreme climatic events such as
droughts could select for either escape or tolerance strategies (Franks
SJ. 2011).
• These responses reflect the direct effects of climate change.
These include
• Altered selection pressures when climate change affects biotic
interactions,
• triggering adaptive changes in competitive ability or parasite/predator
resistance,
• adaptive changes in host shifts, allowing organisms to evade biotic
stresses (Pelini SL, et al. 2010).
Direct
18. Indirect
• by altering patterns of hybridization as a
consequence of shifts in species distributions, with
important genetic consequences.
• when a reduction in food supply is countered by
switching to another food source, as in Darwin’s
finches.
19. Evolutionary changes to exploit or
tolerate a resource
behavioral traits
(migration)
life-history
traits
(diapause)
physiological
traits
(water-use
efficiency)
(Franks SJ. 2011)
20. • Responding to altered seasonality, populations may also respond
to increases in CO2 and regional increases in precipitation when
adapting to favorable effects of climate change.
• For example, (Ward JK, et al. 2000).
Arabidopsis thaliana plants raised for five generations under CO2
concentrations of 700 ppm
evolved to take advantage of this increased resource
showed higher seed production than control lines
21. Perhaps the simplest way that climate change can influence the
genetic constitution of populations is shown in Figure 2a.
Figure 2a
22. (Figure 2b)
Response to Climate Change
Plasticity
Phenotypic
plasticity
no genetic change in the
population
same genotypes expressing
different phenotypes in
different environments
Genotypic
plasticity
alleles leading to
increased plasticity
favored
Organisms better match in
more variable environment.
Evolution
Changes in allele
frequencies
allelic changes do not act
in isolation but need to be
considered within a gene
network and within the
context of environmental
effects and the complex
way that genotypes map
onto phenotypes
23.
24. (Reusch TBH and Wood TE. 2007)
More and more genomes
sequencing and annotation
various studies indicating
numerous connections
between genes and traits
a large gap in identifying the genetic basis of adaptive
evolutionary shifts to different climatic conditions
Experimental approaches and Genetic techniques
those applicable to natural
populations
those applicable to
experimental populations
25.
26.
27. Source material Description Advantage Limitation Reference
Clinal
comparison
Comparisons of populations
from along clines
Possible to collect data
immediately, takes
advantage of past evolution
and local adaptation
Not always possible to
determine if patterns reflect
climate change or
other factors
Stinchcombe JR, et
al. 2004.
Natural
evolution
Comparisons based on changes
in natural populations across
time
The only source material in
which populations have
actually adapted in
contemporary time to
changes in climate
Often difficult to find natural
examples of rapid evolution
Franks SJ and Weis
AE. 2008.
Genome scan of
Populations
Population comparisons
involving a large number of
markers to determine which
markers are more differentiated
than expected from neutrality
Relatively easy to apply, can
use a number of different
types of markers, allows a
direct comparison between
effects of selection and
population processes
Differentiated marker may be
distant from marker under
selection depending on linkage
disequilibrium
Prunier J, Laroche J,
Beaulieu J and
Bosquet J. 2011.
DNA sequence
comparison of
Natural
populations
DNA hybridization on
microarrays or other techniques
to identify highly diverged areas
of the genome, often involving
cline ends
Provides an unbiased
assessment of parts of the
genome involved in adaptive
divergence (within the
technical limits of the
approach used)
Can be difficult to link to
adaptive phenotypic variation;
differences may also be related
to historical processes
Turner TL, Levine
MT, Eckert ML and
Begun DJ. 2008.
Known genetic
polymorphisms
Follow polymorphisms
connected to climate adaptation
across time
Can indicate changes in
polymorphisms with known
adaptive functions
Polymorphisms considered
may only have minor effects on
traits; ignores most of genome
Umina PA, et al.
2005.
Known
morphological
polymorphisms
Follow changes in phenotypic
morphs with a known genetic
basis across time
Morphs are often easily
related to adaptive functions,
as in the case of changes in
pigmentation
Only applicable to a specific
class of polymorphisms
Karell P, et al.. 2011.
28.
29. Source material Description Advantage Limitation Reference
Artificial
selection and
Experimental
evolution
Traits related to climate change
adaptation selected directly
(artificial selections), or
populations are placed in
environments simulating climate
change effects (experimental
evolution)
Traits can be accurately defined,
selection pressures set, and crosses
and Sequence comparisons used to
assess the genetic basis of selection
reflecting natural environments;
can assess potential rates of
adaptation
Limited by base population for
selection, may not reflect
intermittent selection and
tradeoffs, depends on species
with short generation time
Bell G and
Gonzalez A.
2009.
Candidate gene
comparisons
Sets of genes that are candidates
for adaptive divergence
considered along gradients based
on known polymorphisms or
DNA sequencing
Provides a direct link to particular
genes and polymorphisms; effects
on traits can be confirmed through
functional analysis
Can be difficult to isolate the
critical polymorphisms,
particularly if they are in
promoter regions or if regulatory
elements are involved; approach
will miss many important genes
not characterized
Lee SF, et al.
2011.
Transcriptome
comparisons
Gene expression microarrays
(can also be used for some
targeted genes)
Identifies genes and gene networks
that are differentiated between
populations and cline ends for
further adaptive studies
Ignores adaptive responses that
have no effect on gene
expression
Healy TM,
Tymchuk
WE, Osborne
and EJ,
Schulte PM.
2010.
30. Source
material
Description Advantage Limitation Reference
Quantitative
trait locus
mapping
Strains are made
genetically homozygous
and compared for
quantitative traits
The same set of strains can be
scored for multiple traits,
including correlated
responses, sequenced strains
can be used for a variety of
purposes, covers whole
Genome
Strains are typically inbred to make
them homozygous before
sequencing, which means that
mapping may partly relate to effects
of inbreeding depression; adaptive
changes may have a different
genetic basis, particularly if
evolution acts as a filtering
mechanism; difficult for
species with long generation times
Morgan TJ, and Mackay
TFC. 2006.
Association
mapping
Genetic markers are
compared with
quantitative trait
associated with climate
change adaptation
Undertaken in
outbredpopulations, does not
depend on short generation
times, covers whole genome
Most signals obtained when
multiple markers available; can be
biased towards detecting genes of
large effect; proximity to genetic
polymorphisms affecting trait
depend on marker
density
Brachi B, et al. 2010.
31. Clinal comparison
• Comparing populations naturally occurring under different
conditions, including clines, is a classic technique of
ecological genetics (Conner JK and Hartl DL. 2004).
• If gene flow among populations is limited populations
may become locally adapted to the climatic conditions
experienced.
• Experiments, such as reciprocal transplants, used to determine
the extent of local adaptation can also be applied to help
predict evolutionary responses to climate change. For example,
Etterson & Shaw (Etterson JR and Shaw RG. 2001) found
local adaptation but evolutionary constraints caused by genetic
correlations in an annual plant occurring in different climatic
regions of the midwestern United States.
32. Natural evolution
There is now however, an ongoing effort to build a collection of seeds that will make it
possible to apply the resurrection approach to detect evolution in a variety of plant
species (Pennisi E. 2011). With this approach, ancestors and descendants can be
compared to help elucidate the genetic basis of evolutionary change in natural
populations.
Before After
propagules
compare ancestors and descendants
reared under common conditions
35. QTL mapping and Association mapping
• Standard approaches to determine the genetic basis of variation in a trait
1. Quantitative trait locus (QTL) mapping
2. Association mapping
QTL mapping
• requires the use of recombinant inbred lines
• can only map traits to a coarse scale
• requires fewer individuals than association mapping.
Association mapping
• does not depend on the development of inbred lines
• can locate genes more precisely
• requires more individuals
Both find a gene’s underlying trait variation but neither is designed to examine
evolution directly.
(Zhu C, Gore M, Buckler ES and Yu J. 2008)
36. Identifying the genetic basis of evolution following climate change
• Sets of source material from populations – compared at 3
levels :
whole genome,
the transcriptome,
individual candidate genes
Genome scans
• By using genome scans (genotyping with many single
nucleotide polymorphisms (SNPs) or other markers), many
genes throughout the genome can be assessed for variation and
compared among populations
37. Scanning the genome for gene SNPs related to climate adaptation and
estimating selection at the molecular level in boreal black spruce.
For example,
• Prunier et al. (Prunier J, Laroche J, Beaulieu J and Bosquet J.
2011) used genome scans of black spruce (Picea mariana)
from populations varying in temperature and precipitation to
identify SNPs. Genes that had outlier FST values were located
in exons, had nonsynonymous polymorphisms, showed
significant regression with climatic variables, had functional
annotation consistent with climatic responses, were considered
prime candidates for adaptation to climatic variation, and
could potentially show responses to climate change.
38. Transcriptome level
• Study of transcribed genes or on the full transcriptome-
possible to narrow the set of genes of interest to those actually
expressed – also help to evaluate differences in levels of
expression under different conditions.
extracting mRNA and
measuring expression level.
Techniques followed are:
Quantitative real-time PCR = small number of genes,
microarrays = large number of genes,
massively parallel sequencing of expressed genes (RNA-seq)
= whole genome.
Analysis of transcribed genes involves:
39. Advantages of examining gene expression in a climate change
adaptation
Different source material originating under different conditions can be
compared
The climatic factor can be experimentally manipulated and expression
measured under the different treatments.
For example,
• Individuals could be collected from a warmer and a cooler area along a
thermal cline
• Gene expression measured at both warm and cool temperatures.
• Genes that differed in expression between the source populations and
between warm and cool temperature treatments might be particularly likely
to play a role in thermal adaptation and evolution following changes in
temperature.
40. Candidate genes
• Approaches to isolate candidate genes:
Genome scans
Transcriptome scans
• Genome screens are starting to be employed to identify areas of the genome
connected to climate adaptation. Several screens of plant populations from
different climates are starting to produce sets of candidate genes for climatic
adaptation.
Example of Boreal Black Spruce
• In boreal black spruce (Picea mariana), a survey of more than 500 SNPs in
genes potentially related to precipitation and thermal variability across 26
populations led to the eventual isolation of 26 SNPs in 25 genes that showed
a strong association with the climate variables.
• These genes have a variety of putative functions, including phenology,
growth, reproduction, wood formation, and stress response, many of which
make sense in a climate change adaptation context. (Prunier J, Laroche J,
Beaulieu J and Bosquet J. 2011)
Genome scans
41. Case study on A. thaliana
• A broad genome screen of SNPs and a geographically diverse set of almost
1,000 accessions of A. thaliana across environmental variables produced
numerous candidate genes potentially involved in climatic adaptation (43).
• Signals of adaptive shifts were tested further by an enrichment of functional
nonsynonymous changes and by growing plants in a common environment
and then testing whether counts of putative adaptive alleles could predict
fitness in this environment.
• This analysis showed a strong correlation between fitness in the common
environment and the number of favored alleles, confirming the validity of the
initial screen.
• In a different set of experiments with Arabidopsis, plants from multiple
inbred lines were grown in four sites differing in climate, and SNPs at each
location were associated with survival and reproductive output (32);
• SNPs with substantial effects were identified, and these proved to be locally
abundant at two of the sites.
42. • The absence of strong selective sweeps suggested that local alleles were
favored via selection on standing variation rather than through sweeps.
• Alleles affecting reproductive output were locally common (locally
selected), and those affecting survival were more common across the species
range, suggesting survival alleles were widely favored at multiple sites.
• Several candidate loci involved in adaptation to different temperature and
precipitation regimes were identified for future study.
Use of single or multiple populations
• Transcriptomic comparisons - usually involved a single population
exposed to different climatic conditions - to identify genes and gene
ontogeny classes - tend to be differentially expressed - may point to
candidates.
• Gene discovery from these efforts - challenging given the sheer number of
genes that typically show altered expression patterns that may be indirectly
related to the traits of interest (129).
Transcriptome scans
43. • Recently, moved to consider multiple natural/ selected
populations or lines - when reared under the same conditions
and challenged by - the same sets of stressful conditions.
• By linking changes in expression across multiple populations
to environmentally induced changes in expression - it is more
likely that candidate loci for adaptive responses can be
identified - particularly when multiple stresses are considered.
• Nevertheless, linking gene expression patterns across
populations or lines with adaptive changes is not
straightforward.
44. Challenge in transcriptomic studies of candidate genes
• To move beyond simply describing patterns of up- and
downregulation of genes - which can depend on background
levels (113).
• This can be achieved by linking patterns to those evident from
other ‘omics technologies, particularly metabolomics (129),
and interpreting changes within a network context.
• Once networks are known on the basis of studies of
environmental responses, gene knockouts, and other
approaches - researchers can begin considering the effects of
genetic variants at different phenotypic levels.
45. Genome-wide mapping efforts
• Apart from genome and transcriptome scans - some very large
genome-wide mapping efforts are starting.
• These efforts provide a detailed picture of the genes -
associated with changes in traits - responding to environmental
cues.
• In A. thaliana, an assessment of genome-wide diversity across
more than 400 accessions planted in different climates and
seasons led to the identification of 12 QTLs that affect
flowering time in a season-location specific manner (73).
46. • To summarize, a number of approaches are now available to
isolate candidate genes involved in climate adaptation across
model and nonmodel species. Genome scans and
transcriptomic studies are starting to produce long candidate
lists. However, moving from lists to validated candidates
remains challenging and requires studies of model organisms
in which genetic manipulations are possible.
47. • Changes in genetic networks may play a large role in contemporary
evolution and climate change responses.
• Traits important in climate change responses, such as the timing of
flowering (133) or stress responses (129)- controlled by genetic
regulatory networks.
• These networks involve:
multiple genes and gene products,
transcription factors, and
proteins that interact with each other and with signals from the
internal and external environment to produce a phenotype suited to
given conditions (136).
• Changes in specific genes within genetic networks influence the
expression of genes, and changes within biochemical pathways
ultimately dictate how genetic changes influence phenotypes.
48. Moreover, alternative splicing, in which RNA transcripts are arranged in multiple ways
so that a single gene can code for multiple proteins (Brett D, et al. 2002), can influence
the tissue expression of heat shock genes such as Hsr omega from D. melanogaster,
which influences the repression of protein synthesis (Johnson TK, Cockerell FE and
McKechnie SW. 2011).
changes in genes phenotypic effects Simple connection
Hsp70 genes
Increased amount of Hsp70
protection from denaturation during heat stress and
influence survival in a range of organisms
genetic
regulatory
network
interacting
transcriptional factors
Influence the expression
Bind to promoter region
(Ostling P, et al. 2007)
49. Key mechanisms of evolutionary responses to climate change
• Most adaptive changes in response to climate change occur
within a regulatory network of genetic effects
• Processes such as:
alternative splicing and the binding of transcription factors
posttranscriptional regulatory mechanisms
the expression and interaction of other elements.
• There is now a much greater appreciation of the different
levels of gene and metabolite regulation that mediate stress
responses (116).
• It is no longer considered particularly useful to split genetic
variation into simple structural and regulatory categories.
50. Genetic variation - structural and regulatory categories
• Changes in structural components of genes can affect expression
• Regulatory elements now encompass a range of processes,
including:
cisacting control elements,
transcription factors, and
metabolites,
posttranscriptional modification
control of DNA through methylation (61, 129).
• Some of these networks and interactions are quite well understood
and can be linked to specific genetic variants.
• For instance, the pathway controlling flowering time and
vernalization in plants involves the integration of a number of
pathways associated with different environmental cues.
(Wilczek AM, et al. 2010).
51.
52. EPIGENETICS: AN ALTERNATIVE MODE OF
CLIMATE CHANGE ADAPTATION
• It is now well established that the environment can influence
gene expression, and thus phenotype, through epigenetic
mechanisms.
• In the contemporary sense, epigenetics refers to any inherited
changes in the phenotype of an organism that are not directly
due to variation in gene sequence.
• Epigenetic mechanisms:
the methylation of cytosine,
modification of chromatin structure,
the alterations in gene regulation due to small RNAs.
(Bossdorf O, Richards CL and Pigliucci M. 2008)
53.
54. An overview of interacting networks through which environmentally induced
changes in gene expression influence cell behaviour and potential
59. • To uncover the genetic basis of an adaptive evolutionary change in a
quantitative trait to a change in climate, I would ideally like to be
able to show that a particular trait:
(a) is genetically based and heritable;
(b) is under differential selection and has different fitness under
different climatic conditions (changes in climate alter the pattern of
selection);
(c) varies geographically along latitudinal, altitudinal, or other
gradients in a way consistent with climatic variation; and
(d ) has changed in mean value in a population following natural or
experimental changes in climate.
• We should :
(e) identify genes and networks underlying variation in the trait and
( f ) show that allele frequencies of one or more of these genes have
changed within a population following a change in climate.
60. • All six of these criteria have not yet been met within a single
study or system, although some studies mentioned above have
shown one or more of these components.
• Researchers provide two examples of traits— flowering time
and body size— that have often been linked to climate change
adaptation.
• In the case of flowering time, researchers are close to meeting
many of the criteria,
• whereas with body size they are only just starting to reach a
very preliminary level of understanding.
61. Flowering Time
• Flowering time - important trait in plants and highly relevant for genetic
adaptation to climate change.
• Climatic conditions have a strong effect on reproductive phenology and the
relationship between flowering time and fitness (101).
• Previous studies have shown that flowering time meets several of the
criteria to demonstrate the genetic basis of an evolutionary response to
climate change.
• One study (35) found that in the annual plant Brassica rapa, flowering
time was heritable, early flowering plants had greater fitness under drought
conditions than late flowering plants, and average flowering time was
earlier in plants following a natural drought than in plants from before the
drought when ancestors and descendants were grown together under
common conditions.
• In many other species flowering time is heritable (47), is under selection
(52), and has shifted following changes in climate (85).
62. Case study 1: Rapid evolution of flowering time by an annual
plant in response to a climate fluctuation (Franks et al., 2007)
• Examined the evolutionary response of FT in field mustard, Brassica rapa L.
(Brassicaceae), during a regional climate anomaly. We define FT as the number of
days for a plant to go from germination to production of its first flower.
• Experimental approach followed:
This approach compares phenotypic and fitness values of ancestral, descendant and
ancestral x descendant hybrid genotypes grown simultaneously under conditions
that mimic the pre- and post-change environments.
• Advantages:
Ancestors and descendants are reared together under the same controlled conditions
so that phenotypic differences between ancestors and descendants can be
partitioned into components due to genetic change and due to phenotypic plasticity.
By simulating pre- and post-change conditions and measuring fitness in both
environments, it is possible to determine whether the descendant genotypes are
better adapted to novel conditions, or, conversely, that they have lost adaptation to
past conditions.
The construction of hybrid lines provides information on the genetic basis and
architecture of trait changes, allowing phenotypic shifts to be partitioned into
additive versus dominant gene effects.
63. • In southern California the growing
season for B. rapa is normally
terminated in late spring by the
end of the rainy season. Winter
rainfall data for an 11-year period
at our study site indicate a switch
from above average to below
average precipitation (Fig. 1),
leading to abbreviated growing
seasons from 2000 to 2004.
• The series of dry years from 2000
to 2004 represents an extreme
drought event.
• Life history theory predicts that
the optimal FT in annual plants
will be shorter with shorter
growing seasons (20, 21). This led
to the prediction that the
abbreviated growing seasons
imposed by the extended drought
would lead to the evolution of
earlier FT in B. rapa.
65. Phase I: Amelioration of Environmental Effect
• Produced F1 plants by planting field-collected seeds in the greenhouse at the
University of California, Irvine.
• The resulting plants were assigned to 1997 X 1997, 1997 X 2004, and 2004 X
2004 crossing groups within each population.
• Germination rates of the F1 plants were 94% for all groups and did not differ by
generation for either the Dry Site or the Wet Site.
• The creation of the F1 lines thus appears to have reduced differences in seed quality
between the collection years.
Phase II, Experiment I: FT Evolution
• F1 seeds were stratified at 4°C on moist filter paper for 5 days and planted into 25-
cm pots containing equal volumes of sand and potting medium in the greenhouse at
the University of California, Irvine.
• Six plants were grown in each pot: one each from the ancestor, descendant, and
hybrid generations from both populations. Pots were watered daily to saturation for
33 days. Water was withheld starting on day 33 for the short season, day 51 for the
medium season, and day 81 for the long season treatments.
• Germination and flowering dates were recorded daily, and seed pods were collected
when ripe. All flowers of all plants were pollinated by hand every 3 days.
66. Phase II, Experiment II: Heritability
• Heritability for the ancestral generation was estimated by regressing family
mean FT of the offspring in Phase II over the mid-parent FT in Phase I.
Statistical Analysis
• Used failure-time analysis, also known as survival analysis, to test for
genetic differences in FT among the ancestral, descendant, and hybrid
generations.
67. Results
( Descendant genotypes had earlier FT than ancestral genotypes,
showing a shift to earlier flowering onset after the drought)
68. • Failure-time analysis showed significantly earlier FT for descendants than ancestors
across all treatments in both populations.
• Under long season treatments (where near-zero mortality allows expression of the
full range of FT genes present) mean FT advanced by 1.9 days in the Dry Site
population and by 8.5 days in the Wet Site population.
• The mean FT of the hybrids did not differ significantly from the mid-point between
ancestors and descendants which indicates an additive genetic basis for the
observed change.
• In addition, FT was earlier for Dry Site than for Wet Site genotypes.
69. To determine whether descendants were better adapted than
ancestors to abbreviated growing seasons, examined survival and fecundity
• Survival was nearly 100% in the
long season treatment for all lines.
• Under the drought-mimicking
short season treatment, survival
was 90% for the Dry Site
population but only 62% for the
Wet Site population.
• Trends for fecundity were similar
but were not statistically
significant. Thus, the post-drought
genotypes appear better adapted
to short seasons than the pre-
drought genotypes.
70. Conclusion of case study
• Our results provide evidence for a rapid, adaptive evolutionary shift in
flowering phenology after a climatic fluctuation.
• The shift to earlier FT in B. rapa after only a few generations adds to
growing evidence that evolution is not always a slow, gradual process but
can occur on contemporary time scales in natural populations.
• Results indicate that B. rapa adapted to this climate anomaly by an escape
strategy of earlier FT.
• Dry Site genotypes are better adapted to faster-drying soils than Wet Site
genotypes, which supports the hypothesis of local adaptation.
71. Case study 2 & 3: Flowering time In Arabidopsis
• One feature of flowering time that makes it ideal for a study of
the genetic basis of evolution under climate change is that a
substantial amount of information already is known about
genes, pathways, and processes involved in determining
flowering time.
• In Arabidopsis, flowering time is controlled by a genetic
regulator network involving four main pathways: photoperiod,
temperature, gibberellin, and autonomous.
• Internal (hormones such as gibberellins) and
• External (photoperiod, temperature)
• Both signals influence these pathways in a way that prevents a
plant from flowering too early or too late.
72.
73. • Although this regulatory network is quite complex; includes
hundreds of genes, transcription factors, and receptor proteins;
and involves variation in gene expression as well as epigenetic
regulation; only a relatively small number of genes appear to
vary in the wild and to influence the flowering time phenotype
in natural populations.
• These are thus prime candidate genes for examining the
genetic basis of flowering time variation and evolution across
taxa in natural conditions.
74. Diversity of Flowering Responses in Wild Arabidopsis thaliana
Strains (Lempe J, et al., 2005)
Materials and Methods
• Stocks- Accessions were obtained from the Nottingham Arabidopsis Stock
Centre (http://www.arabidopsis.info)
• Growth conditions- Plants were grown in controlled growth rooms with a
temperature variability of about plus or minus 0.10C. Long days had 16 h of
light, short days had 8 h.
• Maximal humidity was 65%. Light, temperature, and humidity were
continuously monitored online.
• Plant culture- Seeds were stratified at 4 0C for 7 d (to minimize variation
due to differences in stratification requirements) in 0.1% agarose, then
planted on soil. Before vernalization, seed germination was induced at 160C
for 24 h. Plants were cultivated for 5 wk at 4 0C in a vernalization room with
8 h light of about 50 lmol m2 s1, before transfer to normal growth rooms.
• Experimental design- Twelve seeds per genotype were sown in a
completely randomized design
75. • Scoring of traits- The following traits were scored: DTF, TLN, juvenile
leaf number (JLN), adult leaf number (ALN), cauline leaf number (CLN),
and rosette leaf number (RLN). Flowering was scored on a daily basis for
first macroscopic appearance of the inflorescence. DTF was calculated
from the date of sowing. For vernalized plants, the vernalization period was
subtracted.
• Statistical analyses-
Broad-sense heritability (H2)
The coefficient of genetic variation (CVG)
Genetic correlations (rGE)
Genotype-by-environment interactions
Hierarchical cluster analysis was performed with Cluster 3.0
Noncentric, average linkage (UPGMA) clustering was then performed
using Pearson correlation.
• DNA analyses- using the CTAB method.
• Expression studies- RNA was extracted using Trizol, and 1 lg of total
RNA was reverse transcribed using a Reverse Transcription kit. Microarray
data were generated. RNA isolated from the aerial parts of 4-d-old
seedlings was hybridized to Affymetrix ATH1 arrays.
76. Results/Discussion
• Extensive Variation in Flowering Responses of A. thaliana
Accessions
• We measured several traits, including days to flowering (DTF) and
total leaf number (TLN), which were highly correlated under
different conditions (r2 ¼ 0.6 to 0.9), with environment-dependent
variation in growth rate found in only a few accessions.Heritability
of TLN was higher than that of DTF.
• We studied the effects of vernalization, ambient growth temperature,
and photoperiod, using four different environments:
23 8C long days (23LD),
16 8C long days (16LD),
16 8C long days after 5 wk vernalization (16LDV), and
23 8C short days (23SD).
77.
78. The Contribution of FLC Activity to Flowering-Time Variation
• To evaluate more precisely the relationship between absolute FLC levels and
quantitative variation in flowering time, we analyzed FLC expression by qRT-PCR in
149 accessions grown at 23LD (Figure 4A).
• We found that, among a set of 68 floral regulators, FLC was the one most highly
associated with either TLN or DTF (Figure 4B).
• When we considered all genes represented on the ATH1 array, we found FLC to be
among the ten most highly correlated genes at 23LD (both positively and negatively
correlated) (Figure 4C).
79. • The prominence of FLC, whose levels are highly correlated with
vernalization response, may reflect the fact that this response is the most
important variable affecting flowering time in A. thaliana accessions.
A first step toward identifying the genetic mechanisms underlying the
newly identified flowering behaviors
• They examined F2 populations from crosses of Ei-6 and Fr-2, two strains
that flower relatively early in 23SD, to the reference strain Col-0. In both
cases, the earliness appeared to be recessive compared to Col-0 (Figure 7A).
• When they crossed Ei-6 and Fr-2 to each other, the F1 hybrids were later
than either parent, indicating that earliness in short days has a different
genetic basis in these strains (Figure 7A).
• The F2 progeny from a cross of Fr-2 to Col-0 included a distinct early class,
suggesting that early flowering is due to variation at a major locus (Figure
7B).
• In contrast, in the Ei-6 3 Col-0 cross, continuous variation can be seen,
indicating the involvement of multiple loci (Figure 7C).
80.
81. Conclusion
• Much of the difference in vernalization response is apparently due to variation at
two epistatically acting loci, FRI and FLC.
• We present the response of over 150 wild accessions to three different
environmental variables.
• In long days, FLC is among those genes whose expression is most highly
correlated with flowering.
• In short days, FRI and FLC are less important, although their contribution is still
significant.
• In addition, there is considerable variation not only in vernalization response, but
also in the response to differences in day length or ambient growth temperature.
• The identification of accessions that flower relatively early or late in specific
environments suggests that many of the flowering-time pathways identified by
mutagenesis, such as those that respond to day length, contribute to flowering-
time variation in the wild.
• In contrast to differences in vernalization requirement, which are mainly
mediated by FRI and FLC, it seems that variation in these other pathways is due
to allelic effects at several different loci.
82. Flowering time regulation produces much fruit
(Scott D Michaels, 2008)
• A mobile flower-promoting signal, termed florigen, is produced in the
leaves in response to inductive photoperiods and travels to the shoot apical
meristem to induce flowering.
• With regard to vernalization, one of the most interesting properties is that
cold-treated plants retain a relatively permanent memory of vernalization.
• Arabidopsis flowers more rapidly under long days than under short days.
The ability to distinguish long days from short days is largely the result of
the complex regulation of the B-box containing gene CONSTANS (CO).
CO acts as a floral promoter and is regulated at both the mRNA and protein
levels (Figure 1).
CONSTANS is a critical component in the regulation of flowering by daylength
83. FLOWERING LOCUS C is the primary target of vernalization
• The vernalization responsive block to flowering is created by the
interaction of two genes:
FLOWERING LOCUS C (FLC), a MADS-domain-containing
transcription factor that acts as a floral repressor and
FRIGIDA (FRI), a gene of unknown biochemical function that is required
for high levels of FLC expression.
• the upregulation of FLC by FRI requires the activity of chromatin
remodeling complexes similar to the RNA Polymerase II Associated Factor
1 (PAF1) and SWR1 complexes from yeast
84. Negative regulation of FLC by the autonomous floral-
promotion pathway
• Naturally occurring loss-of-function mutations in FRI and therefore have
low levels of FLC expression and are early flowering.
• Genetic screens in rapid cycling backgrounds have identified a group of
genes that act to constitutively repress FLC. These genes are collectively
referred to as the ‘autonomous’ floral-promotion pathway.
• Autonomous-pathway mutants contain elevated levels of FLC and are late-
flowering; like winter annuals however, FLC can be epigenetically silenced
by vernalization.
85. Integration of flowering signals from the photoperiod and
vernalization pathways
• In rapid-cycling Arabidopsis, or winter annuals following vernalization,
FLC levels are low. It should be noted, however, that full expression of the
floral integrators requires not only elimination of the repression by FLC,
but also activation by long days through CO. Unlike FLC, CO has not been
demonstrated to bind the floral integrators directly.
• A current model for the biochemical activity of CO is that it acts as part of
a Heme Activator Protein (HAP)-like complex.
• In yeast, the HAP complex binds DNA and is composed of HAP2, HAP3,
and HAP5 subunits. CO contains domains that exhibit similarity to HAP2,
suggesting that CO might replace HAP2 in a HAP complex.
• This model is supported by the findings that CO interacts with HAP3 and
HAP5 in yeast and in plants, and that alteration of HAP expression levels
affects flowering time.
86. Spatial considerations
• Photoperiodic induction leads to the production of a mobile signal, CO and
FT expression occurs in the phloem of leaves.
• FT produced in leaves is translocated to the meristem.
• At the meristem, FT physically interacts with bZIP transcription factor FD
and the FT/FD complex activates the expression of SOC1 and the floral
meristem identity gene APETALA1 (AP1).
87.
88. Conclusion of all case studies on flowering time
• It is therefore known that at least in some cases flowering time
is heritable,
is under selection by climatic factors,
varies across climatic clines, and
can evolve following changes in climatic conditions.
• Additionally, candidate genes have been identified that are
linked to variation in flowering time as well as to climatic
conditions, and the function of many of these genes is known.
• Further work on flowering time is likely to provide more
information on the genetic basis of adaptive evolutionary
responses to climate change.
89. 1. Climate change is occurring, affecting many organisms, and, at least in some
cases, leading to evolutionary change that results in changed gene and allele
frequencies in populations.
2. Studying evolutionary responses to climate change can help us to uncover the
genetic basis of adaptive evolution.
3. Methods of studying the genetic basis of climate change adaptation involve a
choice of source material (e.g., sampling along latitudinal or altitudinal
gradients and before and after a natural or artificial environmental change) as
well as a variety of possible genetic techniques (e.g., genome scans,
transcriptome comparisons, candidate gene comparisons, and genetic
mapping).
4. Substantial progress has been made recently in uncovering genes linked to
traits of adaptive significance and genes associated with climatic variation.
However, much less is known about genetic changes occurring as a result of
climate change.
5. Body size in animals and flowering time in plants are two examples of areas in
which further research into the genetic basis of climate change adaptation
seems particularly promising.
90. CONCLUSIONS
• Since the modern evolutionary synthesis, it has been a major goal of
evolutionary biology to uncover the genetic basis of adaptive
evolution. The rapid evolutionary responses of at least some
organisms to current climate change indicates that studying
contemporary evolutionary changes that result from climate change
may provide opportunities to advance this goal. To do so, it is
important to combine ecological approaches to studying responses to
climate change with a variety of techniques in molecular and
quantitative genetics and genomics. Recent advances, including
genome sequencing and transcription profiling, help to uncover the
genetic basis of climate change adaptation. However, future studies
need to be grounded in a thorough understanding of the ecological
context of the environmental changes, need to use well-designed
experiments, and need to draw on current knowledge of genetic
regulation and interactions to avoid fishing expeditions involving
enormous amounts of genetic information without clear questions.
Editor's Notes
Now - to uncover the genetic basis of some of these traits
Although evolution could potentially rescue populations from the effects of climate change, there is not yet evidence that this will commonly occur and thereby circumvent a mass extinction and loss of genetic biodiversity.
For example, when the cue is photoperiod, it remains the same with changing climatic conditions, but the way organisms respond to the cue is different (Bradshaw WE, Holzapfel CM. 2008).
Geographic expansions may lead to selection for increased dispersal to take advantage of favorable conditions . Shorter and milder winters in temperate climates can select for earlier flowering in plants and earlier arrival of bird and insect migrants, particularly at temperate and boreal latitudes
Suppose that there is a particular allele (α) at a locus influencing a trait such as thermal tolerance. Suppose also that individuals carrying this allele have an increased tolerance, improving their fitness (ability to survive and reproduce) at high temperatures.
This issue can be explored with a variety of experimental approaches and genetic techniques
to examine evolutionary changes in natural populations is to collect propagules of individuals before and after a change in conditions and compare ancestors and descendants reared under common conditions
to determine the genetic basis of evolutionary change
both of which connect phenotypic variation in one or more traits to genetic variation at a number of loci. although variation at a particular locus might explain variation in a trait, this does not prove that the locus is necessarily involved in evolutionary responses in natural populations.
Genomic comparisons and genome scans - provide useful information on differences among populations (particularly for species with a reference genome), but much of the genome is not expressed.
a genetic regulatory network influences the expression of heat shock proteins through various interacting transcriptional factors that bind to the promoter region of Hsp70 genes to influence expression