1) The success of assisted colonization and gene flow conservation strategies depends on how plant species respond to changes in temperature and photoperiod across their life cycles.
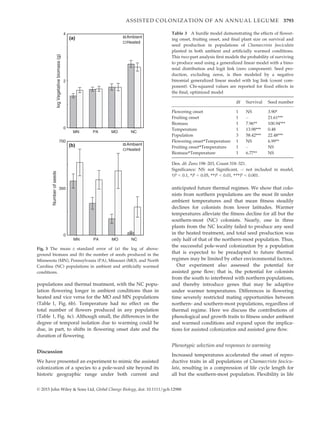
2) A study exposed seeds from northern and southern populations of an annual plant, Chamaecrista fasciculata, to ambient and elevated temperatures in a potential future colonization site north of its current range to examine responses.
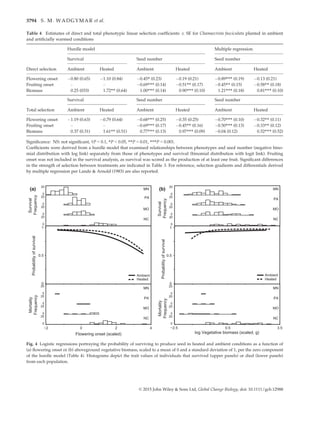
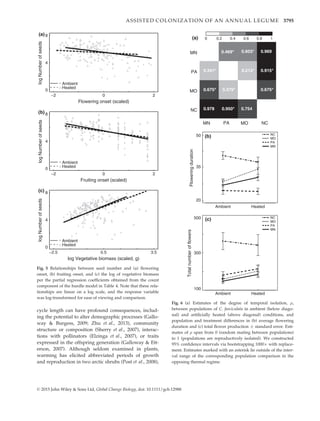
3) They found warming advanced development and compressed life cycles, with patterns of selection on traits changing. Performance depended on population of origin, with the northern population faring best under current conditions but the southern population potentially adapting best to future warming. However, photoperiod mismatches may limit long-term persistence, especially between

![Both C, Visser ME (2005) The effect of climate change on the correlation between
avian life-history traits. Global Change Biology, 11, 1606–1613.
Bradshaw WE, Holzapfel CM (2001) Genetic shift in photoperiodic response corre-
lated with global warming. Proceedings of the National Academy of Sciences of the Uni-
ted States, 98, 14187–14744.
Bradshaw WE, Holzapfel CM (2008) Genetic responses to rapid climate change: it’s
seasonal timing that matters. Molecular Ecology, 17, 157–166.
Bradshaw WE, Holzapfel CM (2010) Physiology of biotic response to rapid climate
change in animals. Annual Review of Physiology, 72, 147–166.
Carpenter KE, Abrar M, Aeby G et al. (2008) One-third of reef-building corals face
elevated extinction risk from climate change and local impacts. Science, 321, 560–
563.
Chuine I (2010) Why does phenology drive species distribution? Philosophical Transac-
tions of the Royal Society B, 365, 3149–3160.
Davis M, Shaw RG (2001) Range shifts and adaptive responses to quaternary climate
change. Science, 292, 673–679.
Donohue K (2002) Germination timing influences natural selection on life-history
characters in Arabidopsis thaliana. Ecology, 83, 1006–1016.
Easterling DR, Horton B, Jones PD et al. (1997) Maximum and minimum temperature
trends for the globe. Science, 277, 364–367.
Ehrlen J (2015) Selection on flowering time in a life-cycle context. Oikos, 124, 92–101.
Elzinga JA, Atlan A, Biere A, Gigord L, Weis AE, Bernasconi G (2007) Time after time:
flowering phenology and biotic interactions. Trends in Ecology and Evolution, 22,
432–439.
Etterson JR (2004) Evolutionary potential of Chamaecrista fasciculata in relation to
climate change. II Genetic architecture of three populations reciprocally
planted along an environmental gradient in the great plains. Evolution, 58,
1459–1471.
Etterson JR, Shaw RG (2001) Constraint to adaptive evolution in response to global
warming. Science, 294, 151–154.
Farnsworth EJ, Bazzaz FA (1995) Inter- and intra-generic differences in growth, repro-
duction, and fitness of nine herbaceous annual species grown in elevated CO2
environments. Oecologia, 104, 454–466.
Fenster CB (1991) Gene flow in Chamaecrista fasciculata (Leguminosae) I. Gene dis-
persal. Evolution, 45, 398–409.
Fenster CB, Vekemans X, Hardy OJ (2003) Quantifying gene flow from spatial genetic
structure data in a metapopulation of Chamaecrista fasciculata (Leguminosae). Evo-
lution, 57, 995–1007.
Fitter AH, Fitter RSR (2002) Rapid changes in flowering time in British plants. Science,
296, 1689–1691.
Foote LE, Jackobs JA (1966) Soil factors and the occurrence of partridge pea (Cassia
fasciculata Michx.) in Illinois. Ecology, 47, 968–975.
Franks SJ, Sim S, Weis AE (2007) Rapid evolution of flowering time by an annual
plant in response to a climate fluctuation. Proceedings of the National Academy of Sci-
ences of the United States of America, 104, 1278–1282.
Frei ER, Ghazoul J, Matter P, Heggli M, Pluess AR (2014) Plant population differentia-
tion and climate change: responses of grassland species along an elevational gradi-
ent. Global Change Biology, 20, 441–455.
Galloway LF, Burgess KS (2009) Manipulation of flowering time: phenological inte-
gration and maternal effects. Ecology, 90, 2139–2148.
Galloway LF, Etterson JR (2007) Transgenerational plasticity is adaptive in the wild.
Science, 318, 1134–1136.
Galloway LF, Fenster CB (2000) Population differentiation in an annual legume: local
adaptation. Evolution, 54, 1173–1181.
Grady KC, Ferrier SM, Kolb TE, Hart SC, Allan GJ, Whitham TG (2011) Genetic varia-
tion in productivity of foundation riparian species at the edge of their distribution:
implications for restoration and assisted migration in a warming climate. Global
Change Biology, 17, 3724–3735.
Griffith TM, Watson MA (2006) Is evolution necessary for range expansion? Manipu-
lating reproductive timing of a weedy annual transplanted beyond its range The
American Naturalist, 167, 153–164.
Haggerty BP, Galloway LF (2011) Response of individual components of reproduc-
tive phenology to growing season length in a monocarpic herb. Journal of Ecology,
99, 242–253.
Hellmann JJ, Prior KM, Pelini S (2012) The influence of species interactions on geo-
graphic range change under climate change. Annals of the New York Academy of Sci-
ences, 1249, 18–28.
Hewitt N, Klenk N, Smith AL et al. (2011) Taking stock of the assisted migration
debate. Biological Conservation, 144, 2560–2572.
Hill JK, Griffiths HM, Thomas CD (2011) Climate change and evolutionary adapta-
tions at species’ range margins. Annual Review of Entomology, 56, 143–158.
Hobbs RJ, Higgs E, Harris JA (2009) Novel ecosystems: implications for conservation
and restoration. Trends in Ecology and Evolution, 24, 599–605.
Hut RA, Beersma DGM (2011) Evolution of time-keeping mechanisms: early emer-
gence and adaptation to photoperiod. Philosophical Transactions of the Royal Society
B, 366, 2141–2154.
Irwin HS, Barneby RC (1982) The American Cassiinae: A synoptical revision of Legu-
minosae tribe Cassieae subtribe Cassiinae in the New World. Memoirs of the New
York Botanical Garden, 35, The New York Botanical Garden, New York.
Keel BG, Zettler LW, Kaplin BA (2011) Seed germination of Habenaria repens (Orchida-
ceae) in situ beyond its range, and its potential for assisted migration imposed by
climate change. Castanea, 76, 43–54.
Kim E, Donohue K (2011) Population differentiation and plasticity in vegetative
ontogeny: effects on life-history expression in Erysimum capitatum (Brassicaceae).
American Journal of Botany, 98, 1752–1761.
Kimball BA, Conley MM, Wang S, Xingwu L, Luo C, Morgan J, Smith D (2008) Infra-
red heater arrays for warming ecosystem field plots. Global Change Biology, 14,
309–320.
Kobayashi Y, Weigel D (2007) Move on up, it’s time for change – mobile signals con-
trolling photoperiod-dependent flowering. Genes Development, 21, 2371–2384.
Kranabetter JM, Stoehr MU, O’Neill GA (2012) Divergence in ectomycorrhizal com-
munities with foreign Douglas-fir populations and implications for assisted migra-
tion. Ecological Applications, 22, 550–560.
Kreyling J, Bittner T, Jaeschke A, Jentsch A, Steinbauer MJ, Thiel D, Beierkuhnlein C
(2011) Assisted colonization: a question of focal units and recipient localities. Res-
toration Ecology, 19, 433–440.
Lande R, Arnold SJ (1983) The measurement of selection on correlated characters.
Evolution, 37, 1210–1226.
Lawler JJ, Olden JD (2011) Reframing the debate over assisted colonization. Frontiers
in Ecology and the Environment, 9, 569–574.
Lee TD, Bazzaz FA (1982) Regulation of fruit maturation pattern in an annual legume,
Cassia fasciculata. Evolution, 63, 1374–1388.
Lee TD, Hartgerink AP (1986) Pollination intensity, fruit maturation pattern, and off-
spring quality in Cassia fasciculata (Leguminosae). In: Biotechnology and Ecology of
Pollen (eds Mulcahy DL, Mulcahy GB, Ottaviano E), pp. 417–422. Springer, New
York.
Leech SM, Aluedo PL, O’Neill G (2011) Assisted migration: adapting forest manage-
ment to a changing climate. BC Journal of Ecosystems and Management, 12, 18–34.
Lenoir J, Gegout JC, Marquet PA, de Ruffray P, Brisse H (2008) A significant upward
shift in plant species optimum elevation during the 20th century. Science, 320,
1768–1771.
Loss SR, Terwilliger LA, Peterson AC (2011) Assisted colonization: integrating con-
servation strategies in the face of climate change. Biological Conservation, 144, 92–
100.
Lu P, Parker WH, Cherry M, Colombo S, Parker WC, Man R, Roubal N (2014) Survi-
val and growth patterns of white spruce (Picea glauca [Moench] Voss) rangewide
provenances and their implications for climate change adaptation. Ecology and Evo-
lution, 4, 2360–2374.
Lunt ID, Byrne M, Hellmann JJ et al. (2013) Using assisted colonisation to conserve
biodiversity and restore ecosystem function under climate change. Biological Con-
servation, 157, 172–177.
McLachlan JS, Hellmann JJ, Schwartz MW (2007) A framework for debate of assisted
migration in an era of climate change. Conservation Biology, 21, 297–302.
McLane SC, Aitken SN (2012) Whitebark pine (Pinus albicaulis) assisted migration
potential: testing establishment north of the species range. Ecological Applications,
22, 142–153.
Meril€a J, Hendry AP (2013) Climate change, adaptation, and phenotypic plasticity:
the problem and the evidence. Evolutionary Applications, 7, 1–14.
Miller P, Lanier W, Brandt S (2001) Using growing degree days to predict plant
stages. Montana State University, USA, Extension Service.
Mitchell-Olds T, Shaw RG (1987) Regression analysis of natural selection: statistical
inference and biological interpretation. Evolution, 41, 1149–1161.
Moir ML, Vesk PA, Brennan KEC et al. (2012) Considering extinction of dependent
species during translocation, ex situ conservation, and assisted migration of threa-
tened hosts. Conservation Biology, 26, 199–207.
Morison JIL, Lawlor DW (1999) Interactions between increasing CO2 concentration
and temperature on plant growth. Plant, Cell and Environment, 22, 659–692.
Mueller JM, Hellmann JJ (2008) An assessment of invasion risk from assisted migra-
tion. Conservation Biology, 22, 562–567.
Neuheimer AB, Grønkjær P (2012) Climate effects on size-at age: growth in warming
waters compensates for earlier maturity in an exploited marine fish. Global Change
Biology, 18, 1812–1822.
© 2015 John Wiley Sons Ltd, Global Change Biology, doi: 10.1111/gcb.12988
3798 S. M. WADGYMAR et al.](https://image.slidesharecdn.com/39ffa16a-b5ca-41ac-ba75-5bf81811e585-151124202847-lva1-app6892/85/Weis-2-13-320.jpg)