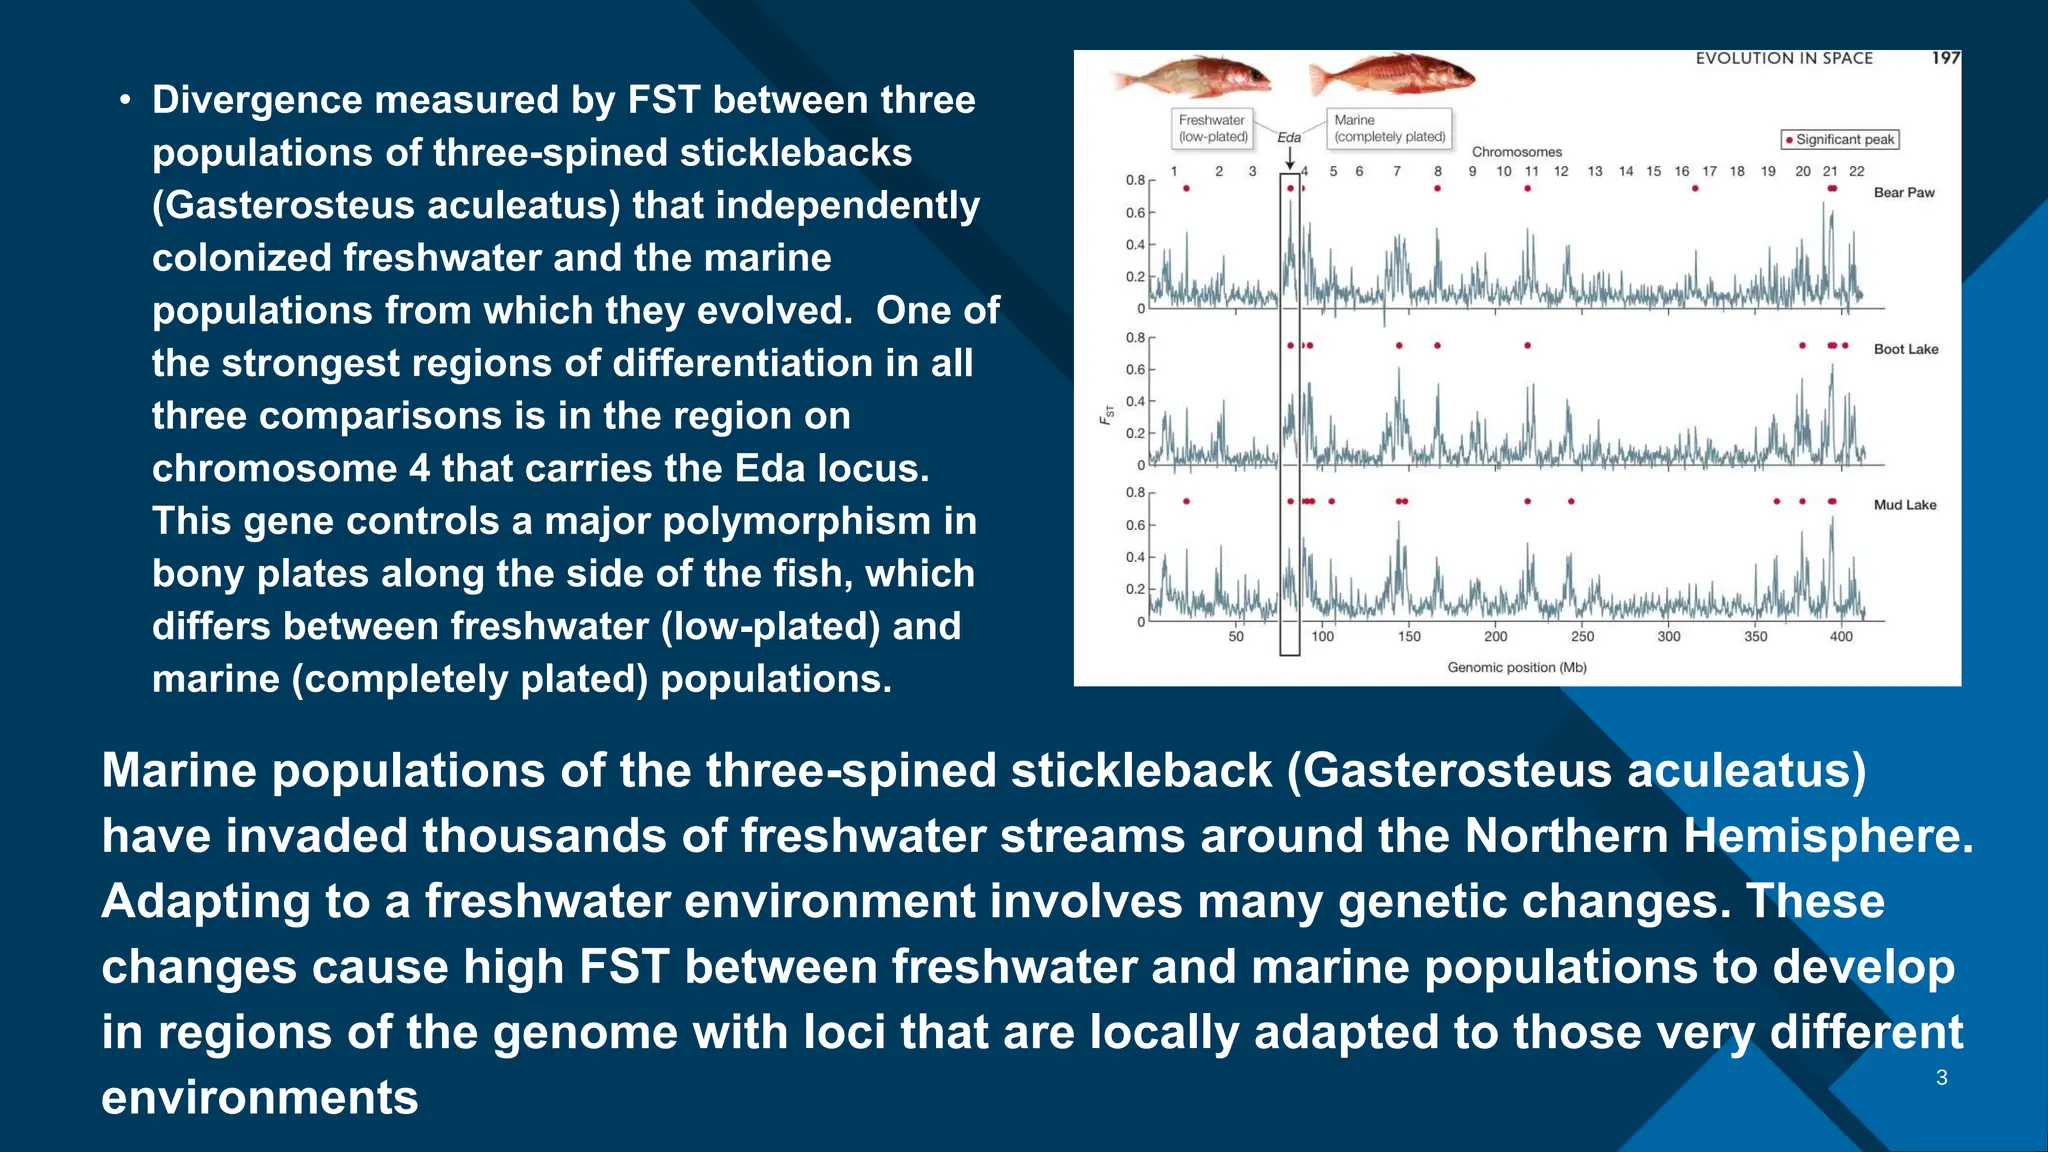
Click to edit Master title style
‹#›
Genetic Divergence
between Populations
P r e s e n t e d b y : I s k a k , M o h a i m i n S .
Click to edit Master title style
‹#›
Genetic Diveregence
Between Population
Genetic differences between populations can be described in
several ways. One of the most widely used approaches is
based on a statistic called FST, which measures the fraction of
the total genetic variance found across two or more populations
that results from genetic differences between them. A value of
FST = 0 means that the populations are genetically identical,
while a value of FST = 1 means that each population is fixed for
a different allele
2
Click to edit Master title style
‹#›
3
• FST is a statistic used to measure
genetic differences between two
or more populations. In this
schematic, two alleles at a locus
are represented by red and blue
circles. Top: FST = 0 when allele
frequencies are equal in the
populations. Middle: FST = 0.36
when allele frequencies are 0.2
and 0.8 in the two populations.
Bottom: FST = 1 when the
populations are fixed for different
alleles.
Click to edit Master title style
‹#›
3
• FST is often used to measure genetic
differences among human populations. The
International HapMap Project analyzed
differentiation in single nucleotide
polymorphisms (SNPs) across the genomes
of East Asians, Europeans, and Yoruba from
Nigeria. Across all the autosomes, FST is
0.12. This tells us that only 12 percent of all
the genetic variation in these populations is
caused by differences among them. A full 88
percent of all the variation in our species can
be found within a typical population. The
striking phenotypic differences we see
among human populations are therefore not
representative of the genome as a whole.
For a locus with two alleles, it is
calculated as where Var(p) is the
variance of the allele frequency among
populations, and p – is the mean allele
frequency across all the populations.
Click to edit Master title style
‹#›
3
• Isolation-by-distance in human
populations. The horizontal axis has
been corrected for large bodies of water
that could not be crossed when humans
first spread across Earth. The vertical
axis gives FST estimated from 783 loci.
Each dot represents a comparison
between a pair of populations from the
indicated region(s).
ISOLATION-BY-DISTANCE
In humans, it reflects the history of how we colonized different parts of Earth. A similar pattern can
also result from a balance between gene flow and random genetic drift. In other species, the
picture of genetic differentiation is quite different. Populations of the northern dusky salamander
(Desmognathus fuscus) living near New York City have FST values more than four times larger
than those in human populations spread across the entire planet [23]. The contrast between the
relatively low values of FST in humans and the high values in the salamander underlines the point
that simple measures of genetic similarity cannot be used to determine which populations do and
do not belong to the same species.
Click to edit Master title style
‹#›
3
• Divergence measured by FST between three
populations of three-spined sticklebacks
(Gasterosteus aculeatus) that independently
colonized freshwater and the marine
populations from which they evolved. One of
the strongest regions of differentiation in all
three comparisons is in the region on
chromosome 4 that carries the Eda locus.
This gene controls a major polymorphism in
bony plates along the side of the fish, which
differs between freshwater (low-plated) and
marine (completely plated) populations.
Marine populations of the three-spined stickleback (Gasterosteus aculeatus)
have invaded thousands of freshwater streams around the Northern Hemisphere.
Adapting to a freshwater environment involves many genetic changes. These
changes cause high FST between freshwater and marine populations to develop
in regions of the genome with loci that are locally adapted to those very different
environments
Click to edit Master title style
‹#›
4
Differences between populations can be caused by phenotypic plasticity as well as by genetic
divergence. A famous study by Clausen, Keck, and Hiesey concerns yarrow (Achillea millefolium), a
plant that grows from sea level up to tree line in the mountains of California. In their natural habitat,
plants at high elevations are much shorter than those at low elevations. This is likely adaptive
because tall plants attract more pollinators and have greater fecundity at low elevations, while short
plants are able to flower before winter arrives at high elevations. These results show that both
genetic variation and plasticity contribute to the differences seen among populations growing at
different elevations. In the yarrow, both genes and plasticity contribute to local adaptation.
Click to edit Master title style
‹#›
Gene Flow and Selection
5
• When selection favors different alleles or phenotypes in different
places, a tension develops between local selection, which
enhances the genetic differences between populations, and gene
flow, which erodes them. Without gene flow, selection would
cause whatever alleles have highest fitness at any place to
become fixed there. Without selection (or genetic drift), gene flow
would make allele frequencies equal everywhere. The clines and
other spatial patterns seen in nature are compromises between
those extremes. The tug-of-war between gene flow and selection
plays out in the grass growing on the mine in Wales that was
discussed earlier.
Click to edit Master title style
‹#›
Rock Pocket Mouse
(Chaetodipus Intermedeus)
6
• The rock pocket mouse
(Chaetodipus intermedius) lives
in the desert southwest of the
United States where the
landscape is a patchwork of dark
fields of lava (much like islands)
surrounded by light-colored
granite and sand. While most
populations of this mouse are
light colored, a dark form is
common on the lava, where it is
camouflaged from the owls that
prey on it.
Click to edit Master title style
‹#›
Gene Flow and Selection
5
• The evolutionary tension between selection and gene flow plays out in
continuous habitats as well as on islands. Consider a grass growing in a
prairie that has two kinds of soil that meet at a sharp boundary. The soil
to the west of the boundary favors allele A1, while the soil to the east
favors allele A2. To be specific, say that allele A1 has a relative fitness
advantage of s in the west, while A2 has the same advantage in the east,
and there is no dominance. What happens? Without gene flow, A1 will
become fixed everywhere to the west of the boundary, and A2 will be
fixed everywhere to the east. But with gene flow, alleles move across the
boundary.
Click to edit Master title style
‹#›
4
The cline can be short or long, depending on the relative
strengths of gene flow and selection.
This is the width of region over which allele A2 increases from a low
frequency (p = 0.1) to a high frequency (p = 0.9).
Click to edit Master title style
‹#›
7
• Clines in allele frequencies predicted by a mathematical model. The horizontal axis
is distance along a transect. The vertical axis is the frequency of allele A2, which
has a relative fitness of 1 – s to the left (west) of x = 0, and fitness 1 + s to the right
(east). The four curves show the clines for different values of the ratio of the
migration variance to the selection coefficient, σm 2 /s. The clines become flatter as
the strength of gene flow increases relative to selection. (B) The cline width, wc, is
the distance over which the allele frequency changes from 0.1 to 0.9.
• Clines also develop when the transition between two types of habitats is gradual. In
that case, the shape of the cline is typically similar to those in Figure 8.11, even
though the clines in that figure result from an abrupt change in selection. The
shape of a cline therefore does not tell us much about whether selection varies
abruptly or in a smooth gradient
Click to edit Master title style
‹#›
Tension Zone
8
• Tension zones are clines that form when there is
selection against heterozygotes. The
grasshopper Podisma pedestris is polymorphic
for a chromosome fusion. Where populations
with and without the fusion meet in the foothills
of the Alps, clines in the frequency of the
inversion form because heterozygotes have
reduced fertility. The filled part of each pie
diagram represents the frequency of the fusion.
The cline in the frequency of the fusion is only a
few dozen meters wide.
• These clines result from strong selection
against fusion heterozygotes, which have low
fertility. Clines that result from selection against
heterozygotes are called tension zones. They
often occur in areas where two species
hybridize
Click to edit Master title style
‹#›
Thank You 1

genetic Divergence between population.pptx

  • 1.
    Click to editMaster title style ‹#› Genetic Divergence between Populations P r e s e n t e d b y : I s k a k , M o h a i m i n S .
  • 2.
    Click to editMaster title style ‹#› Genetic Diveregence Between Population Genetic differences between populations can be described in several ways. One of the most widely used approaches is based on a statistic called FST, which measures the fraction of the total genetic variance found across two or more populations that results from genetic differences between them. A value of FST = 0 means that the populations are genetically identical, while a value of FST = 1 means that each population is fixed for a different allele 2
  • 3.
    Click to editMaster title style ‹#› 3 • FST is a statistic used to measure genetic differences between two or more populations. In this schematic, two alleles at a locus are represented by red and blue circles. Top: FST = 0 when allele frequencies are equal in the populations. Middle: FST = 0.36 when allele frequencies are 0.2 and 0.8 in the two populations. Bottom: FST = 1 when the populations are fixed for different alleles.
  • 4.
    Click to editMaster title style ‹#› 3 • FST is often used to measure genetic differences among human populations. The International HapMap Project analyzed differentiation in single nucleotide polymorphisms (SNPs) across the genomes of East Asians, Europeans, and Yoruba from Nigeria. Across all the autosomes, FST is 0.12. This tells us that only 12 percent of all the genetic variation in these populations is caused by differences among them. A full 88 percent of all the variation in our species can be found within a typical population. The striking phenotypic differences we see among human populations are therefore not representative of the genome as a whole. For a locus with two alleles, it is calculated as where Var(p) is the variance of the allele frequency among populations, and p – is the mean allele frequency across all the populations.
  • 5.
    Click to editMaster title style ‹#› 3 • Isolation-by-distance in human populations. The horizontal axis has been corrected for large bodies of water that could not be crossed when humans first spread across Earth. The vertical axis gives FST estimated from 783 loci. Each dot represents a comparison between a pair of populations from the indicated region(s). ISOLATION-BY-DISTANCE In humans, it reflects the history of how we colonized different parts of Earth. A similar pattern can also result from a balance between gene flow and random genetic drift. In other species, the picture of genetic differentiation is quite different. Populations of the northern dusky salamander (Desmognathus fuscus) living near New York City have FST values more than four times larger than those in human populations spread across the entire planet [23]. The contrast between the relatively low values of FST in humans and the high values in the salamander underlines the point that simple measures of genetic similarity cannot be used to determine which populations do and do not belong to the same species.
  • 6.
    Click to editMaster title style ‹#› 3 • Divergence measured by FST between three populations of three-spined sticklebacks (Gasterosteus aculeatus) that independently colonized freshwater and the marine populations from which they evolved. One of the strongest regions of differentiation in all three comparisons is in the region on chromosome 4 that carries the Eda locus. This gene controls a major polymorphism in bony plates along the side of the fish, which differs between freshwater (low-plated) and marine (completely plated) populations. Marine populations of the three-spined stickleback (Gasterosteus aculeatus) have invaded thousands of freshwater streams around the Northern Hemisphere. Adapting to a freshwater environment involves many genetic changes. These changes cause high FST between freshwater and marine populations to develop in regions of the genome with loci that are locally adapted to those very different environments
  • 7.
    Click to editMaster title style ‹#› 4 Differences between populations can be caused by phenotypic plasticity as well as by genetic divergence. A famous study by Clausen, Keck, and Hiesey concerns yarrow (Achillea millefolium), a plant that grows from sea level up to tree line in the mountains of California. In their natural habitat, plants at high elevations are much shorter than those at low elevations. This is likely adaptive because tall plants attract more pollinators and have greater fecundity at low elevations, while short plants are able to flower before winter arrives at high elevations. These results show that both genetic variation and plasticity contribute to the differences seen among populations growing at different elevations. In the yarrow, both genes and plasticity contribute to local adaptation.
  • 8.
    Click to editMaster title style ‹#› Gene Flow and Selection 5 • When selection favors different alleles or phenotypes in different places, a tension develops between local selection, which enhances the genetic differences between populations, and gene flow, which erodes them. Without gene flow, selection would cause whatever alleles have highest fitness at any place to become fixed there. Without selection (or genetic drift), gene flow would make allele frequencies equal everywhere. The clines and other spatial patterns seen in nature are compromises between those extremes. The tug-of-war between gene flow and selection plays out in the grass growing on the mine in Wales that was discussed earlier.
  • 9.
    Click to editMaster title style ‹#› Rock Pocket Mouse (Chaetodipus Intermedeus) 6 • The rock pocket mouse (Chaetodipus intermedius) lives in the desert southwest of the United States where the landscape is a patchwork of dark fields of lava (much like islands) surrounded by light-colored granite and sand. While most populations of this mouse are light colored, a dark form is common on the lava, where it is camouflaged from the owls that prey on it.
  • 10.
    Click to editMaster title style ‹#› Gene Flow and Selection 5 • The evolutionary tension between selection and gene flow plays out in continuous habitats as well as on islands. Consider a grass growing in a prairie that has two kinds of soil that meet at a sharp boundary. The soil to the west of the boundary favors allele A1, while the soil to the east favors allele A2. To be specific, say that allele A1 has a relative fitness advantage of s in the west, while A2 has the same advantage in the east, and there is no dominance. What happens? Without gene flow, A1 will become fixed everywhere to the west of the boundary, and A2 will be fixed everywhere to the east. But with gene flow, alleles move across the boundary.
  • 11.
    Click to editMaster title style ‹#› 4 The cline can be short or long, depending on the relative strengths of gene flow and selection. This is the width of region over which allele A2 increases from a low frequency (p = 0.1) to a high frequency (p = 0.9).
  • 12.
    Click to editMaster title style ‹#› 7 • Clines in allele frequencies predicted by a mathematical model. The horizontal axis is distance along a transect. The vertical axis is the frequency of allele A2, which has a relative fitness of 1 – s to the left (west) of x = 0, and fitness 1 + s to the right (east). The four curves show the clines for different values of the ratio of the migration variance to the selection coefficient, σm 2 /s. The clines become flatter as the strength of gene flow increases relative to selection. (B) The cline width, wc, is the distance over which the allele frequency changes from 0.1 to 0.9. • Clines also develop when the transition between two types of habitats is gradual. In that case, the shape of the cline is typically similar to those in Figure 8.11, even though the clines in that figure result from an abrupt change in selection. The shape of a cline therefore does not tell us much about whether selection varies abruptly or in a smooth gradient
  • 13.
    Click to editMaster title style ‹#› Tension Zone 8 • Tension zones are clines that form when there is selection against heterozygotes. The grasshopper Podisma pedestris is polymorphic for a chromosome fusion. Where populations with and without the fusion meet in the foothills of the Alps, clines in the frequency of the inversion form because heterozygotes have reduced fertility. The filled part of each pie diagram represents the frequency of the fusion. The cline in the frequency of the fusion is only a few dozen meters wide. • These clines result from strong selection against fusion heterozygotes, which have low fertility. Clines that result from selection against heterozygotes are called tension zones. They often occur in areas where two species hybridize
  • 14.
    Click to editMaster title style ‹#› Thank You 1