Download as PDF, PPTX

![Perguntas
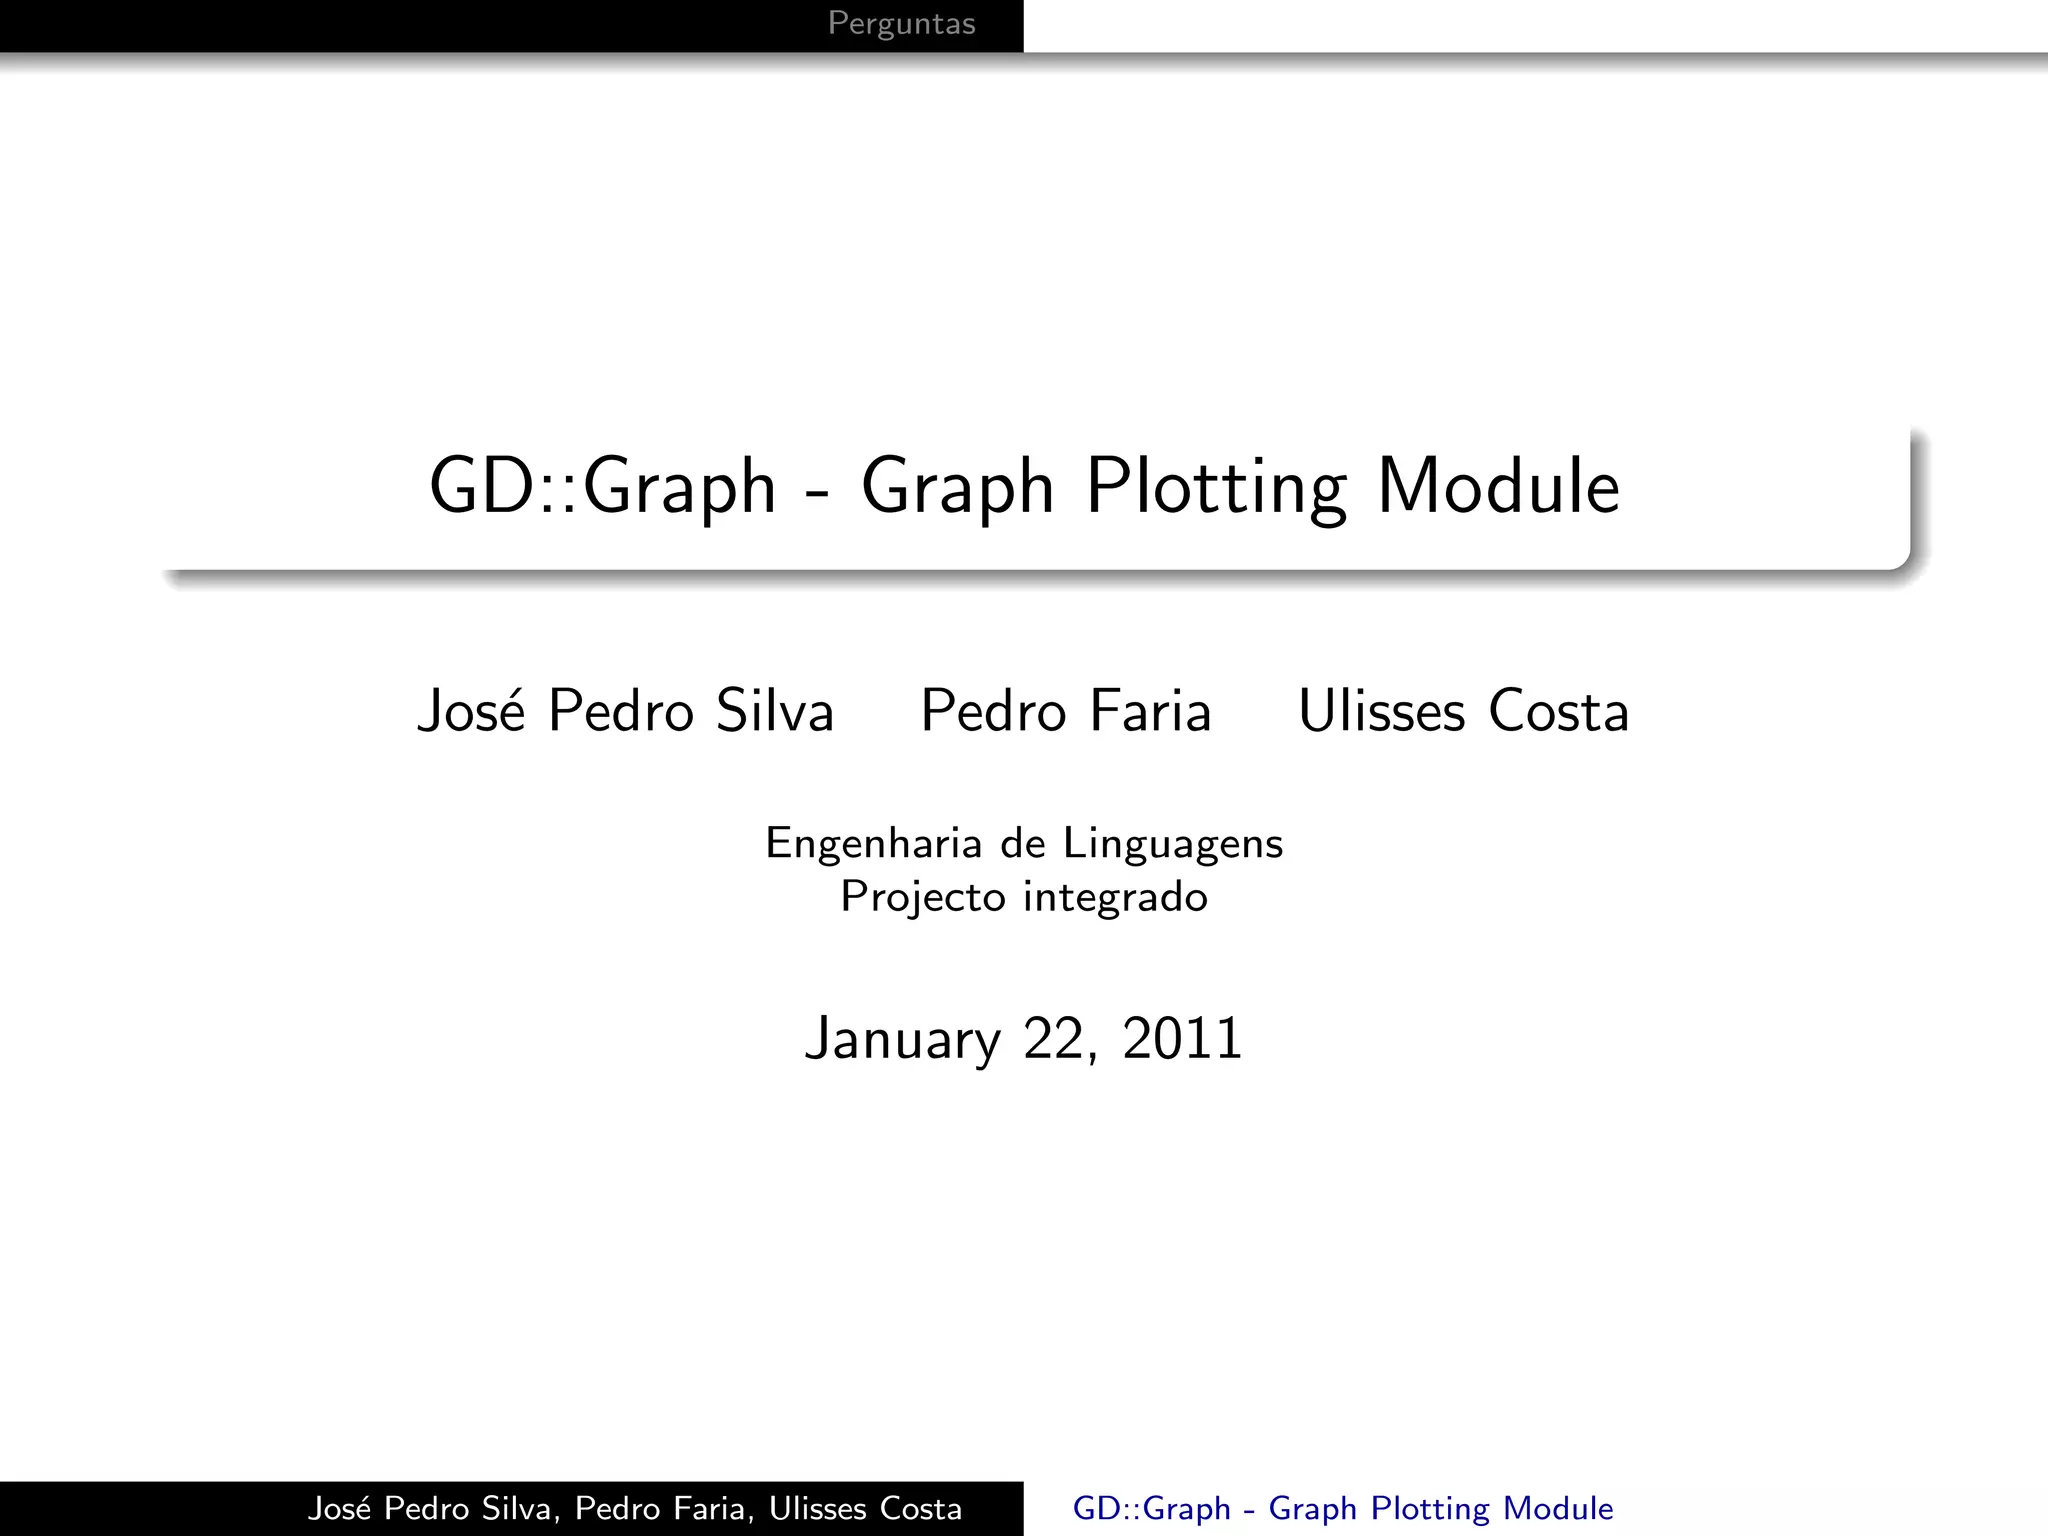
Bars
1 sub plotPng {
2 my $fileName = shift ;
3 @data = ( ["1 st " ,"2 nd " ,"3 rd " ,"4 th " ,"5 th " ,"6 th " ,"7 th " , "8 th " , "9 th "] ,
4 [ 1, 2, 5, 6, 3 , 1.5 , 1, 3, 4]
5 );
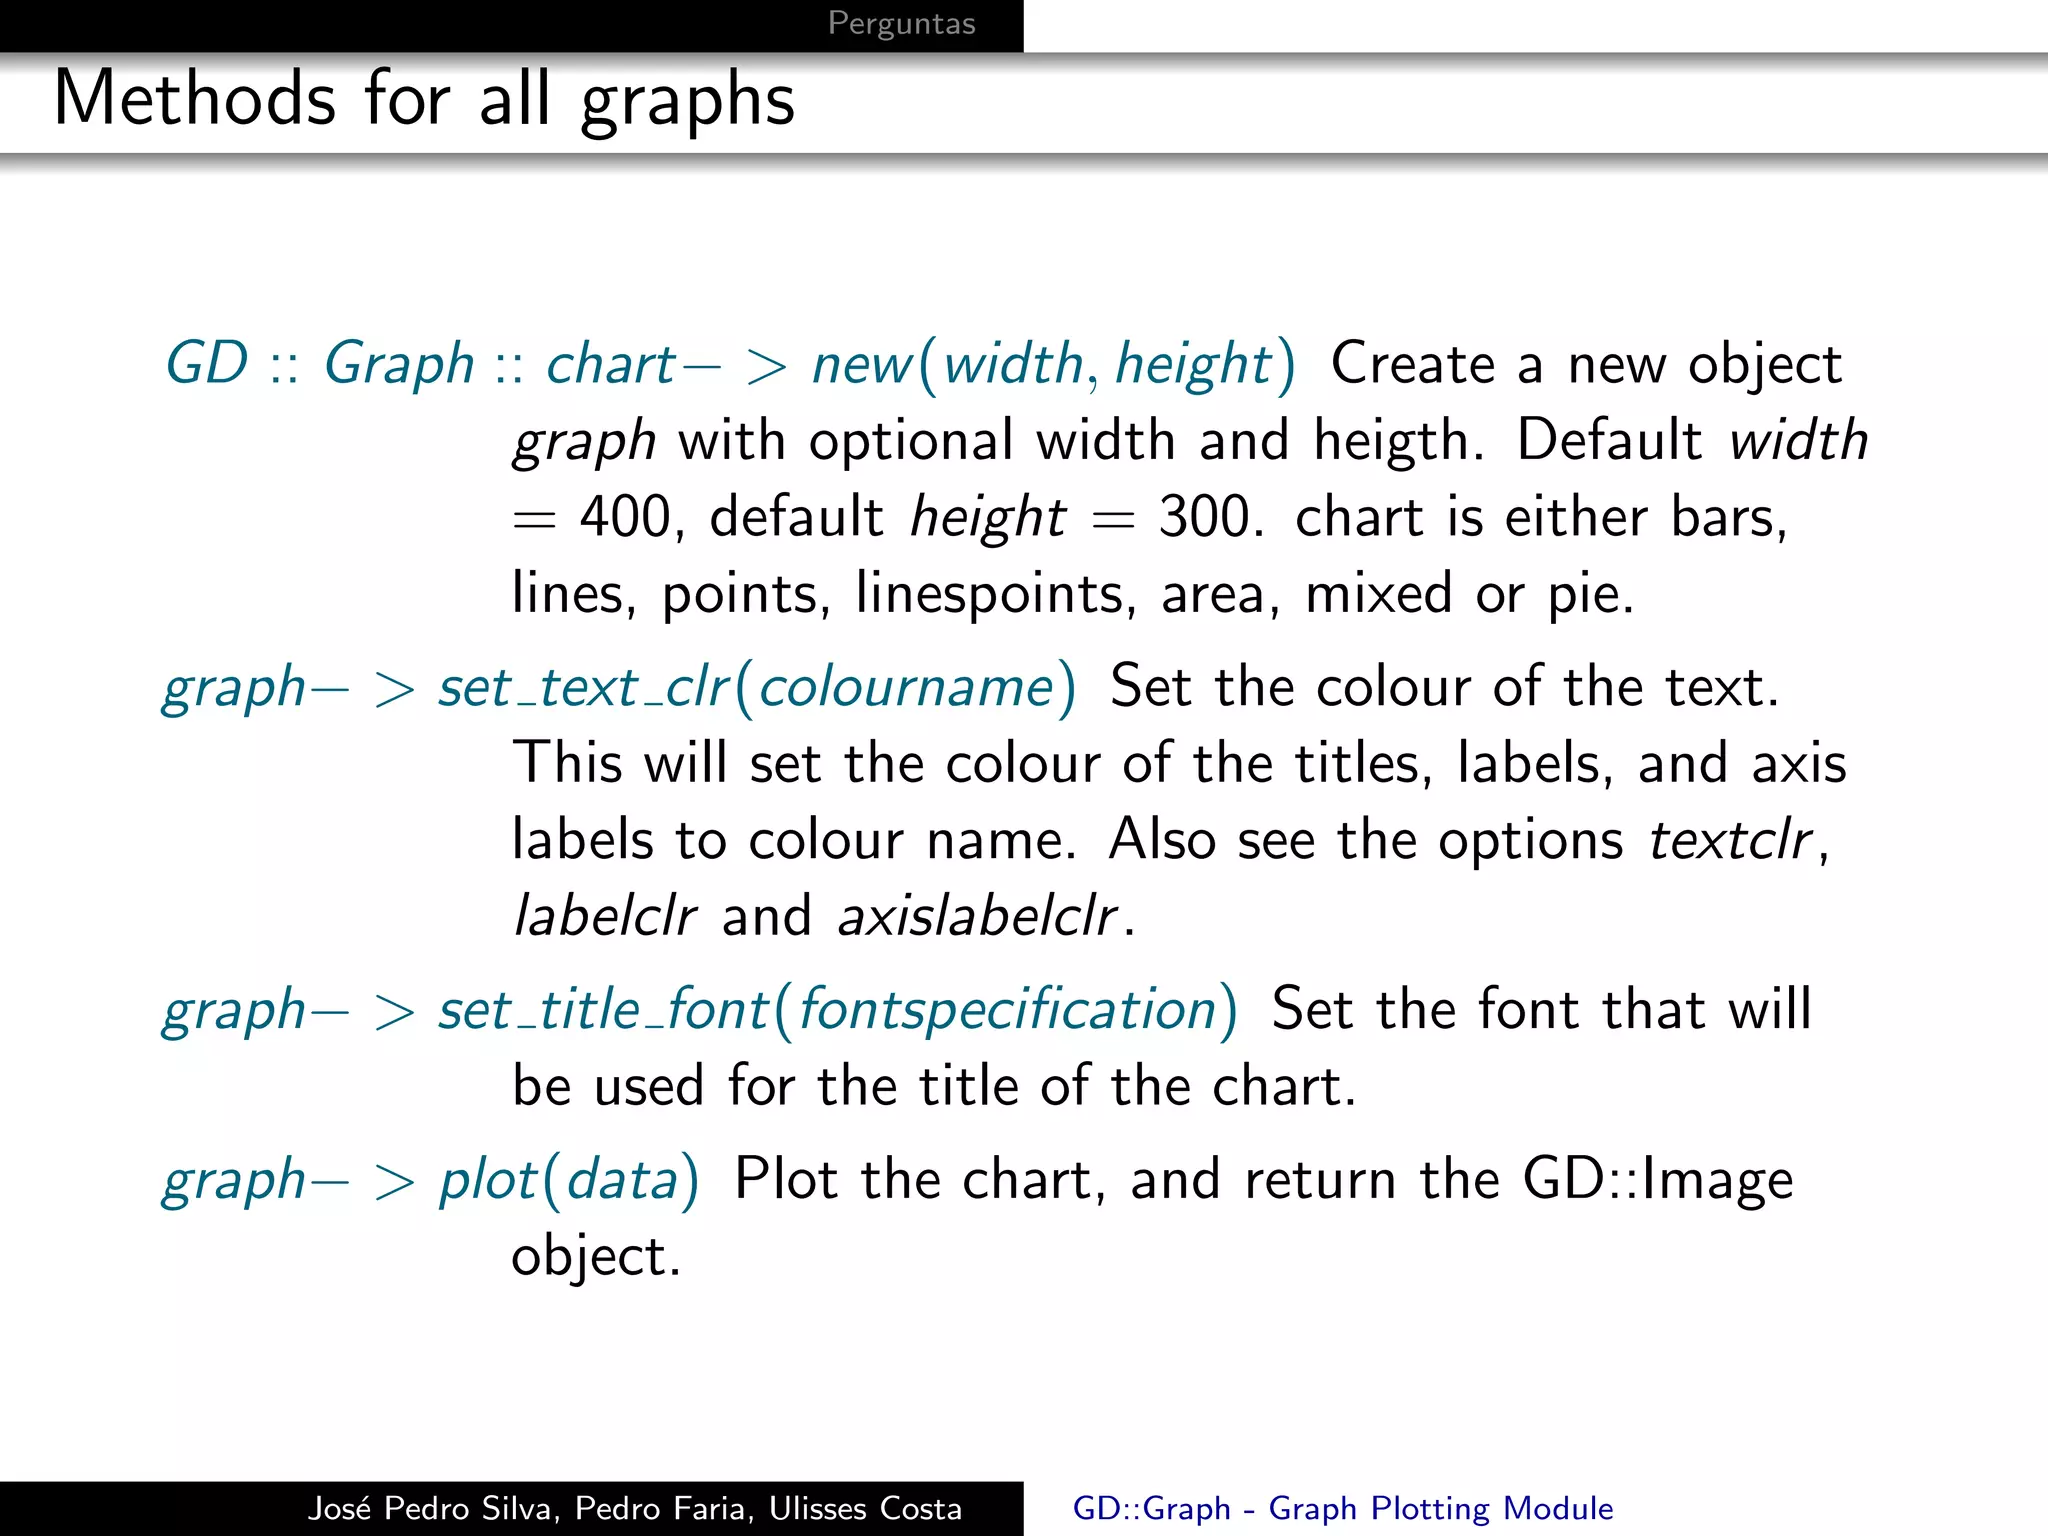
6 my $mygraph = GD :: Graph :: bars - > new (600 , 400) ;
7
8 $mygraph - > set (
9 x_label = > " Contestant " ,
10 y_label = > " Time " ,
11 title = > " Times of the contestants " ,
12 dclrs = > [ qw ( gold red green ) ] ,
13 ) or warn $mygraph - > error ;
14
15 my $myimage = $mygraph - > plot ( @data ) or warn $mygraph - > error ;
16
17 open ( IMG , ’>’ , $fileName ) ;
18 binmode IMG ;
19 print IMG $myimage - > png ;
20 close ( IMG ) ;
21 }
Jos´ Pedro Silva, Pedro Faria, Ulisses Costa
e GD::Graph - Graph Plotting Module](https://image.slidesharecdn.com/pres-110122052647-phpapp01/75/GD-Graph-Graph-Plotting-Module-3-2048.jpg)
![Perguntas
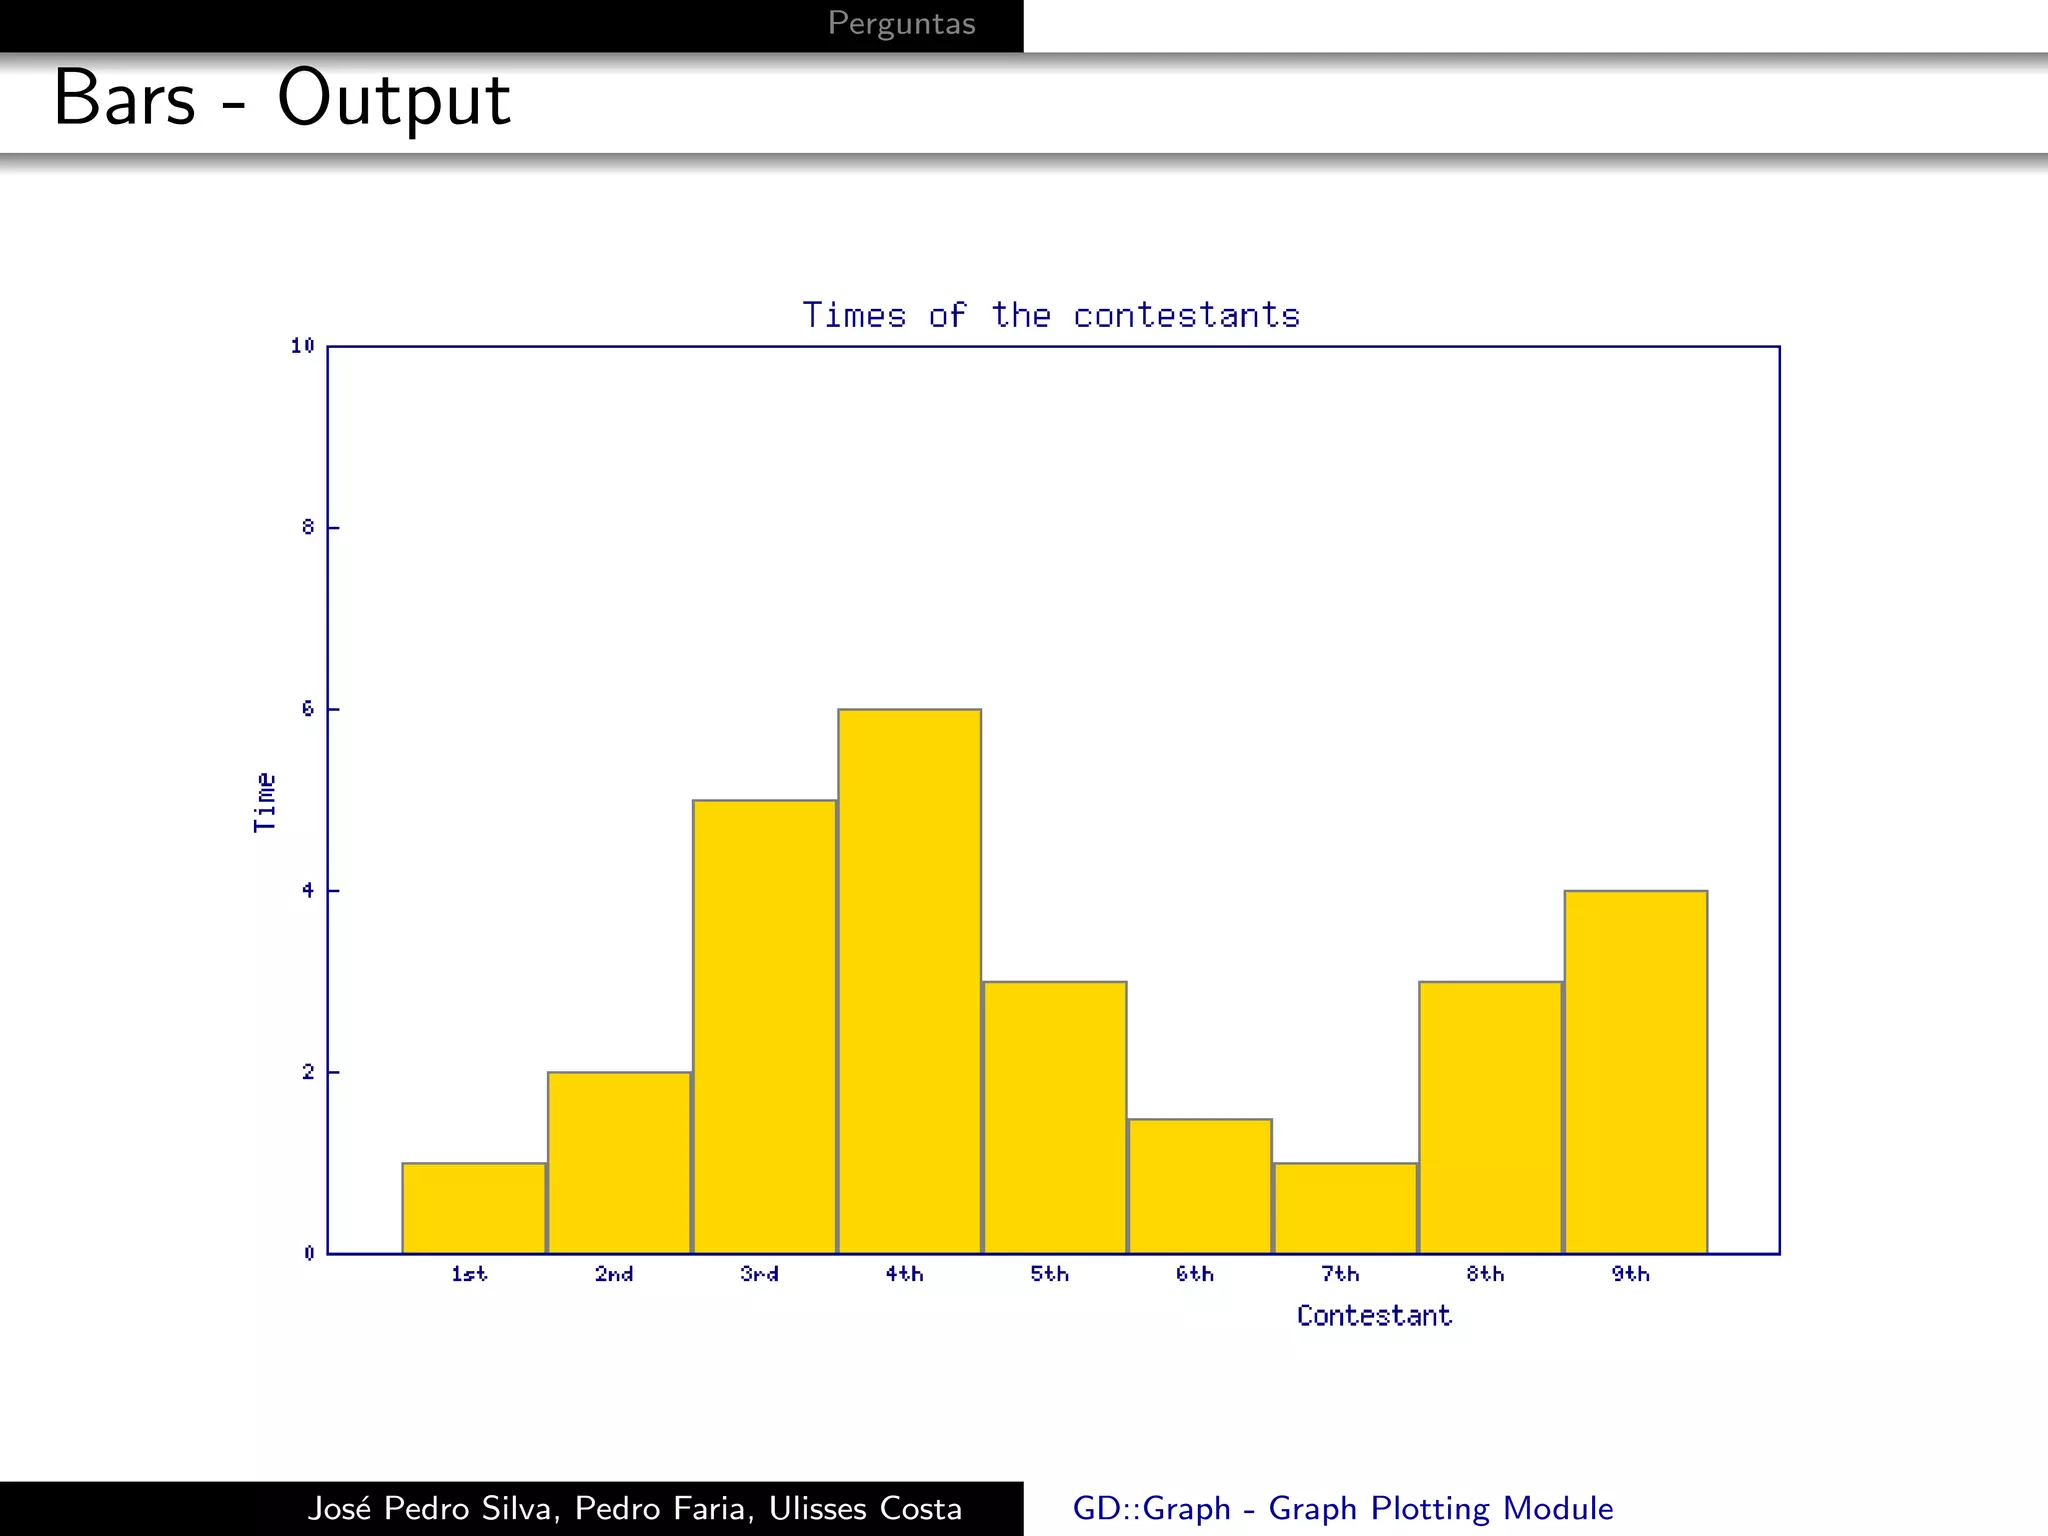
Pie
1 sub plotPng {
2 my $fileName = shift ;
3 @data = ( ["1 st " ,"2 nd " ,"3 rd " ,"4 th " ,"5 th " ,"6 th " ,"7 th " , "8 th " , "9 th "] ,
4 [ 1, 2, 5, 6, 3 , 1.5 , 1, 3, 4]
5 );
6 my $mygraph = GD :: Graph :: pie - > new (600 , 400) ;
7
8 $mygraph - > set (
9 title = > " Times of the contestants " ,
10 dclrs = > [ qw ( gold red green ) ] ,
11 ) or warn $mygraph - > error ;
12
13 my $myimage = $mygraph - > plot ( @data ) or warn $mygraph - > error ;
14
15 open ( IMG , ’>’ , $fileName ) ;
16 binmode IMG ;
17 print IMG $myimage - > png ;
18 close ( IMG ) ;
19 }
Jos´ Pedro Silva, Pedro Faria, Ulisses Costa
e GD::Graph - Graph Plotting Module](https://image.slidesharecdn.com/pres-110122052647-phpapp01/75/GD-Graph-Graph-Plotting-Module-5-2048.jpg)
![Perguntas
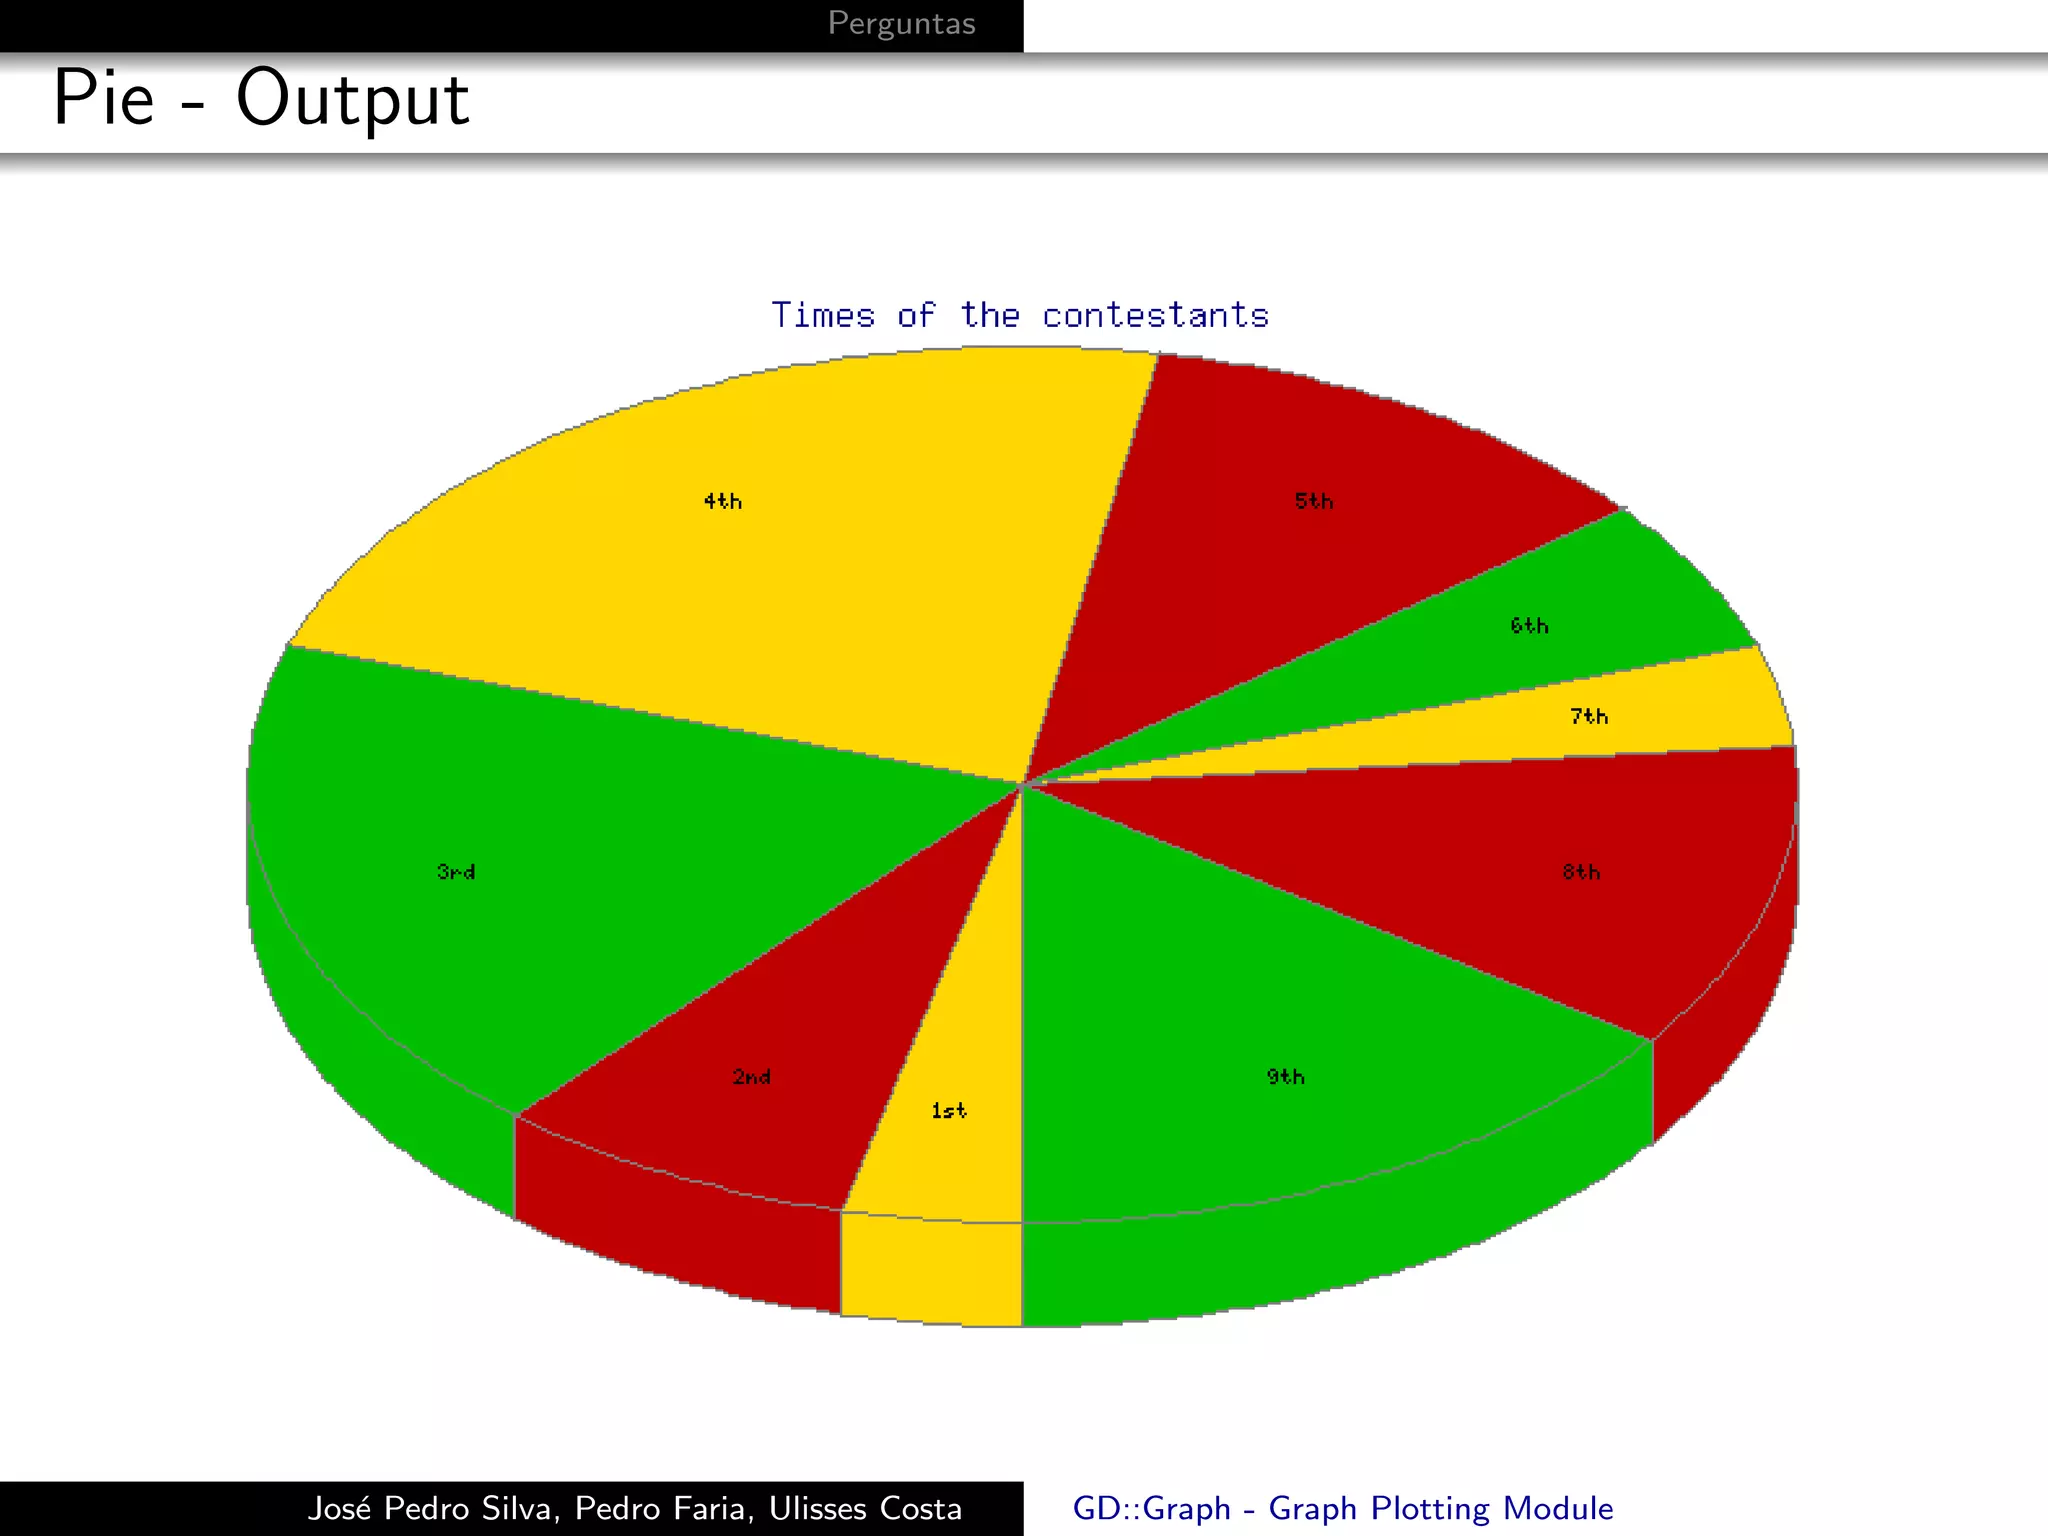
Line
1 sub plotPng {
2 my $fileName = shift ;
3 @data = ( ["1 st " ,"2 nd " ,"3 rd " ,"4 th " ,"5 th " ,"6 th " ,"7 th " , "8 th " , "9 th "] ,
4 [ 1, 2, 5, 6, 3 , 1.5 , 1, 3, 4]
5 );
6 my $mygraph = GD :: Graph :: area - > new (600 , 400) ;
7
8 $mygraph - > set (
9 title = > " Times of the contestants " ,
10 dclrs = > [ qw ( gold red green ) ] ,
11 ) or warn $mygraph - > error ;
12
13 my $myimage = $mygraph - > plot ( @data ) or warn $mygraph - > error ;
14
15 open ( IMG , ’>’ , $fileName ) ;
16 binmode IMG ;
17 print IMG $myimage - > png ;
18 close ( IMG ) ;
19 }
Jos´ Pedro Silva, Pedro Faria, Ulisses Costa
e GD::Graph - Graph Plotting Module](https://image.slidesharecdn.com/pres-110122052647-phpapp01/75/GD-Graph-Graph-Plotting-Module-7-2048.jpg)
![Perguntas
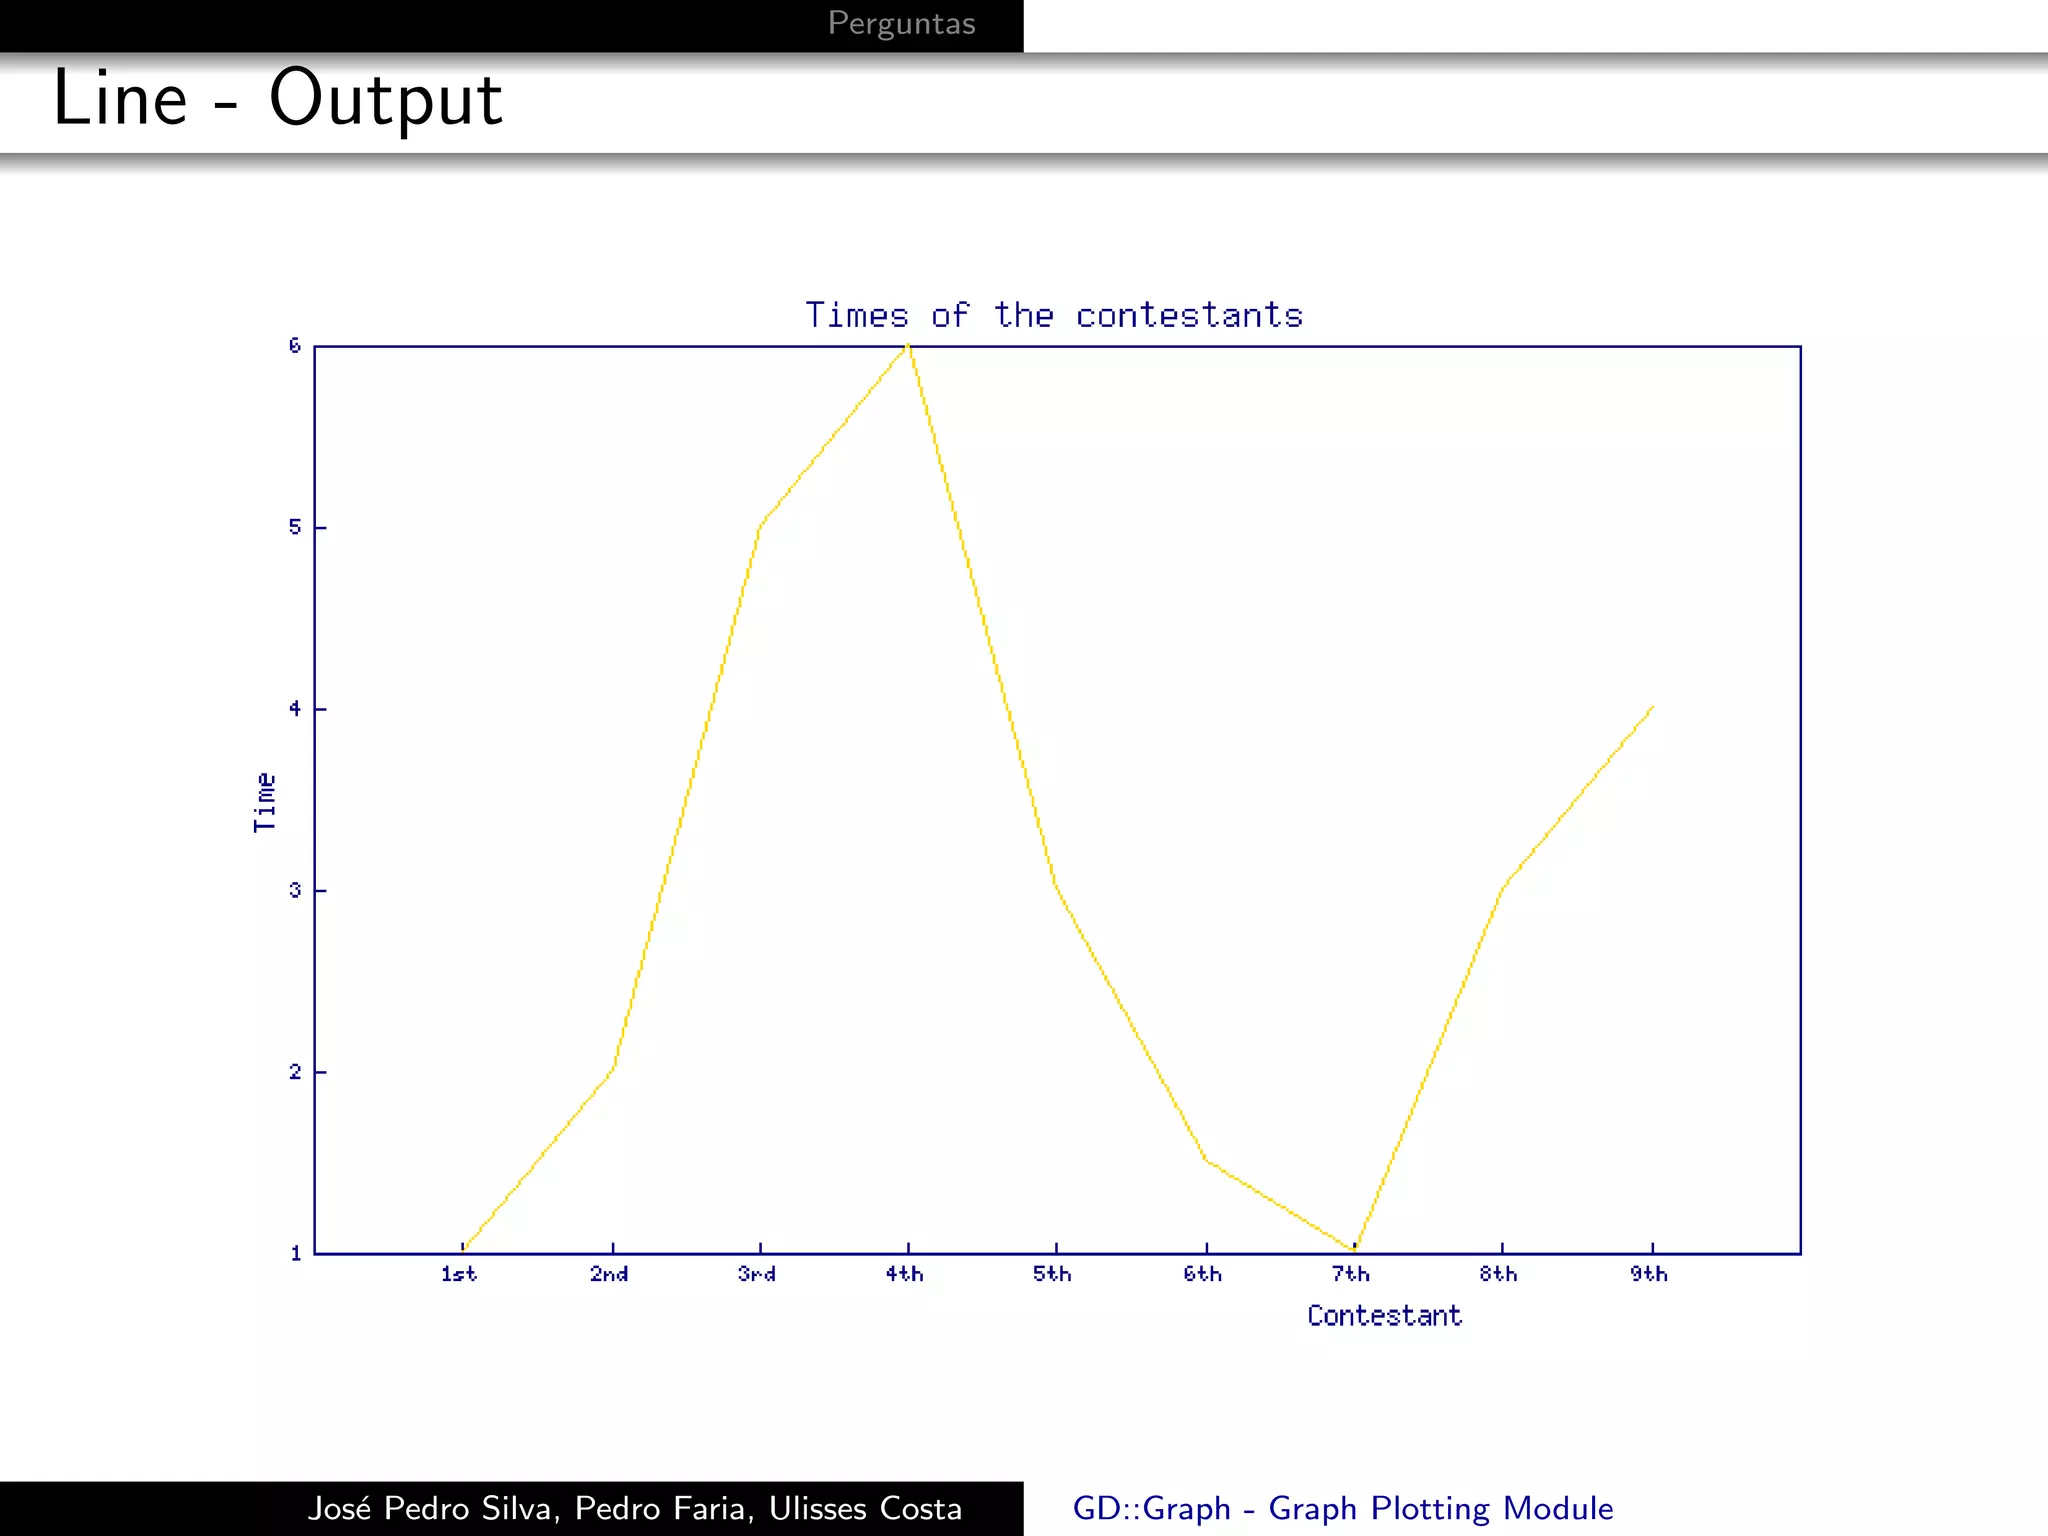
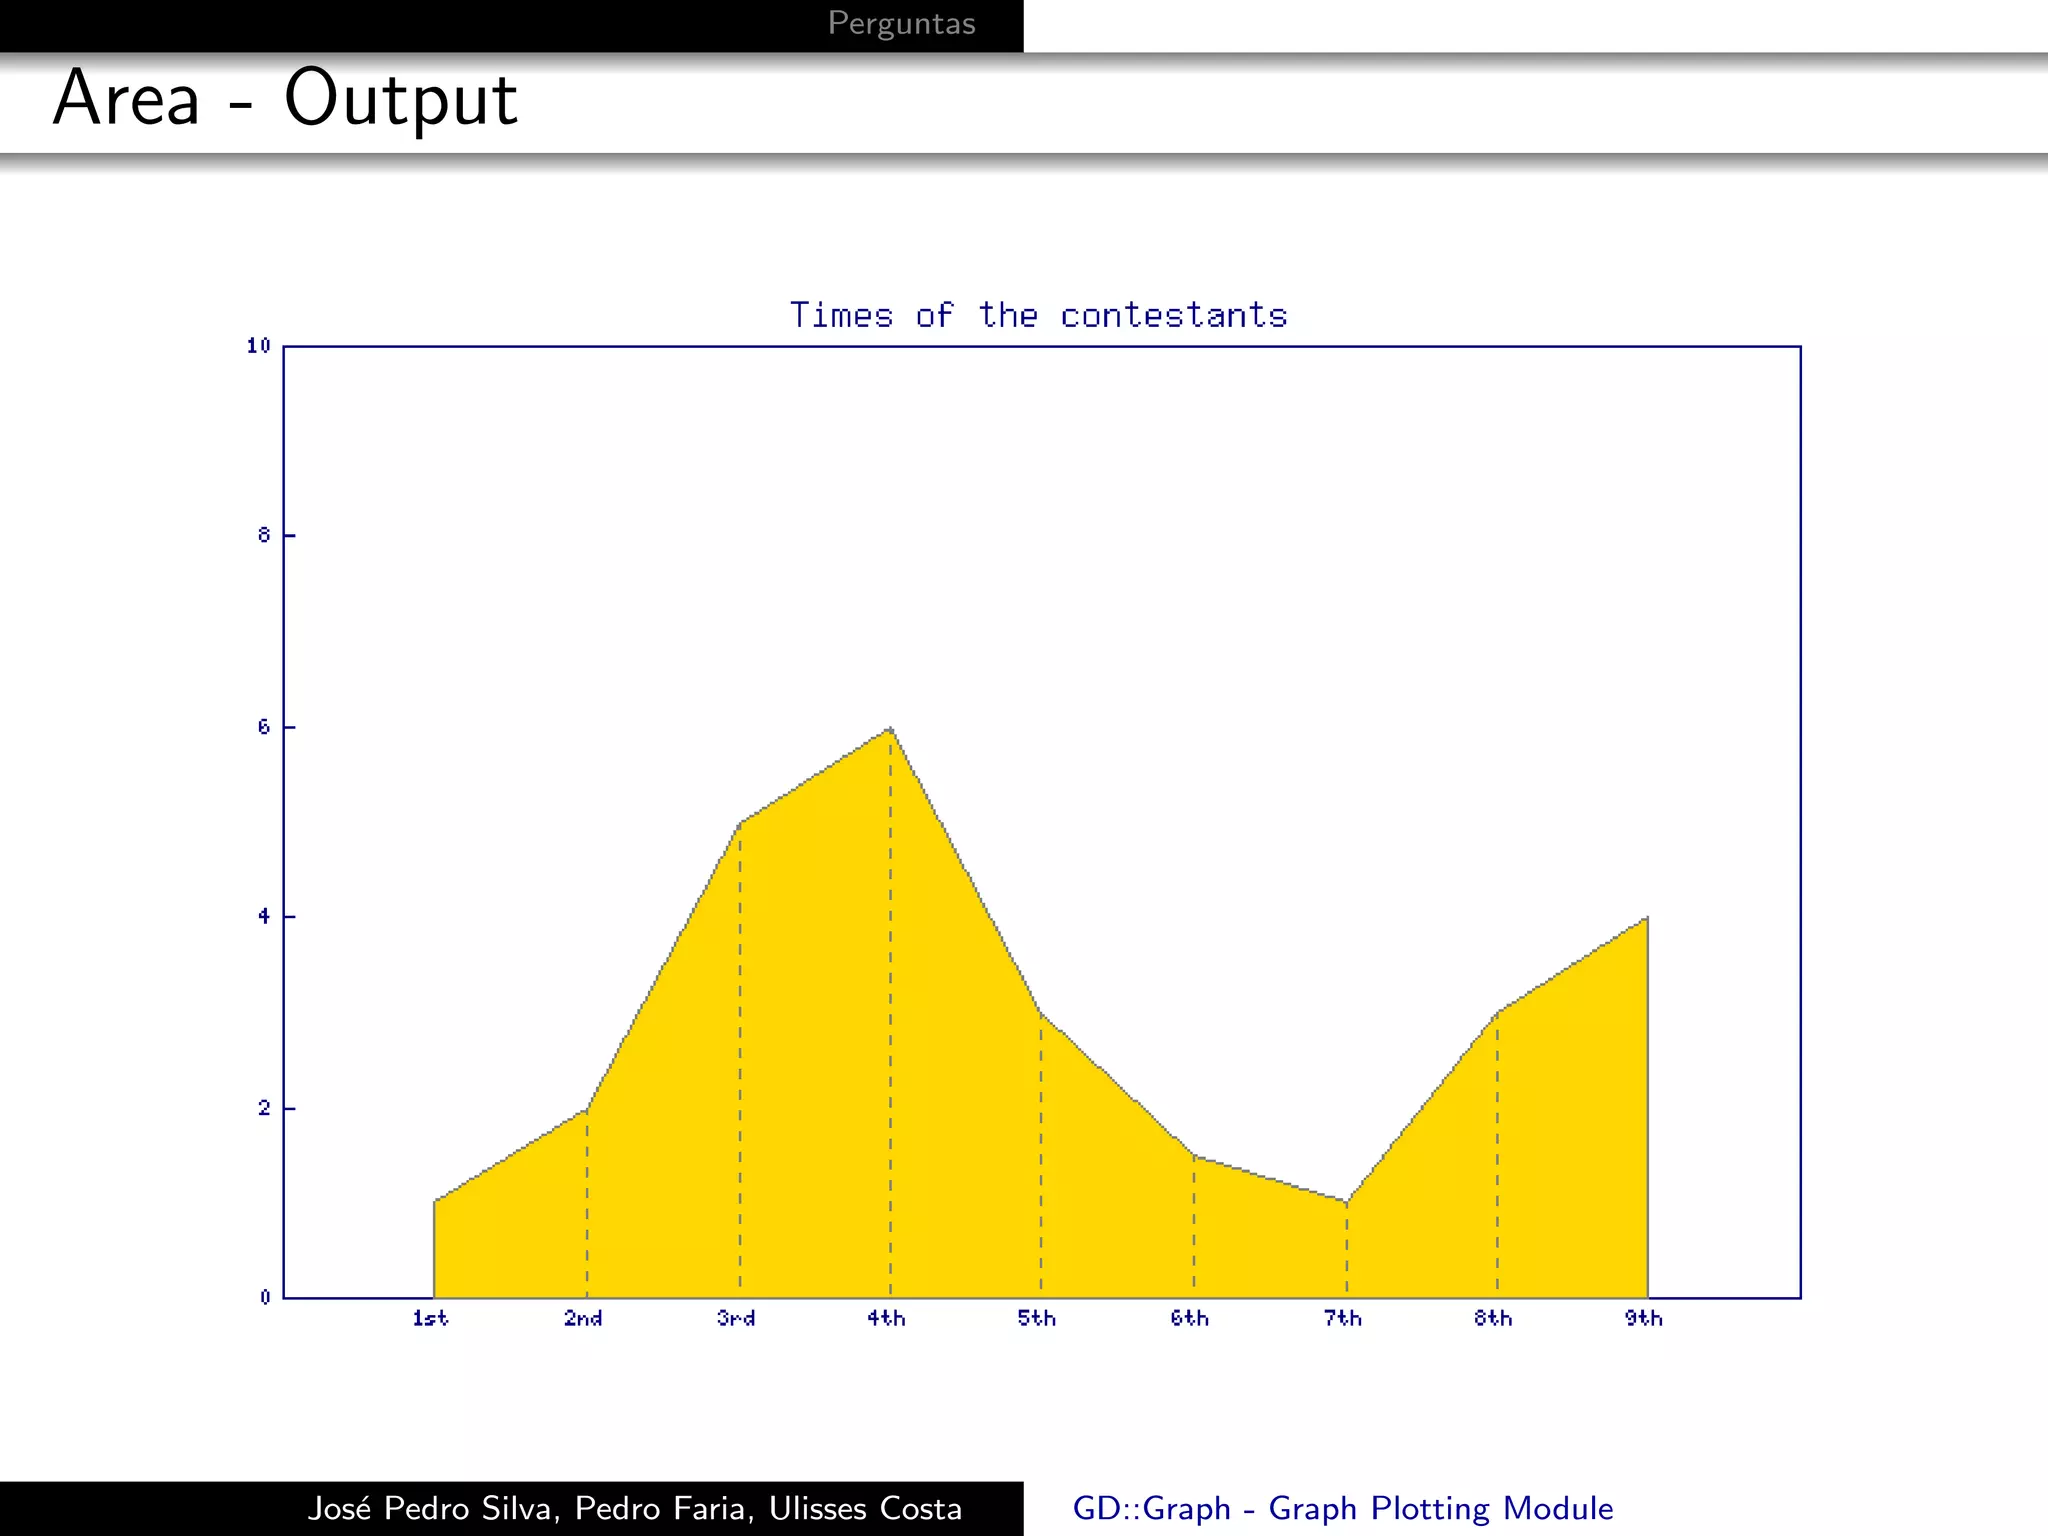
Area
1 sub plotPng {
2 my $fileName = shift ;
3 @data = ( ["1 st " ,"2 nd " ,"3 rd " ,"4 th " ,"5 th " ,"6 th " ,"7 th " , "8 th " , "9 th "] ,
4 [ 1, 2, 5, 6, 3 , 1.5 , 1, 3, 4]
5 );
6 my $mygraph = GD :: Graph :: area - > new (600 , 400) ;
7
8 $mygraph - > set (
9 title = > " Times of the contestants " ,
10 dclrs = > [ qw ( gold red green ) ] ,
11 ) or warn $mygraph - > error ;
12
13 my $myimage = $mygraph - > plot ( @data ) or warn $mygraph - > error ;
14
15 open ( IMG , ’>’ , $fileName ) ;
16 binmode IMG ;
17 print IMG $myimage - > png ;
18 close ( IMG ) ;
19 }
Jos´ Pedro Silva, Pedro Faria, Ulisses Costa
e GD::Graph - Graph Plotting Module](https://image.slidesharecdn.com/pres-110122052647-phpapp01/75/GD-Graph-Graph-Plotting-Module-9-2048.jpg)
![Perguntas
Points and Lines
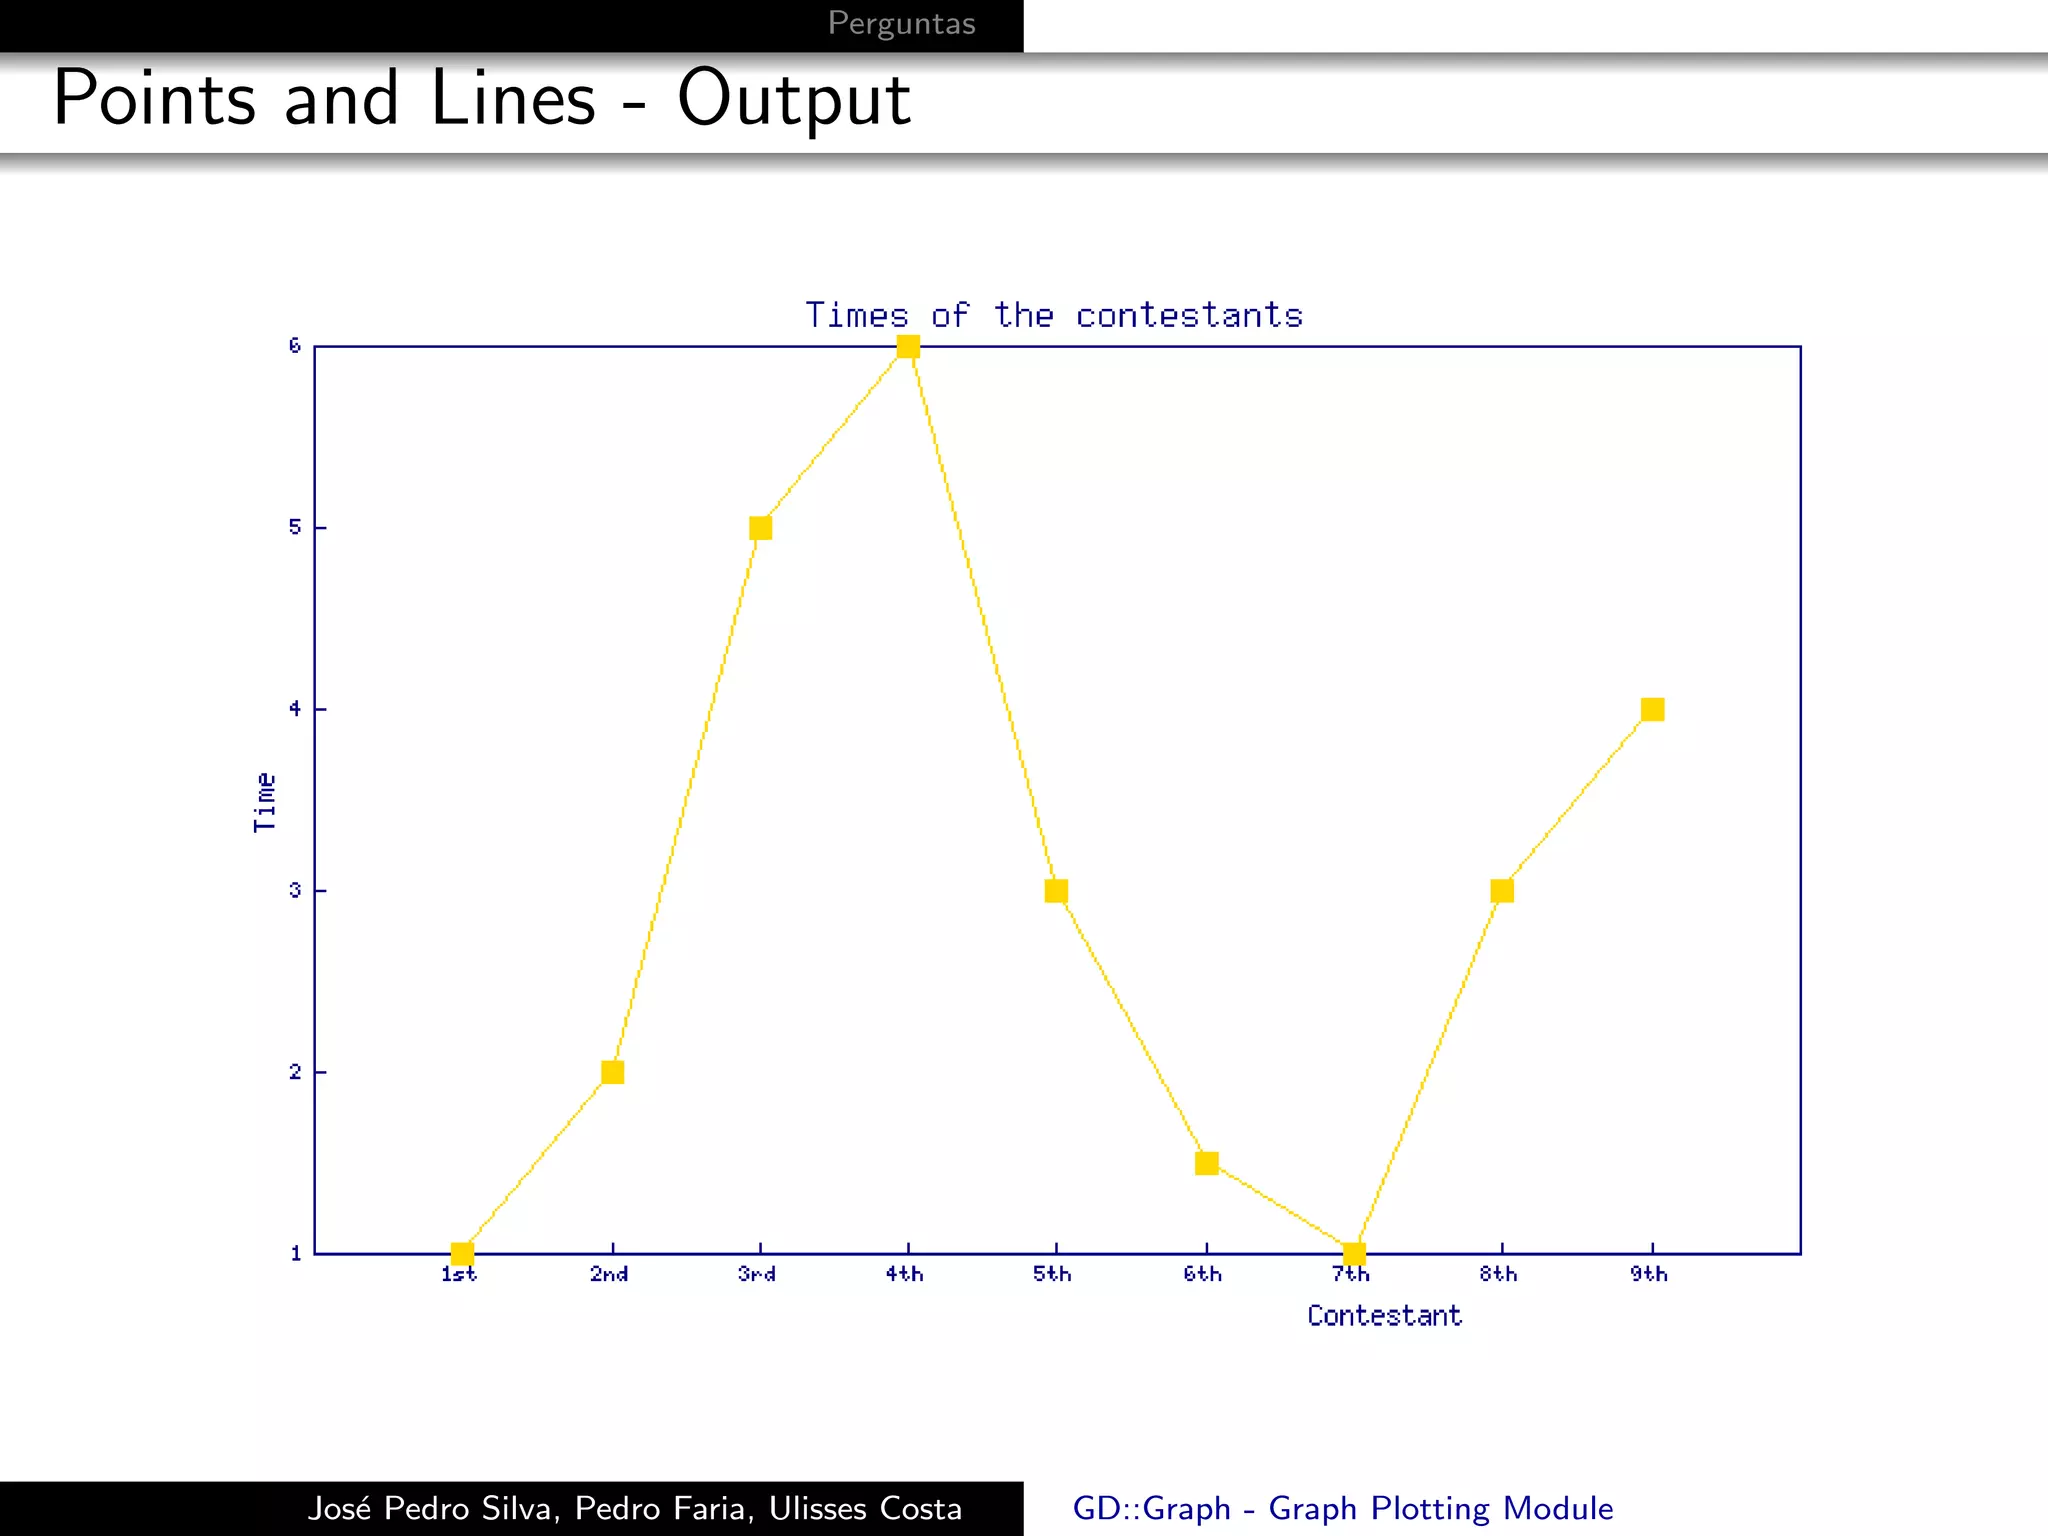
1 sub plotPng {
2 my $fileName = shift ;
3 @data = ( ["1 st " ,"2 nd " ,"3 rd " ,"4 th " ,"5 th " ,"6 th " ,"7 th " , "8 th " , "9 th "] ,
4 [ 1, 2, 5, 6, 3 , 1.5 , 1, 3, 4]
5 );
6 my $mygraph = GD :: Graph :: points - > new (600 , 400) ;
7
8 $mygraph - > set (
9 title = > " Times of the contestants " ,
10 dclrs = > [ qw ( gold red green ) ] ,
11 ) or warn $mygraph - > error ;
12
13 my $myimage = $mygraph - > linespoints ( @data ) or warn $mygraph - > error ;
14
15 open ( IMG , ’>’ , $fileName ) ;
16 binmode IMG ;
17 print IMG $myimage - > png ;
18 close ( IMG ) ;
19 }
Jos´ Pedro Silva, Pedro Faria, Ulisses Costa
e GD::Graph - Graph Plotting Module](https://image.slidesharecdn.com/pres-110122052647-phpapp01/75/GD-Graph-Graph-Plotting-Module-11-2048.jpg)
![Perguntas
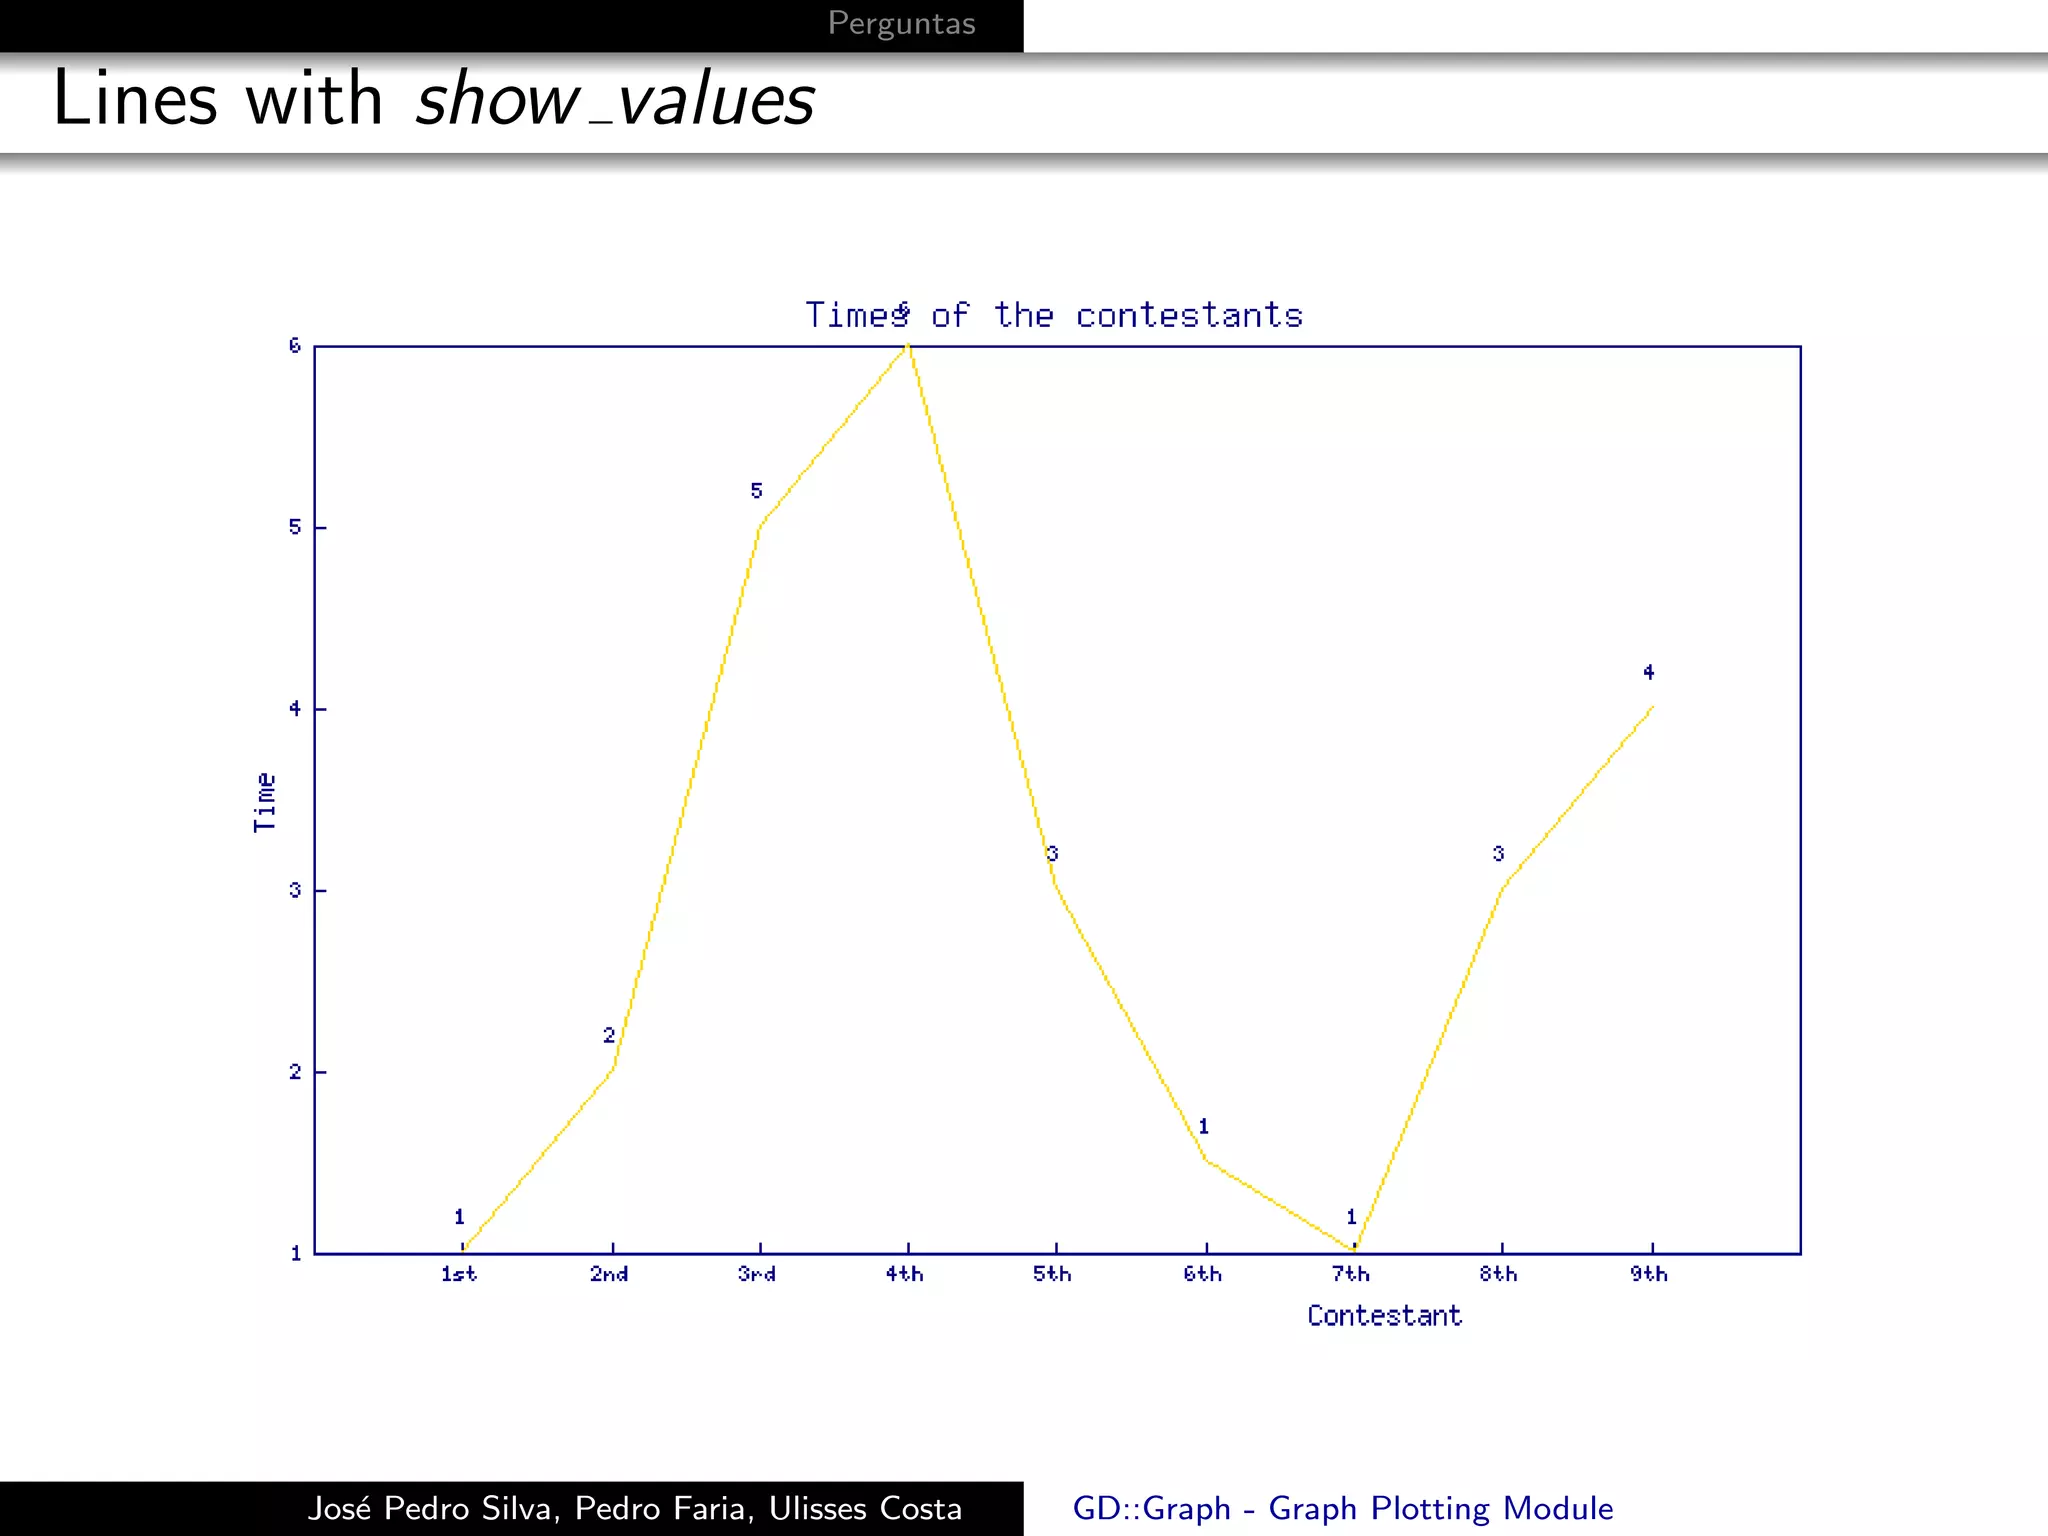
Lines with show values
1 $mygraph - > set (
2 x_label = > " Contestant " ,
3 y_label = > " Time " ,
4 values_format = > sub { return sprintf ("% d " , shift ) ; } ,
5 values_space = > 10 ,
6 show_values = > 1 ,
7 title = > " Times of the contestants " ,
8 dclrs = > [ qw ( gold red green ) ]
9 ) or warn $mygraph - > error ;
Jos´ Pedro Silva, Pedro Faria, Ulisses Costa
e GD::Graph - Graph Plotting Module](https://image.slidesharecdn.com/pres-110122052647-phpapp01/75/GD-Graph-Graph-Plotting-Module-18-2048.jpg)
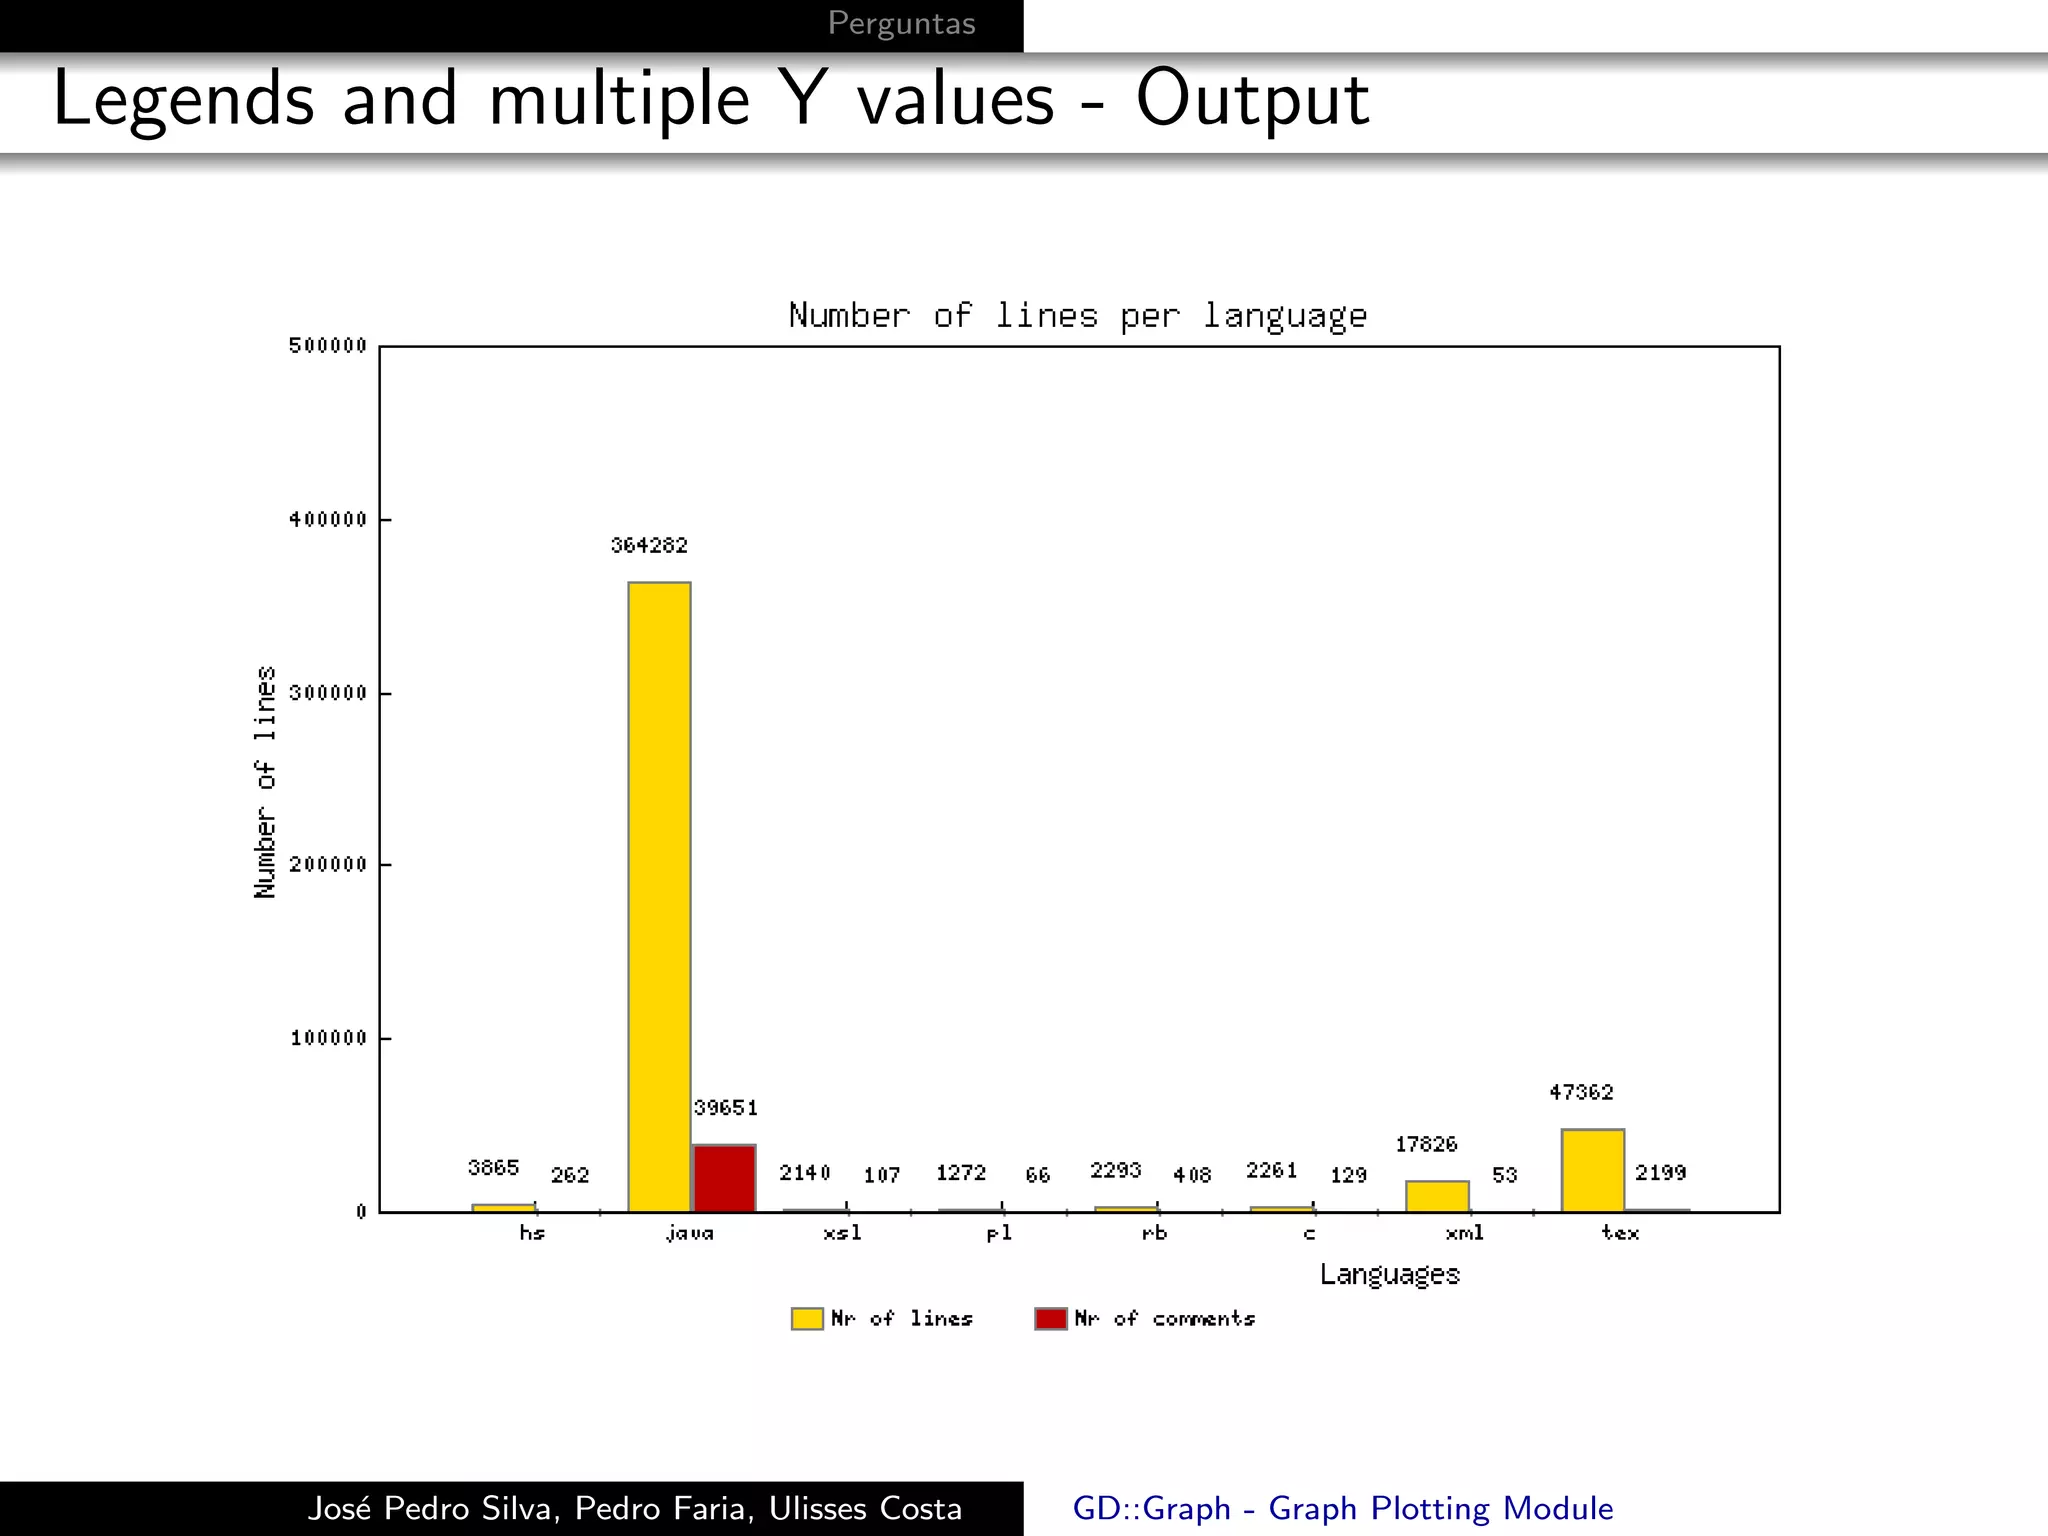
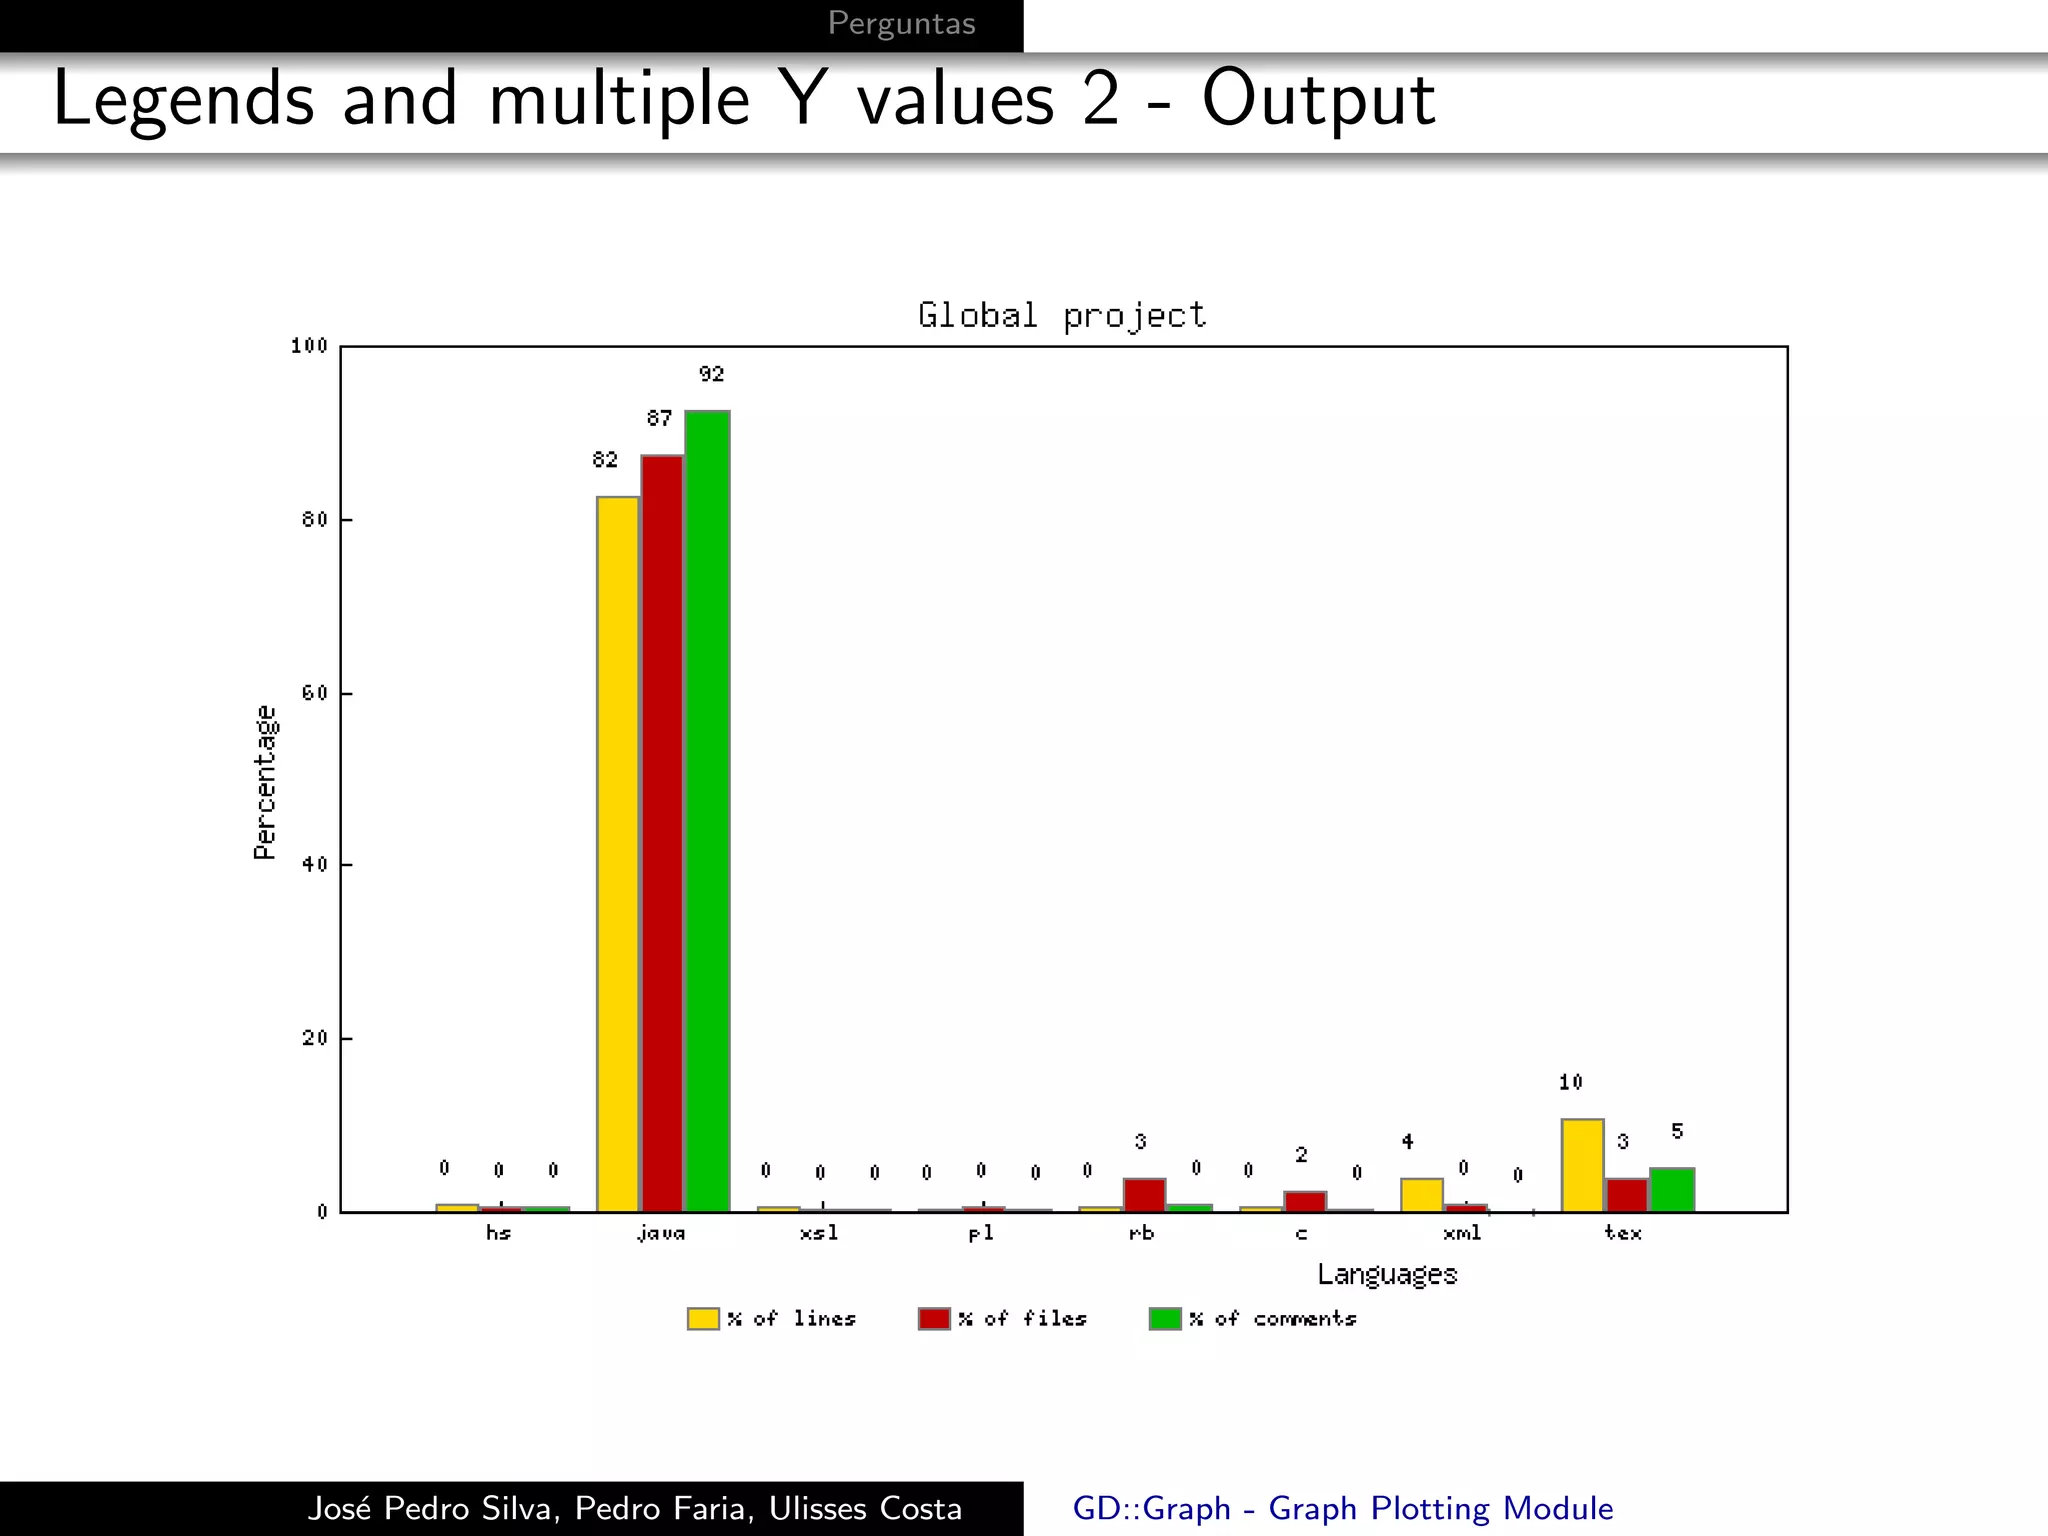
![Perguntas
Legends and multiple Y values
1 my @legend_keys = (" Nr of lines " ," Nr of comments ") ;
2 $mygraph - > set_legend ( @legend_keys ) ;
3 $mygraph - > set (
4 transparent => 1,
5 overwrite = > 0 ,
6 fgclr = > black ,
7 labelclr = > black ,
8 axislabelclr = > black ,
9 legendclr = > black ,
10 valuesclr = > black ,
11 textclr = > black ,
12 transparent => 1,
13 overwrite = > 0 ,
14 b argroup_spacing = > 10 ,
15 show_values => 1,
16 values_format = > sub { return sprintf ("% d " , shift ) ; } ,
17 values_space = > 10 ,
18 x_label = > $x_label ,
19 y_label = > $y_label ,
20 title = > $title ,
21 dclrs = > [ qw ( gold red green ) ] ,
22 ) or warn $mygraph - > error ;
Jos´ Pedro Silva, Pedro Faria, Ulisses Costa
e GD::Graph - Graph Plotting Module](https://image.slidesharecdn.com/pres-110122052647-phpapp01/75/GD-Graph-Graph-Plotting-Module-20-2048.jpg)
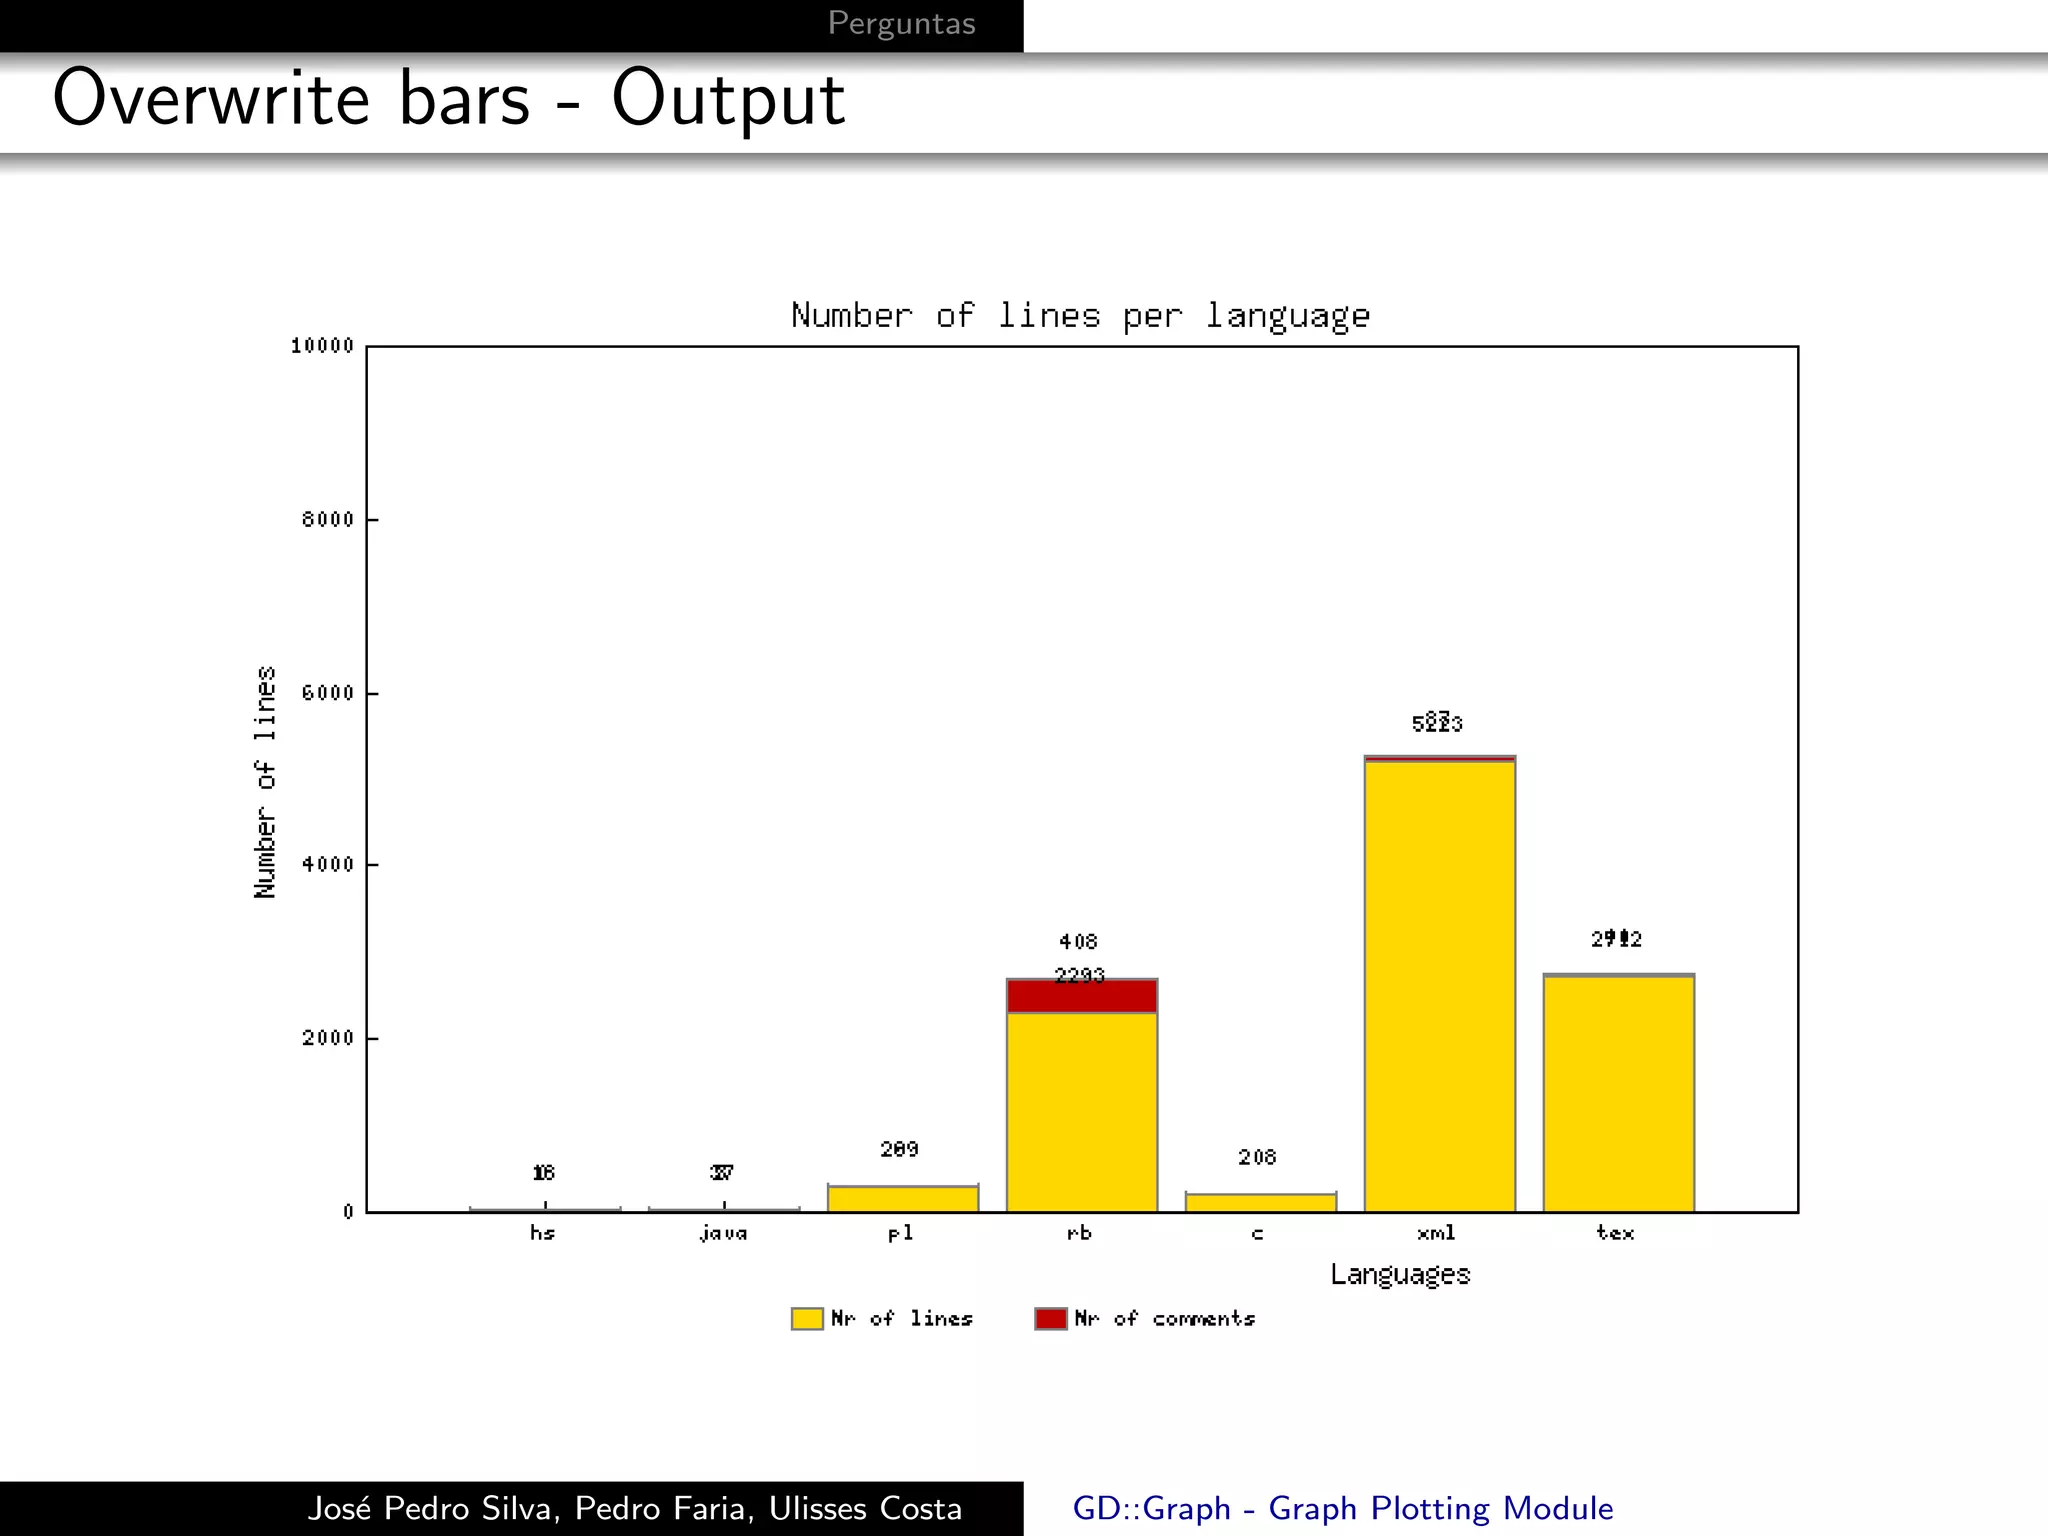
![Perguntas
Overwrite bars
1 my @legend_keys = (" Nr of lines " ," Nr of comments ") ;
2 $mygraph - > set_legend ( @legend_keys ) ;
3 $mygraph - > set (
4 transparent => 1,
5 overwrite = > 2 ,
6 fgclr = > black ,
7 labelclr = > black ,
8 axislabelclr = > black ,
9 legendclr = > black ,
10 valuesclr = > black ,
11 textclr = > black ,
12 transparent => 1,
13 overwrite = > 0 ,
14 b argroup_spacing = > 10 ,
15 show_values => 1,
16 values_format = > sub { return sprintf ("% d " , shift ) ; } ,
17 values_space = > 10 ,
18 x_label = > $x_label ,
19 y_label = > $y_label ,
20 title = > $title ,
21 dclrs = > [ qw ( gold red green ) ] ,
22 ) or warn $mygraph - > error ;
Jos´ Pedro Silva, Pedro Faria, Ulisses Costa
e GD::Graph - Graph Plotting Module](https://image.slidesharecdn.com/pres-110122052647-phpapp01/75/GD-Graph-Graph-Plotting-Module-23-2048.jpg)

The document discusses the GD::Graph module for Perl, which can be used to create various types of graphs and charts from data. It defines classes for line charts, bar charts, combination line/point charts, area charts, pie charts, and provides examples of how to generate and export these different chart types to PNG files. It also summarizes common configuration methods that can be used across the different graph classes.


![Coded Agents – with UiPath SDK + LangGraph [Virtual Hands-on Workshop]](https://cdn.slidesharecdn.com/ss_thumbnails/codedagentsdeck-251215155422-5497c599-thumbnail.jpg?width=640&height=640&fit=bounds)


