Download to read offline

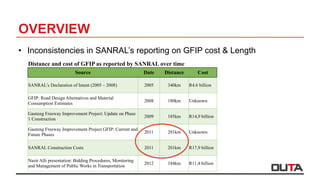
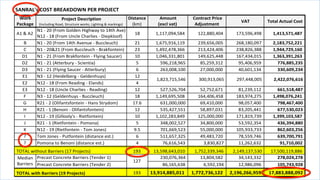
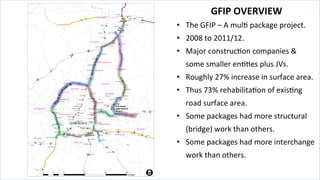
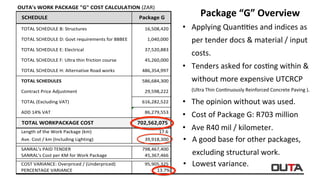
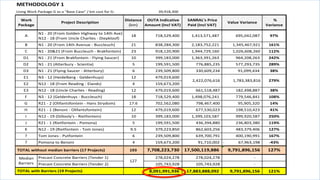
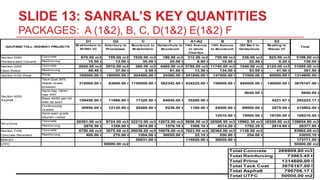

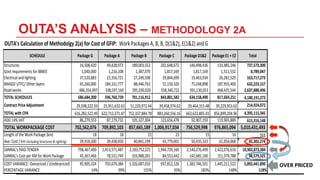
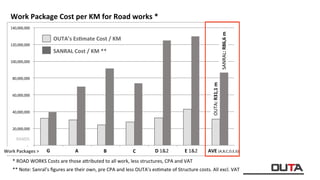
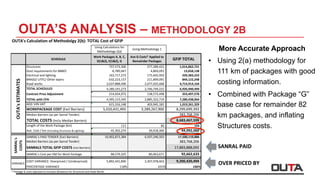
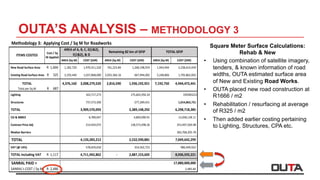
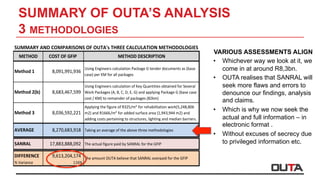
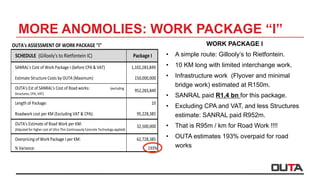
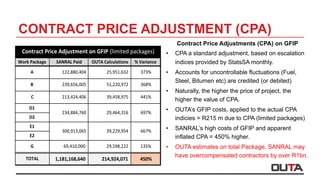
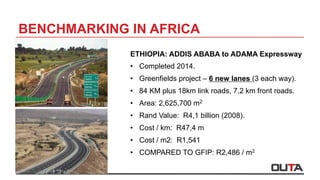

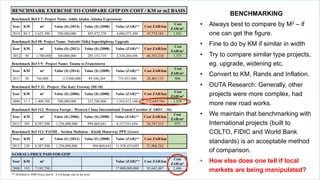


This document discusses SANRAL's high costs for road construction projects in South Africa, specifically the Gauteng Freeway Improvement Project (GFIP). It analyzes the costs for each work package of the GFIP and finds that SANRAL overpaid by as much as R10 billion total. Work Package G is used as a case study, and OUTA's calculations based on the tender documents show this package was overpriced by 13.7%, or R95.9 million. The document raises concerns about lack of transparency and accountability in SANRAL's project costs.


