Downloaded 476 times


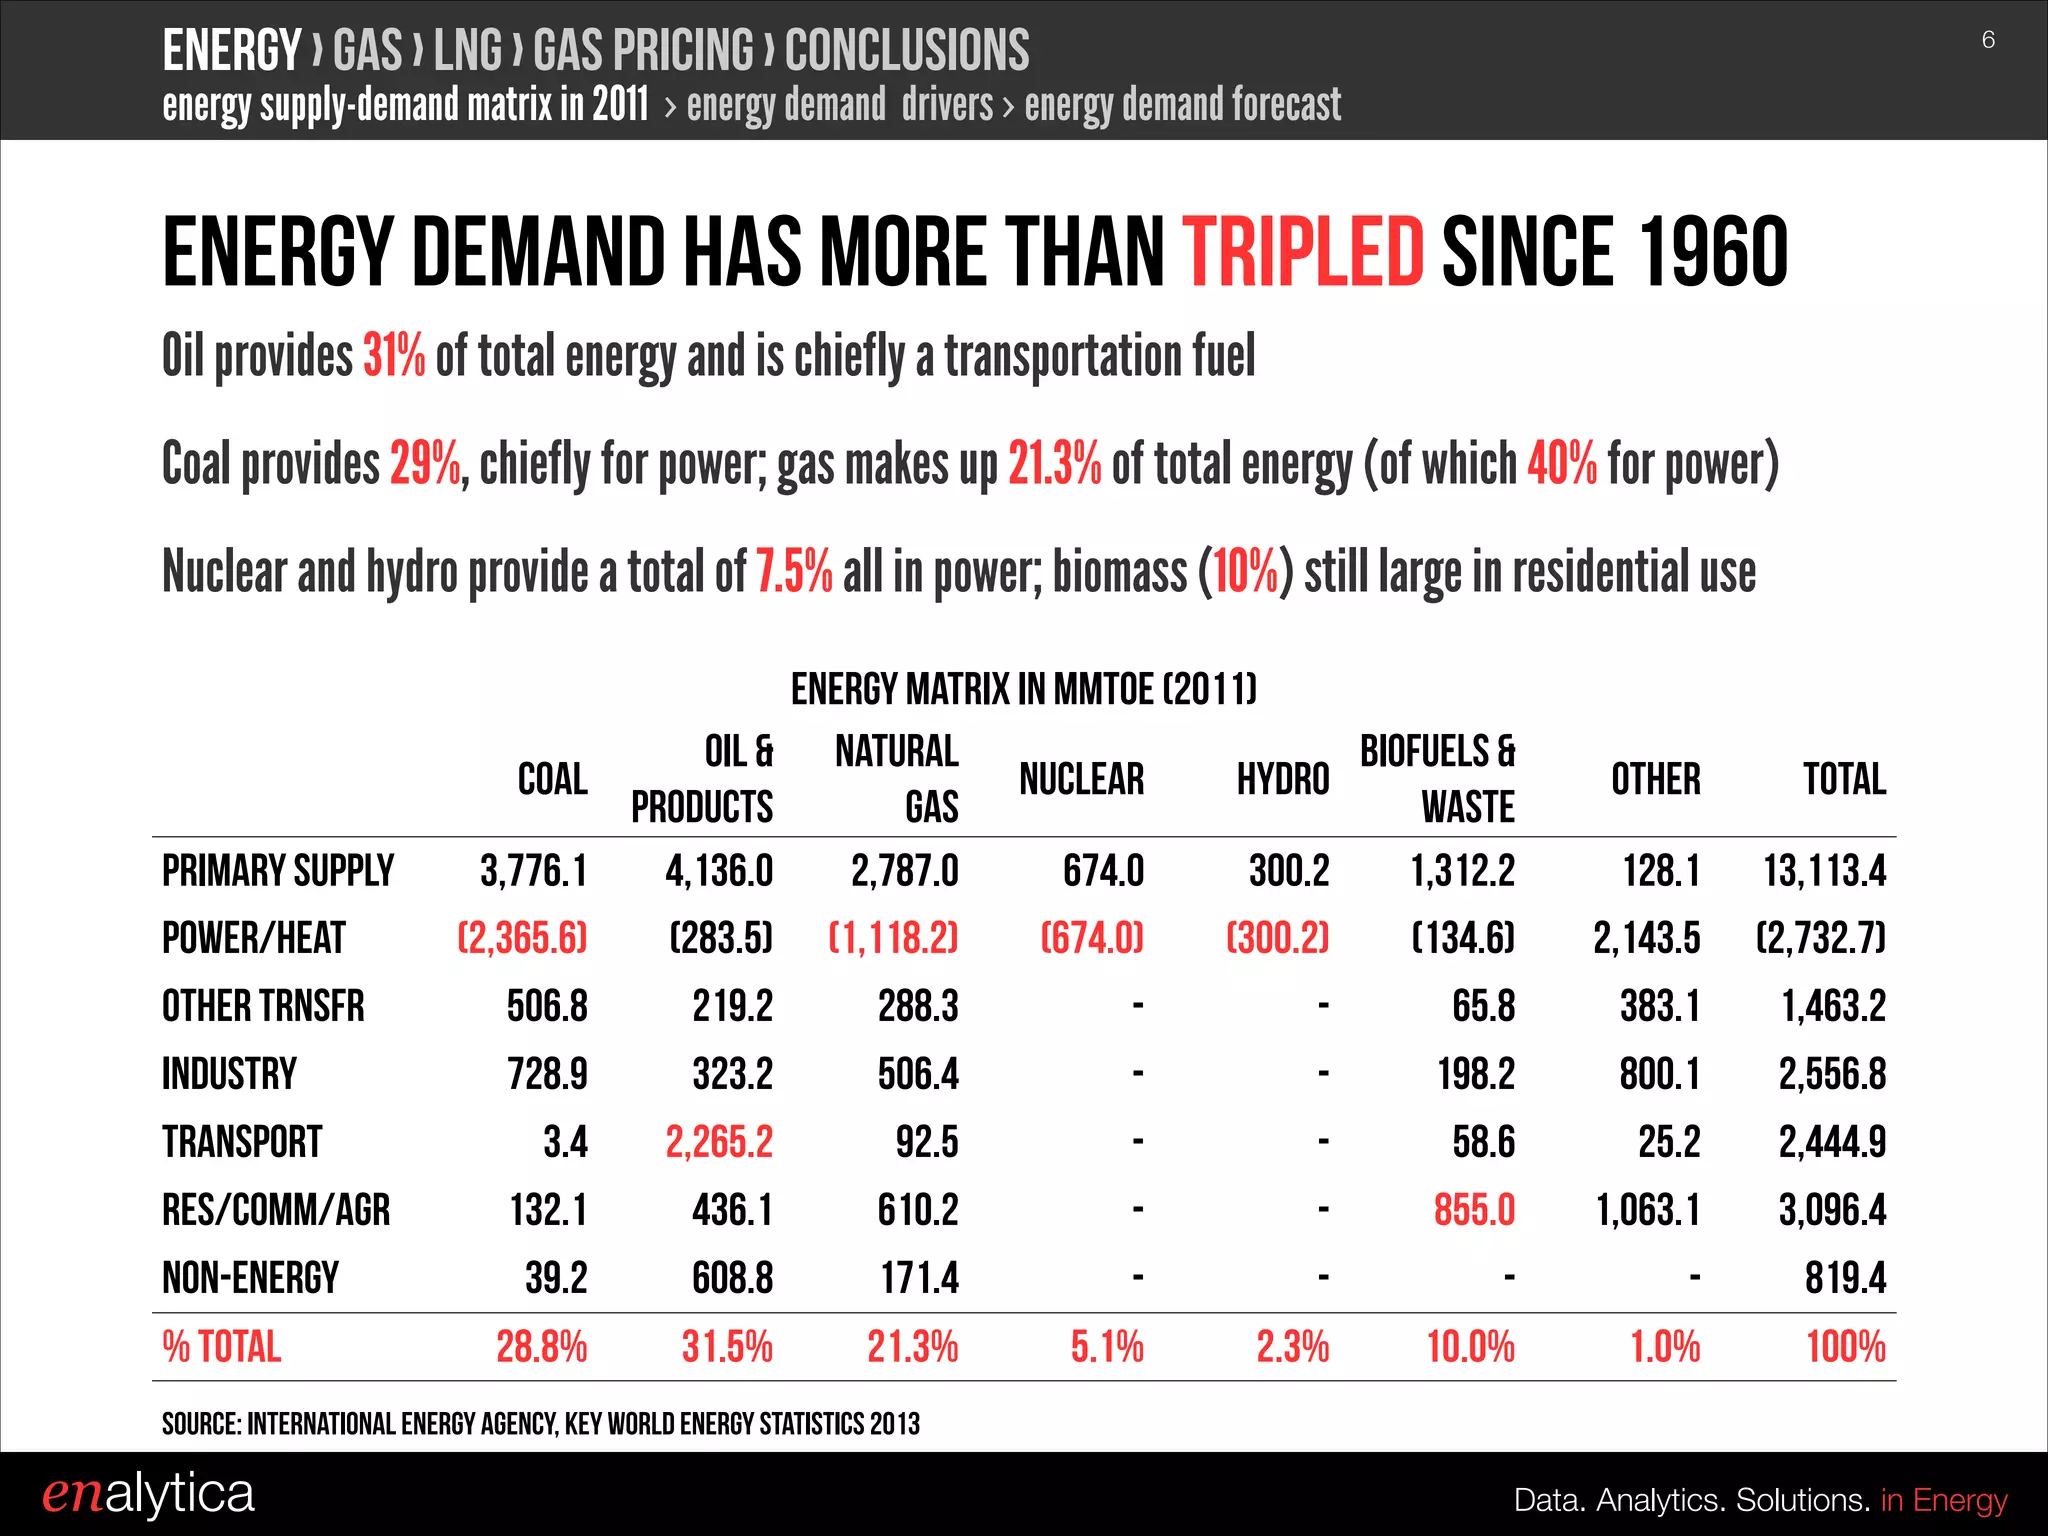

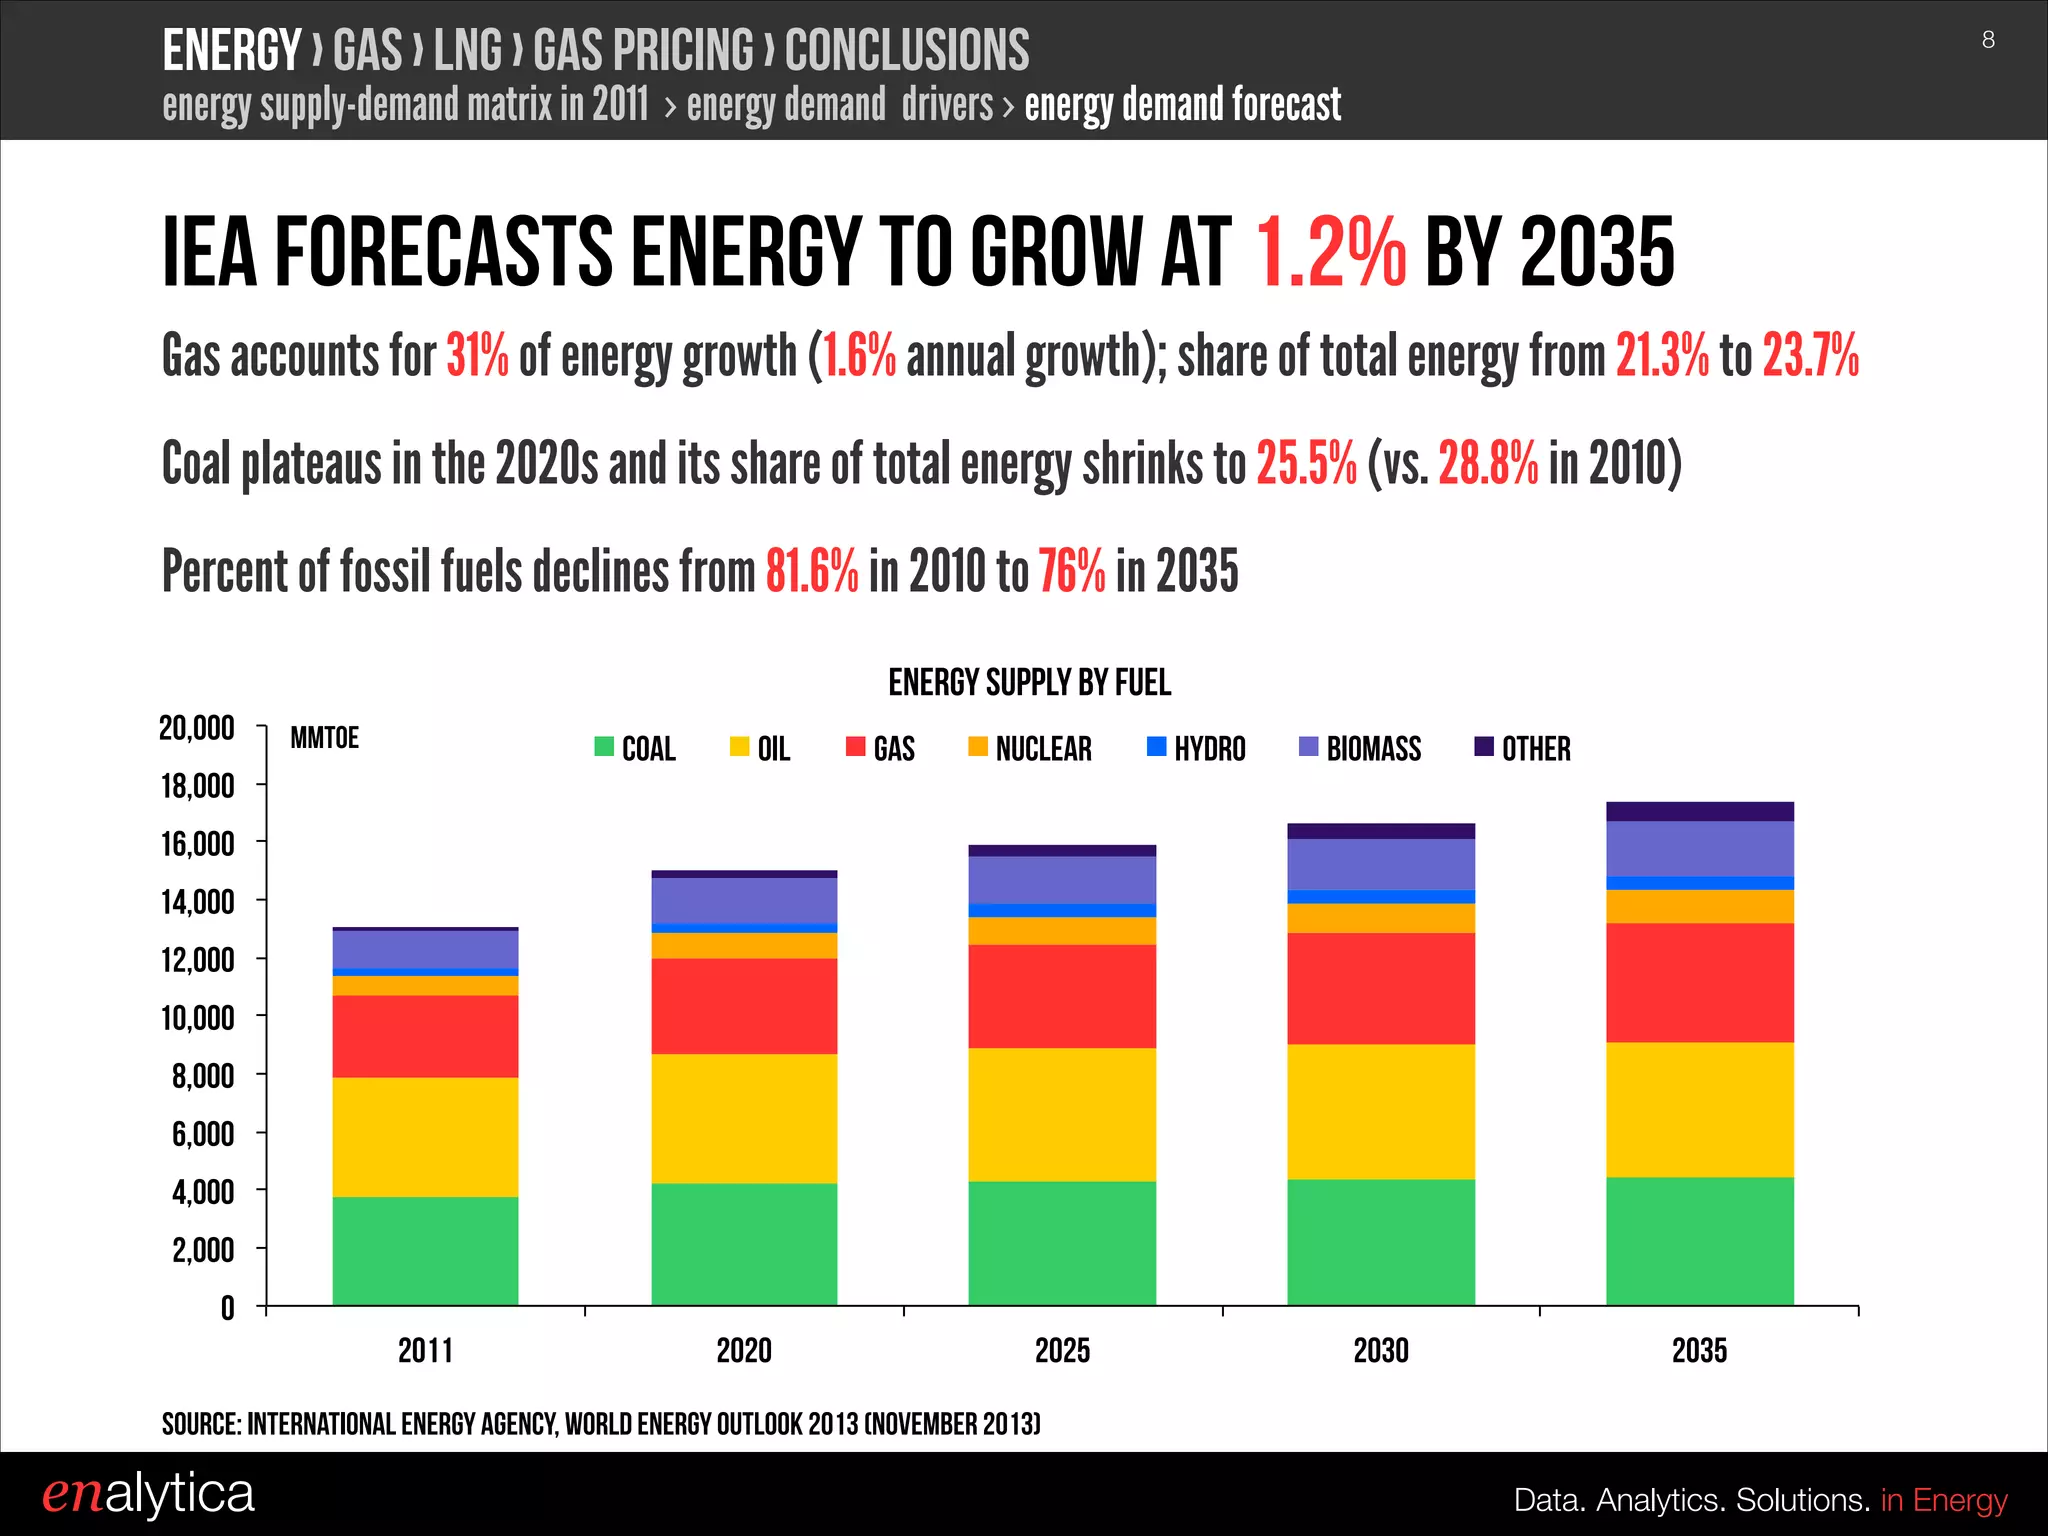

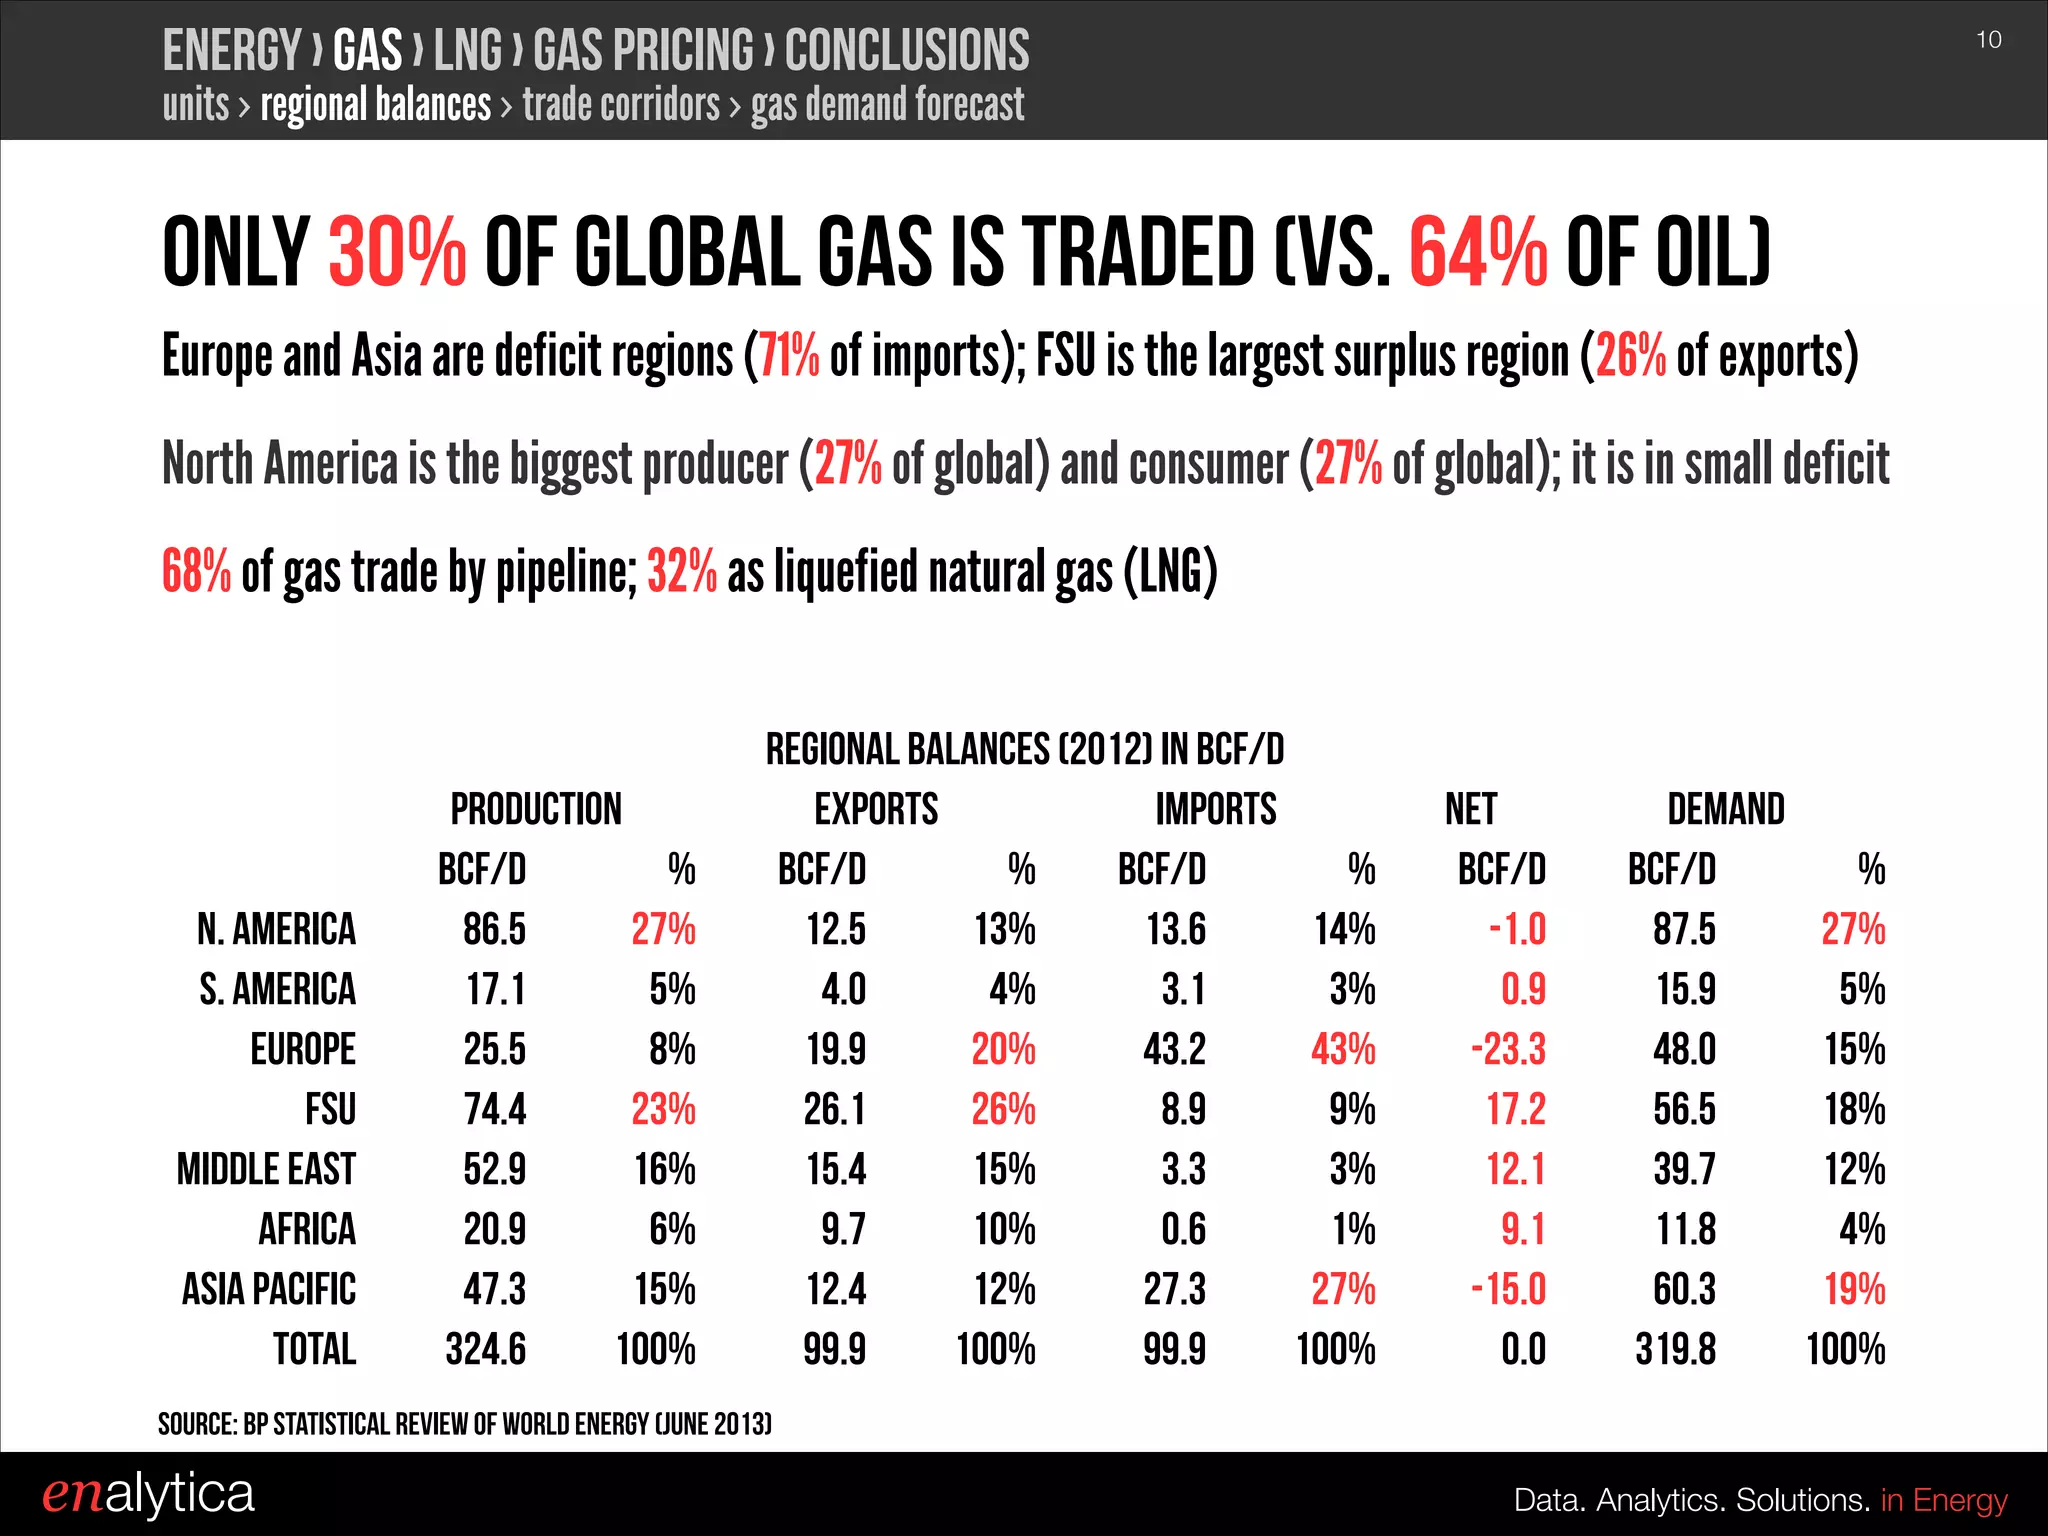
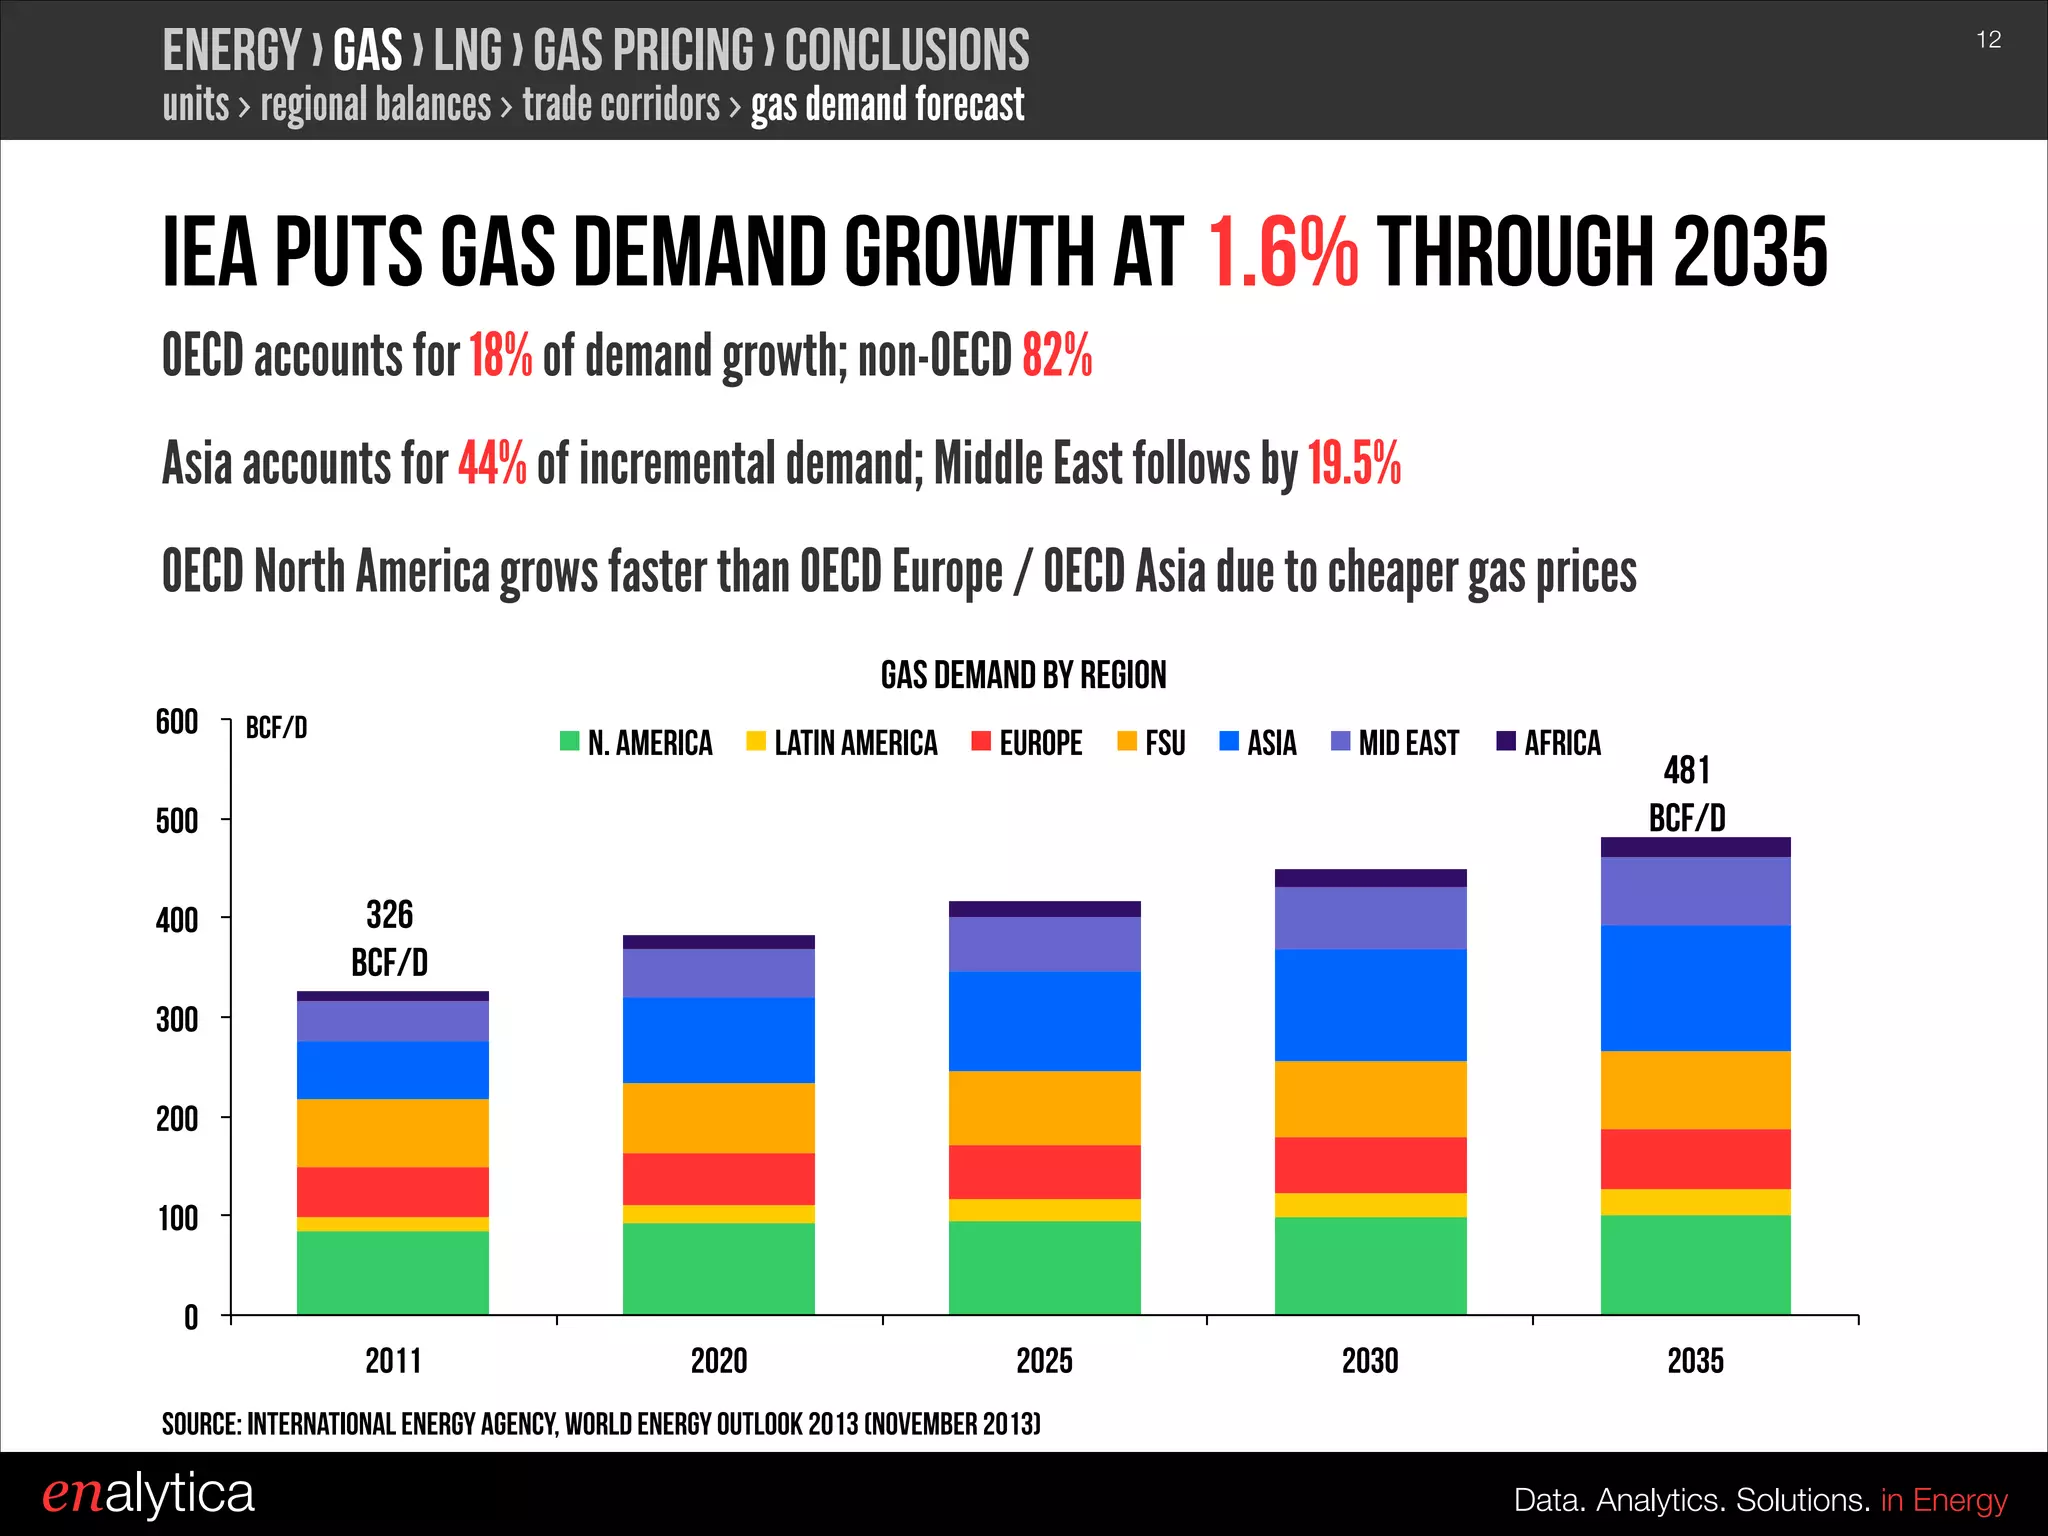
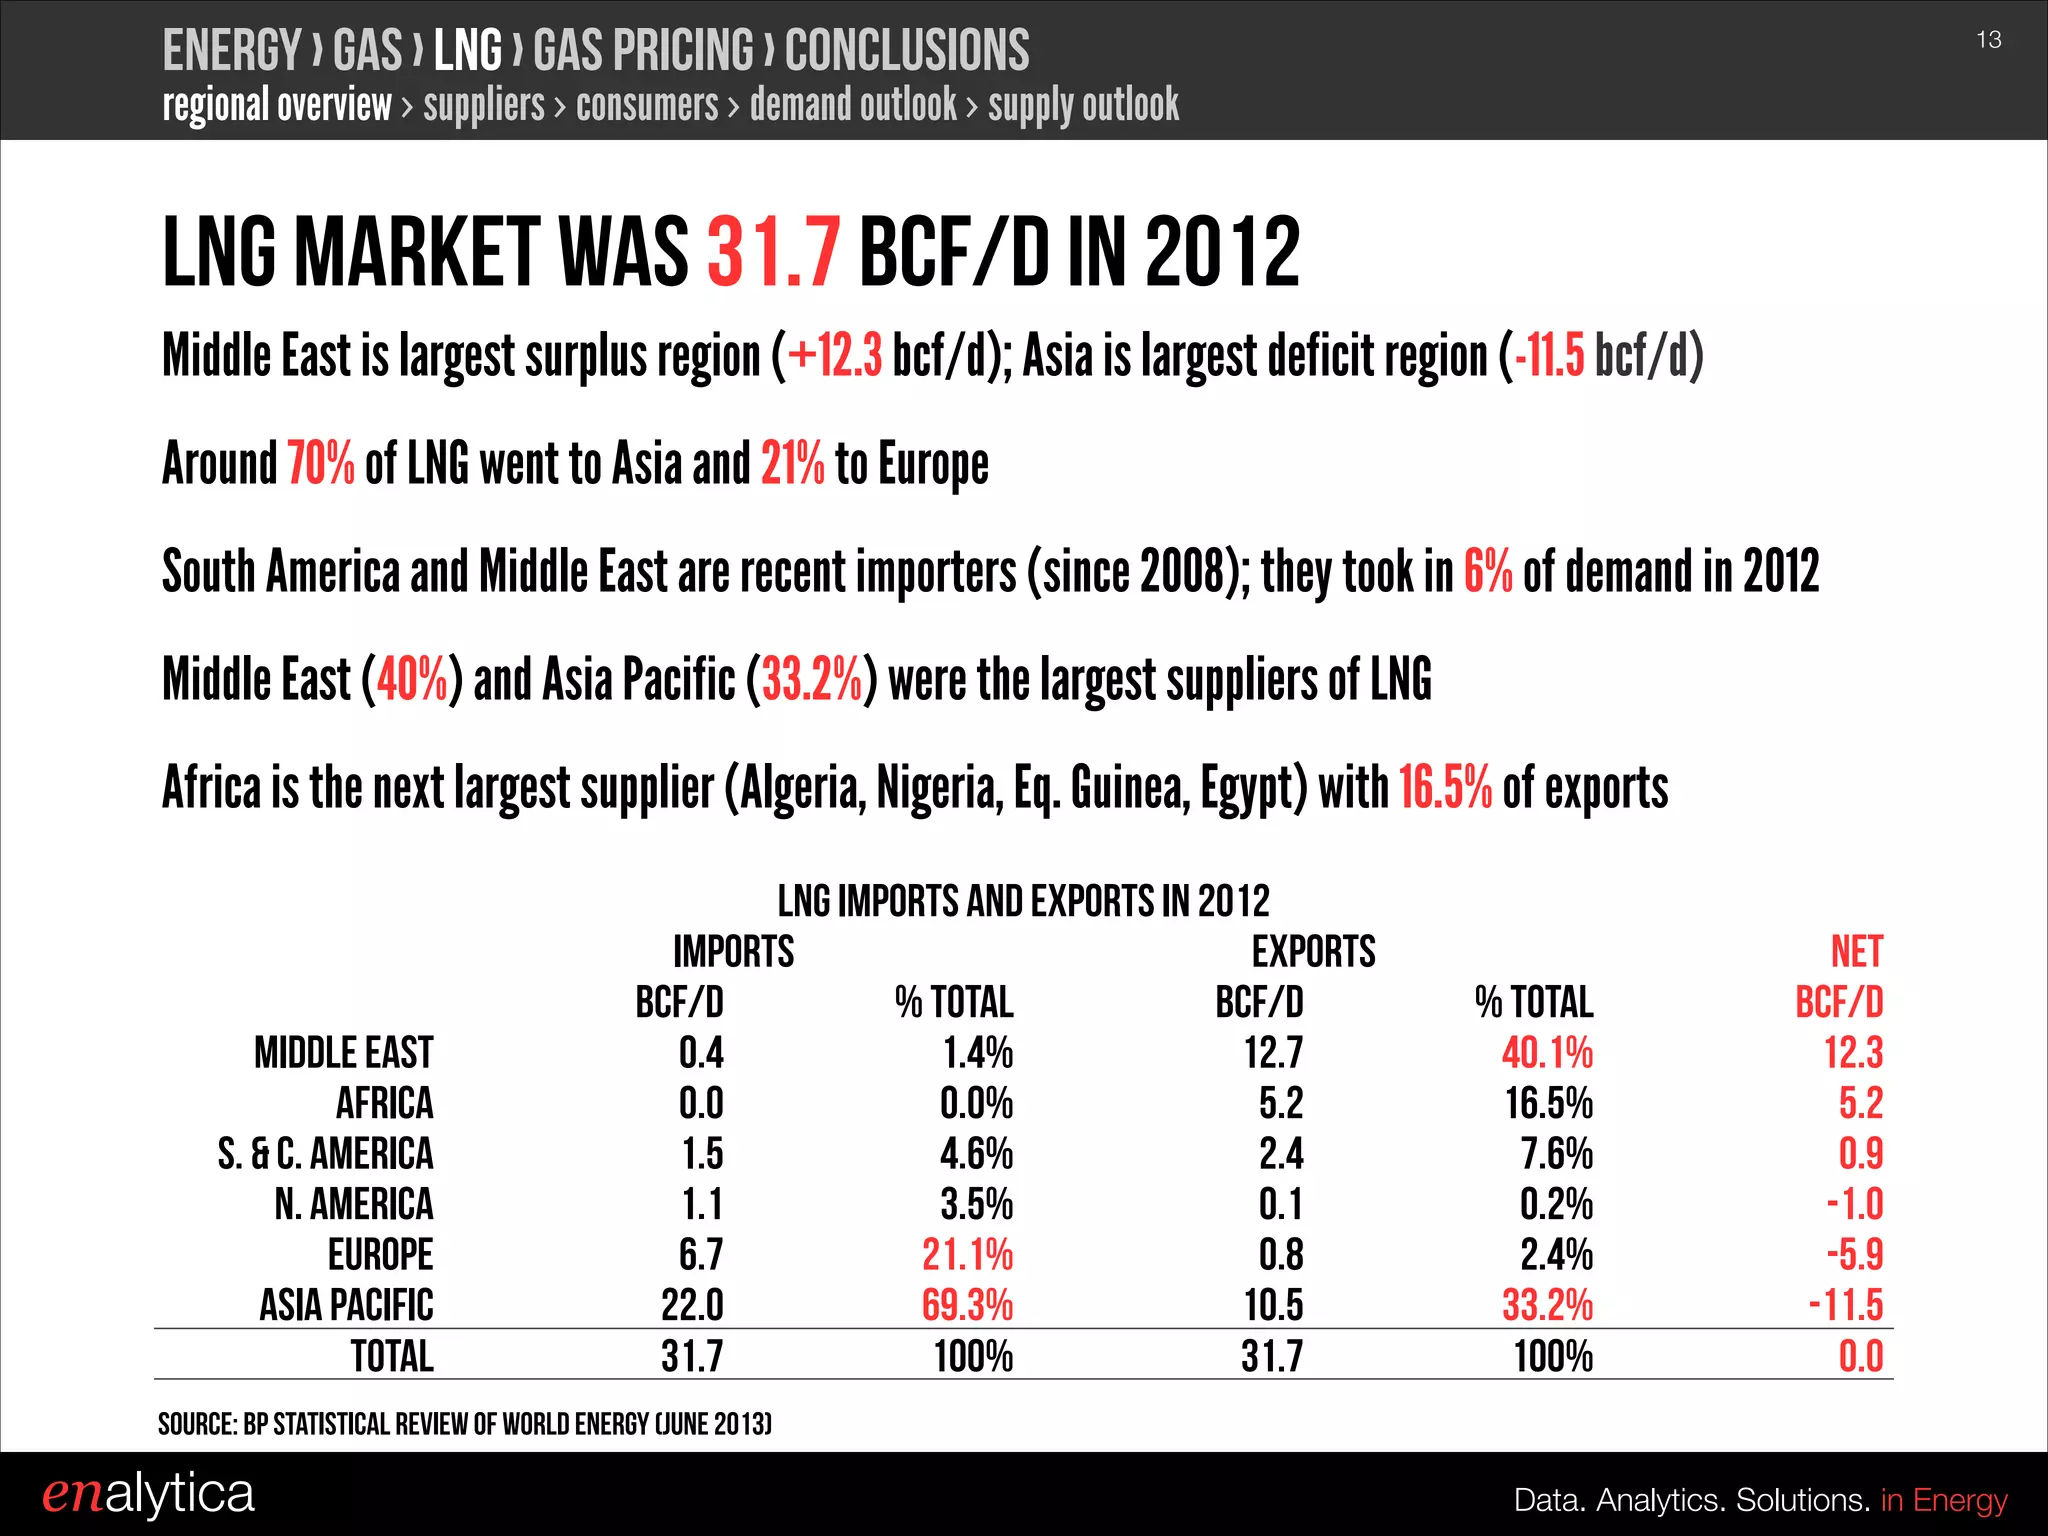


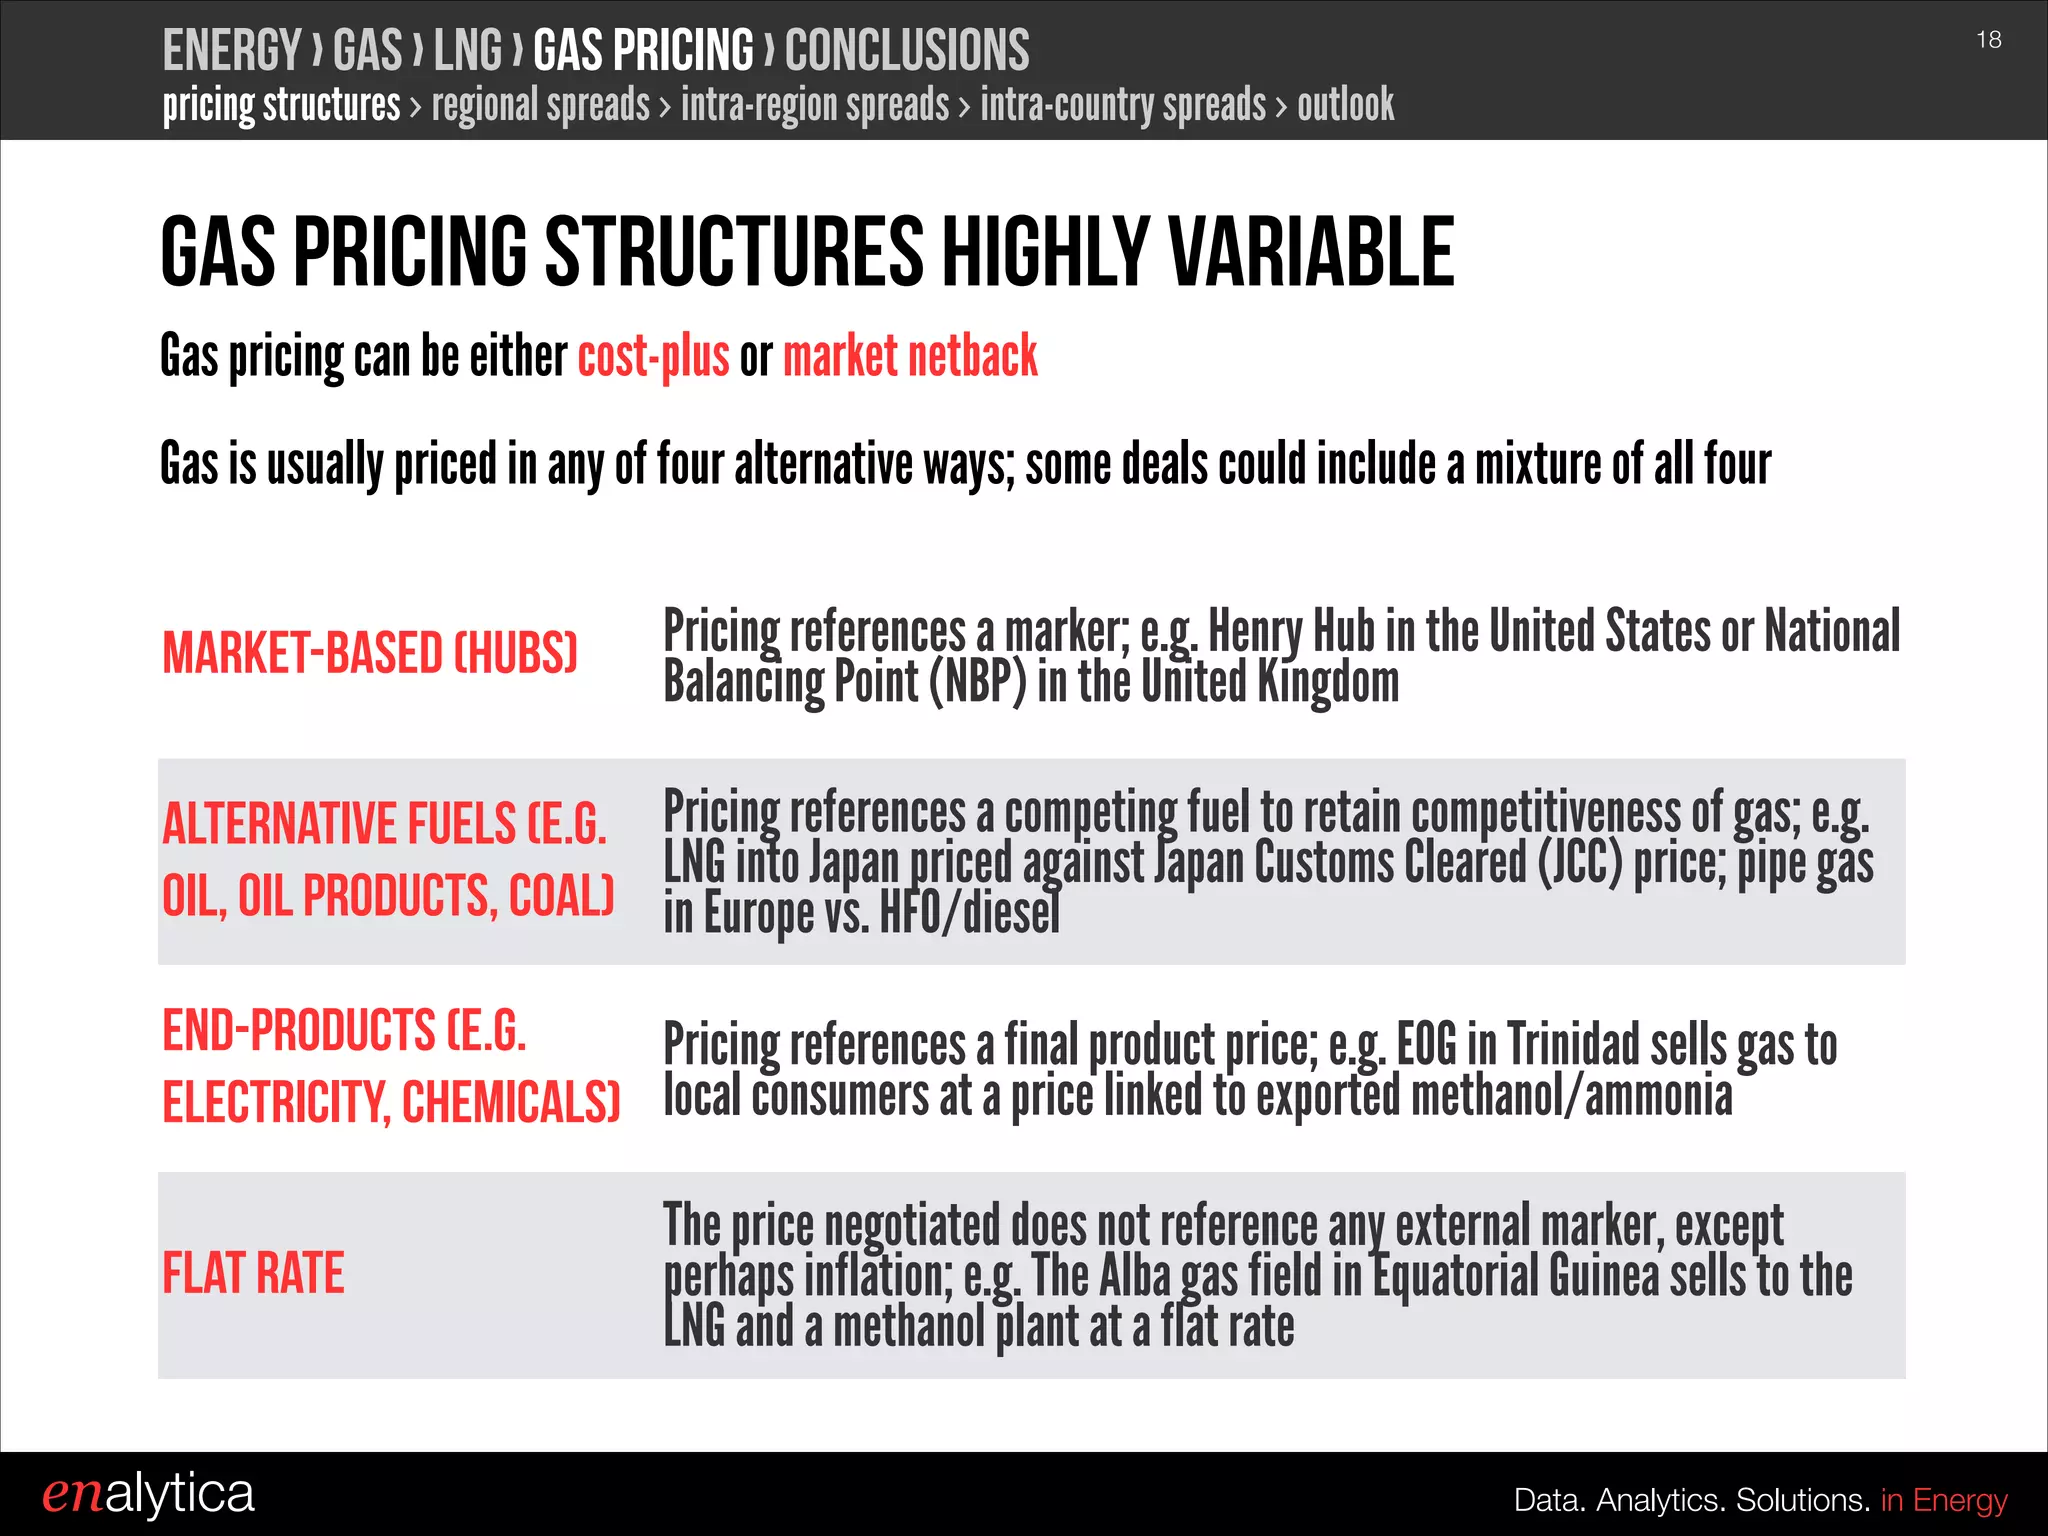


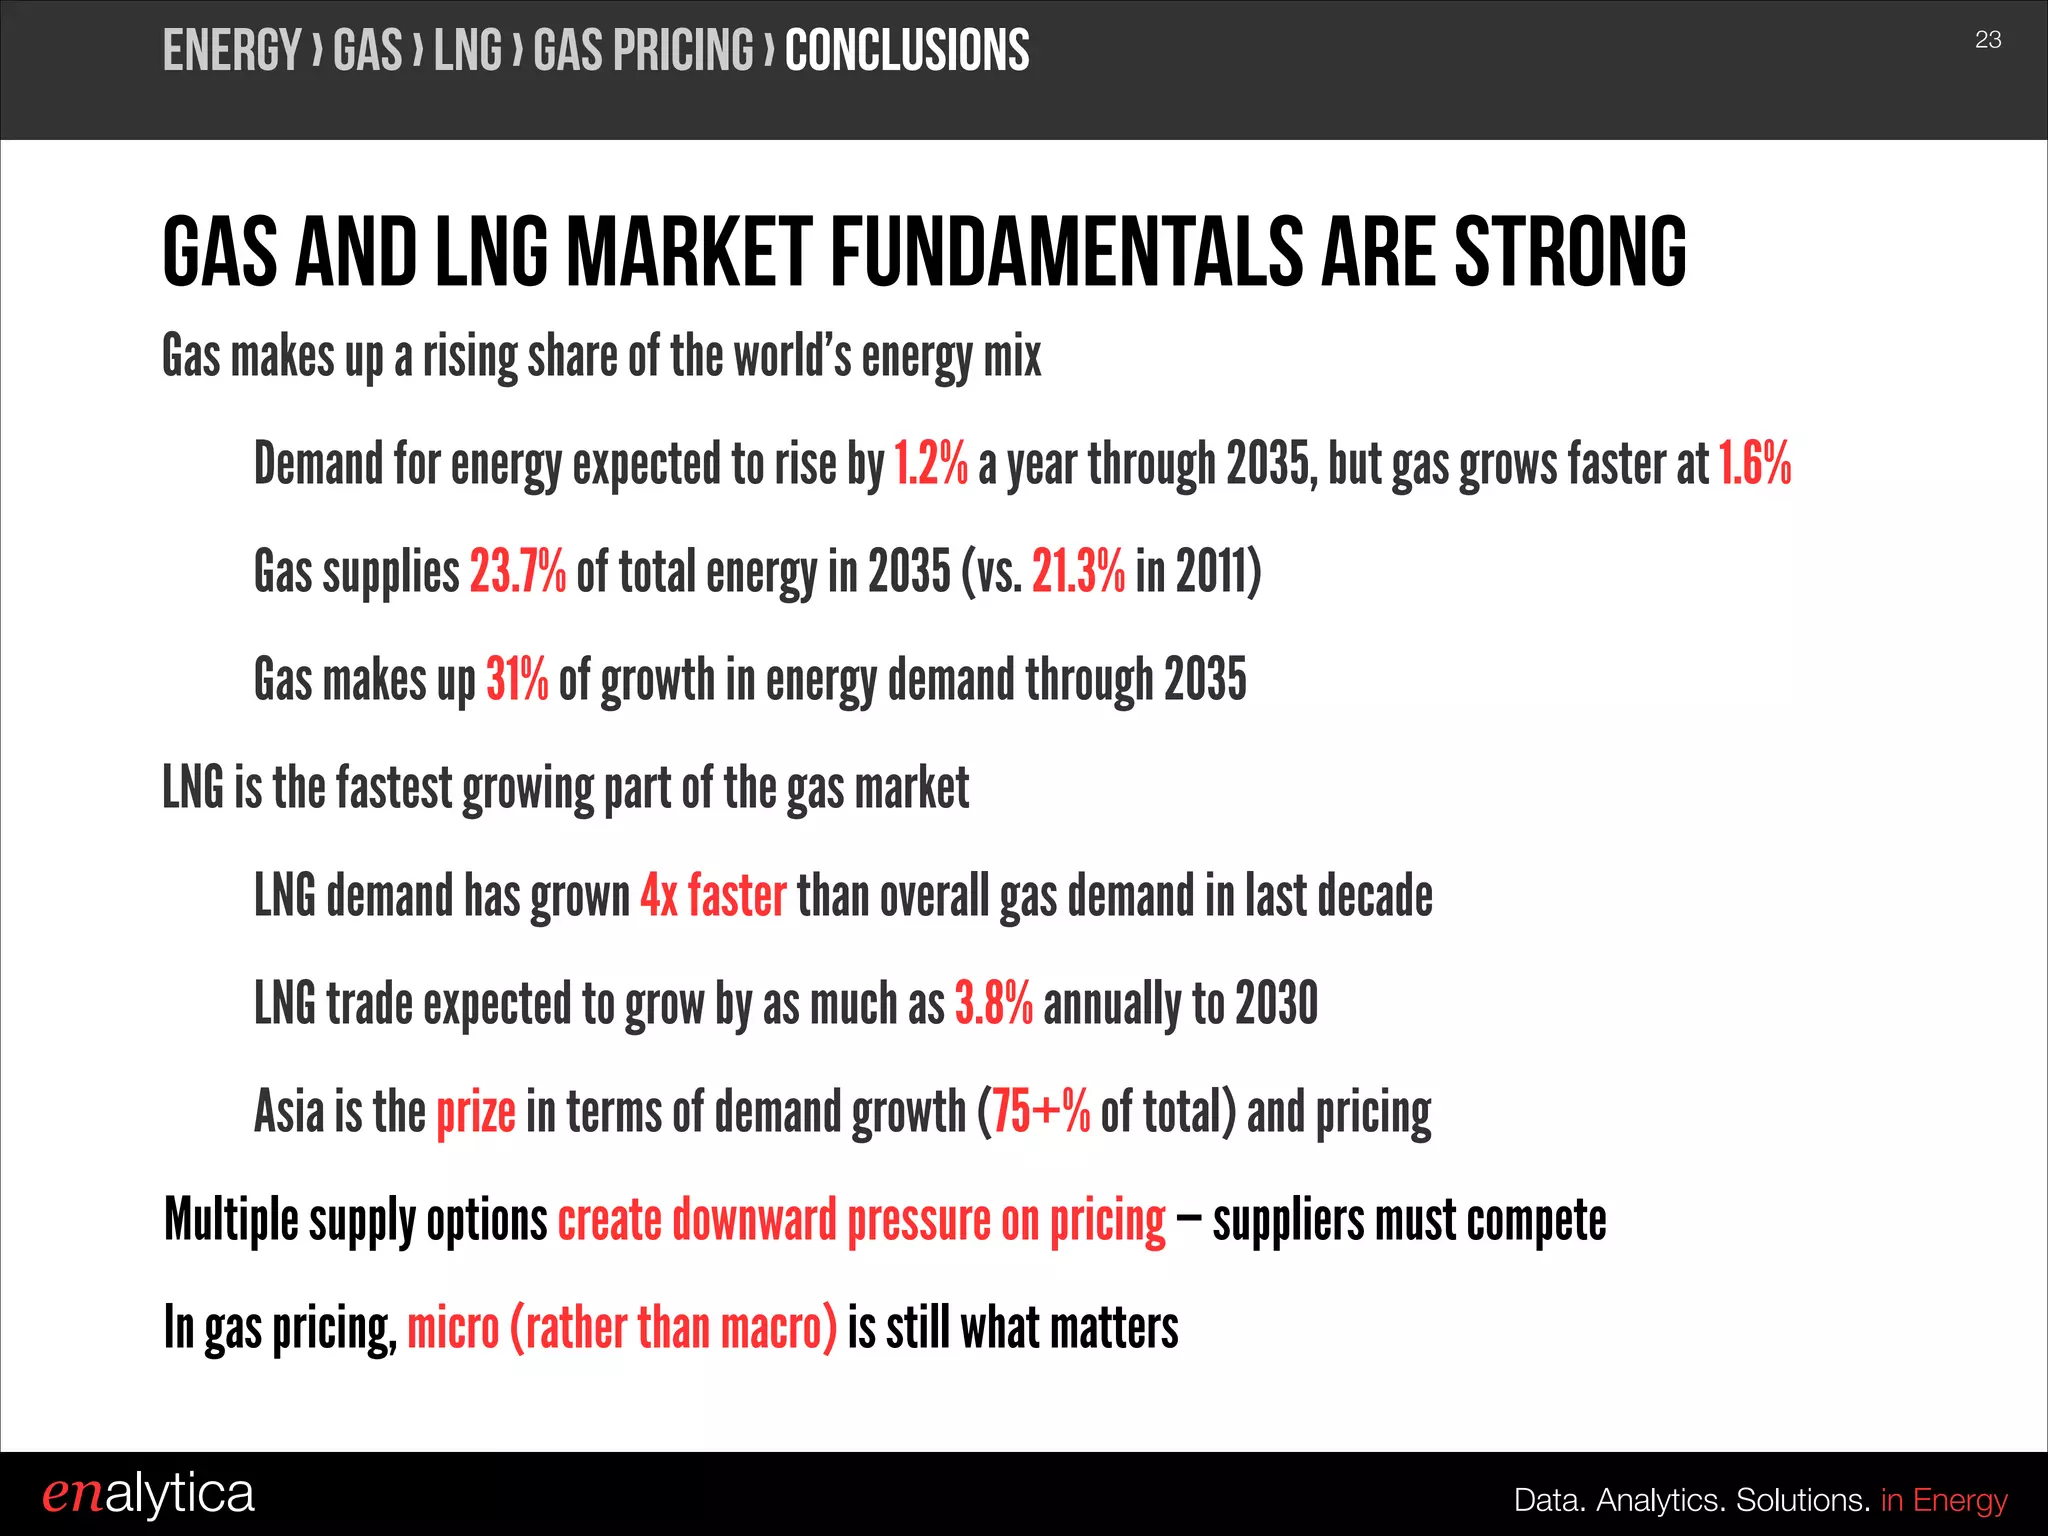


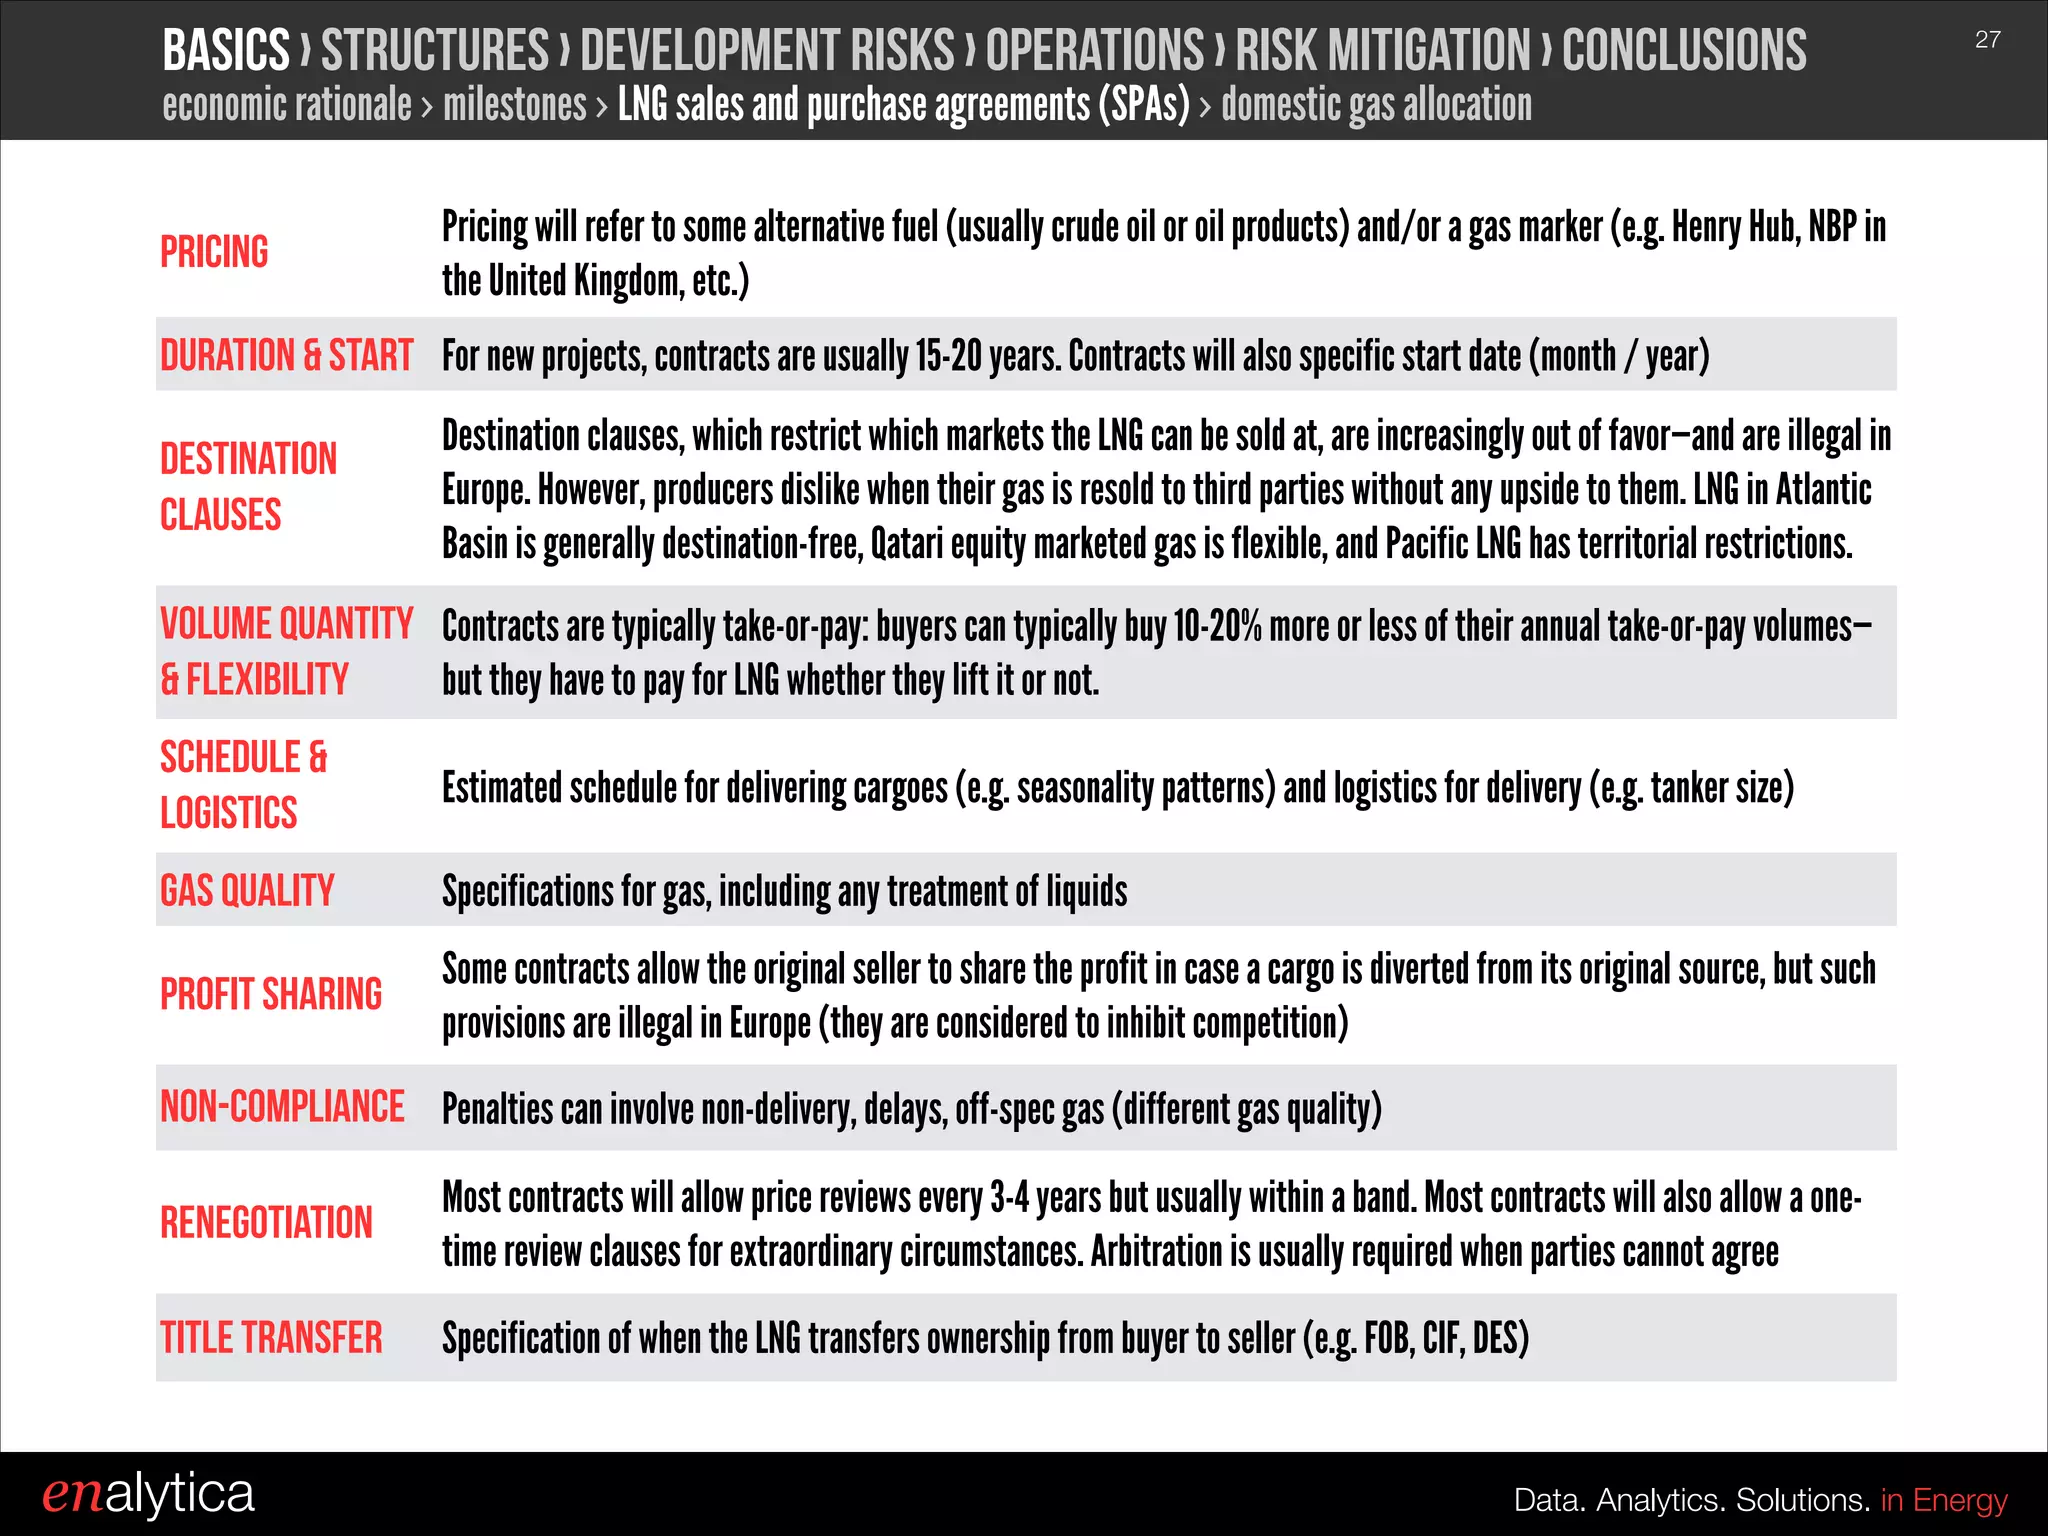

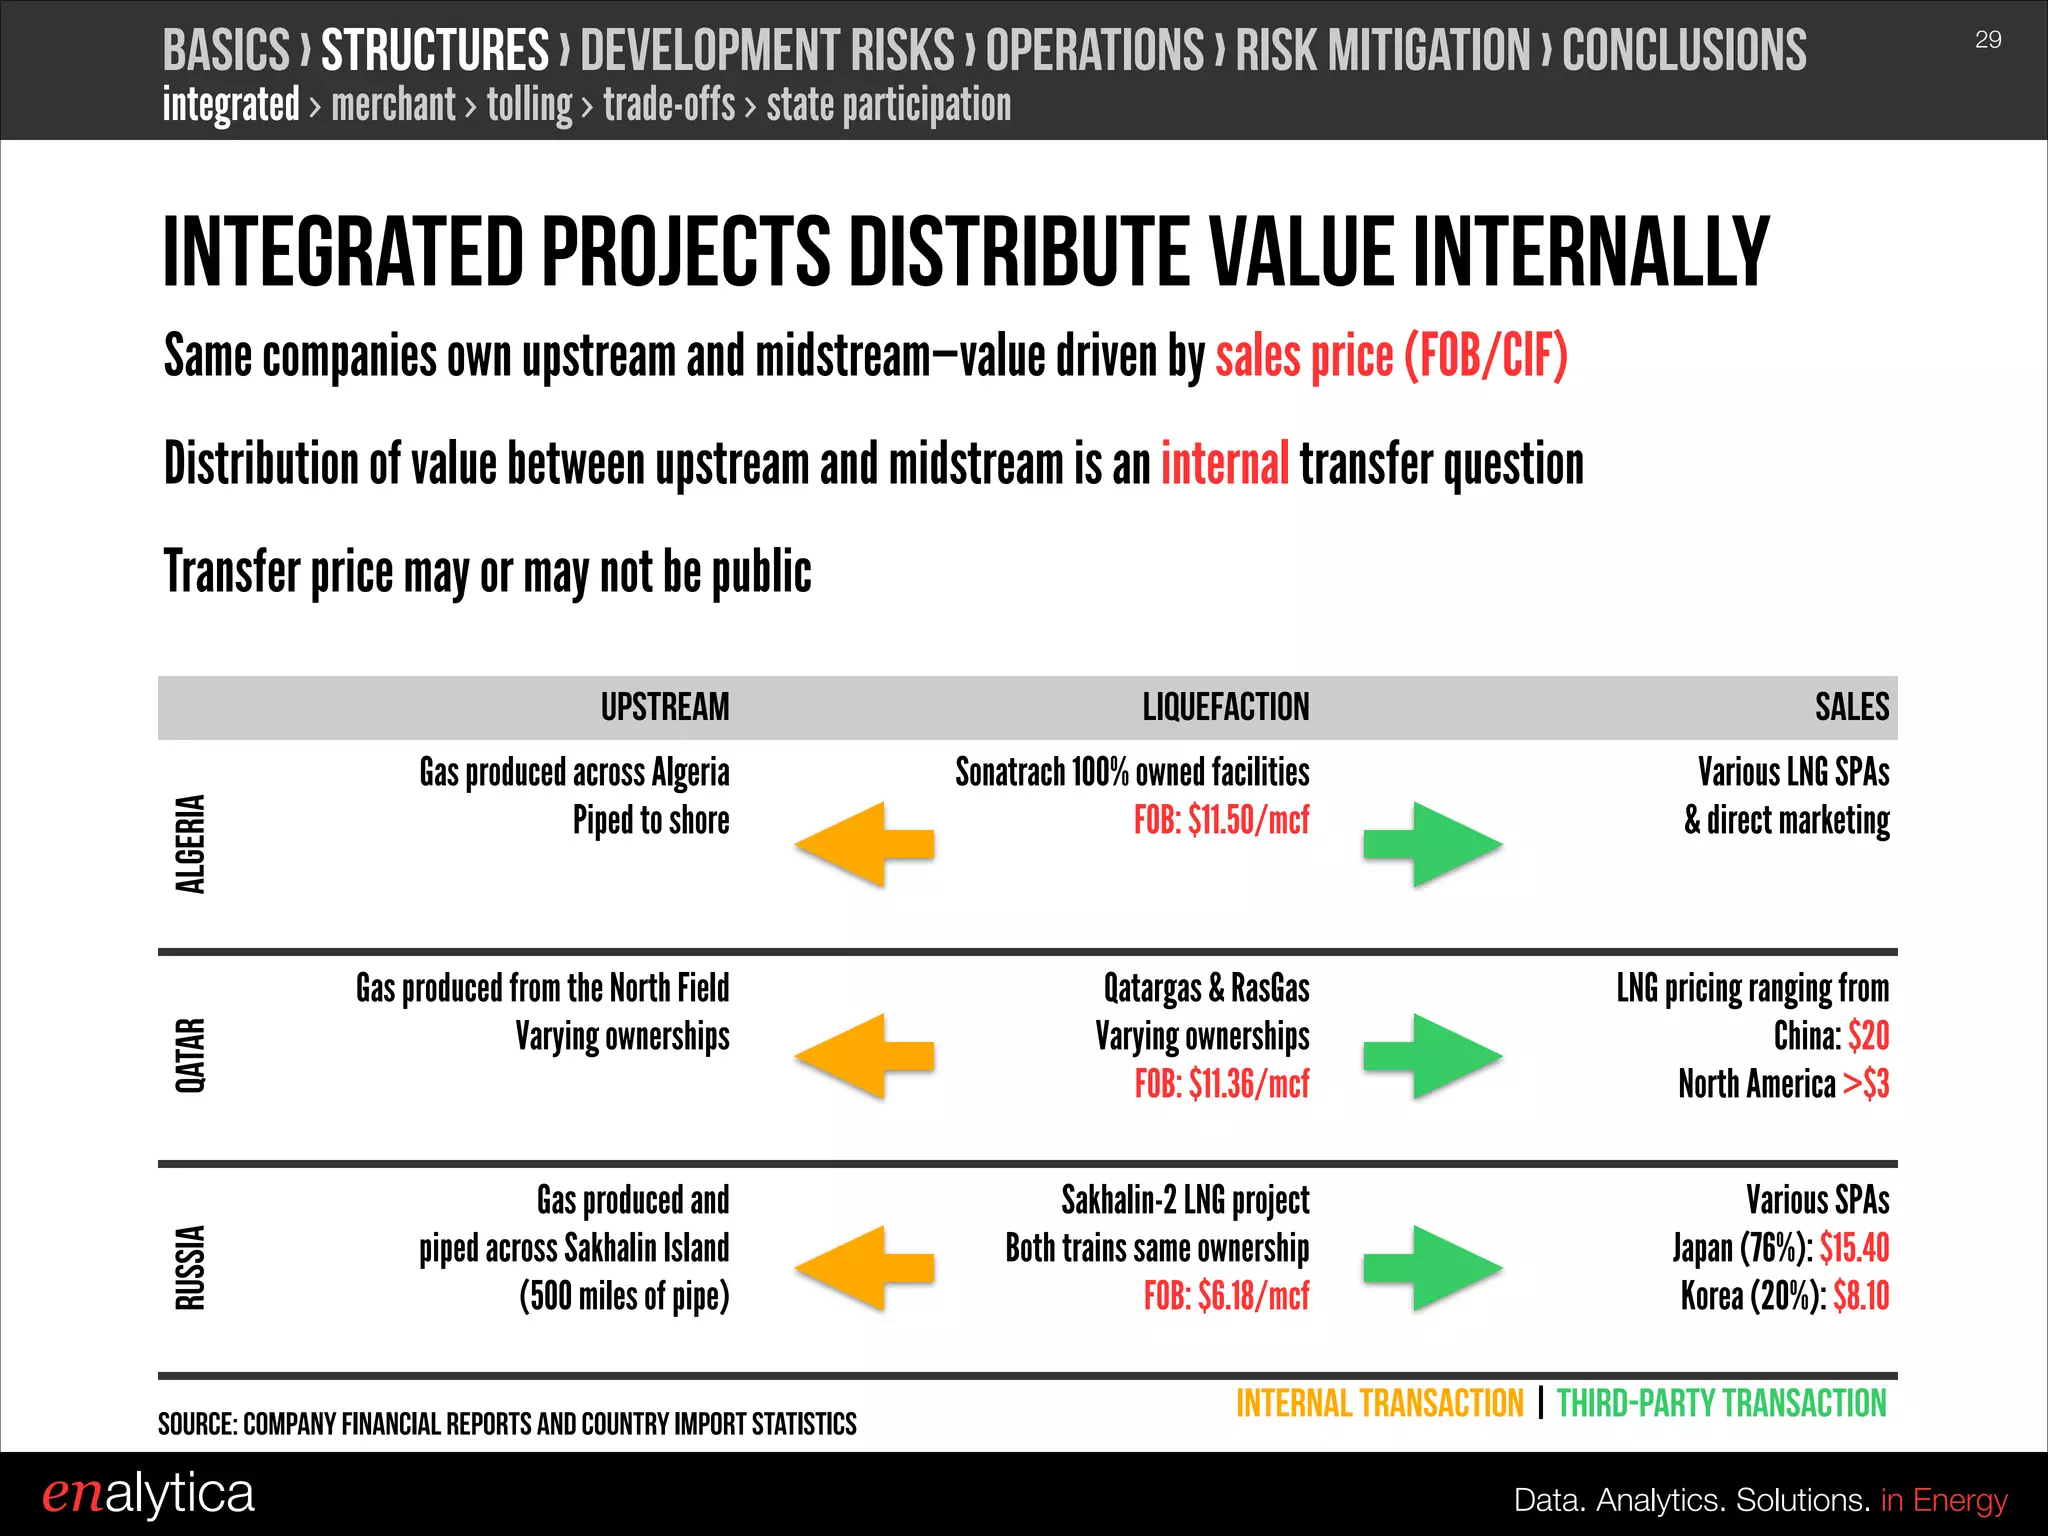
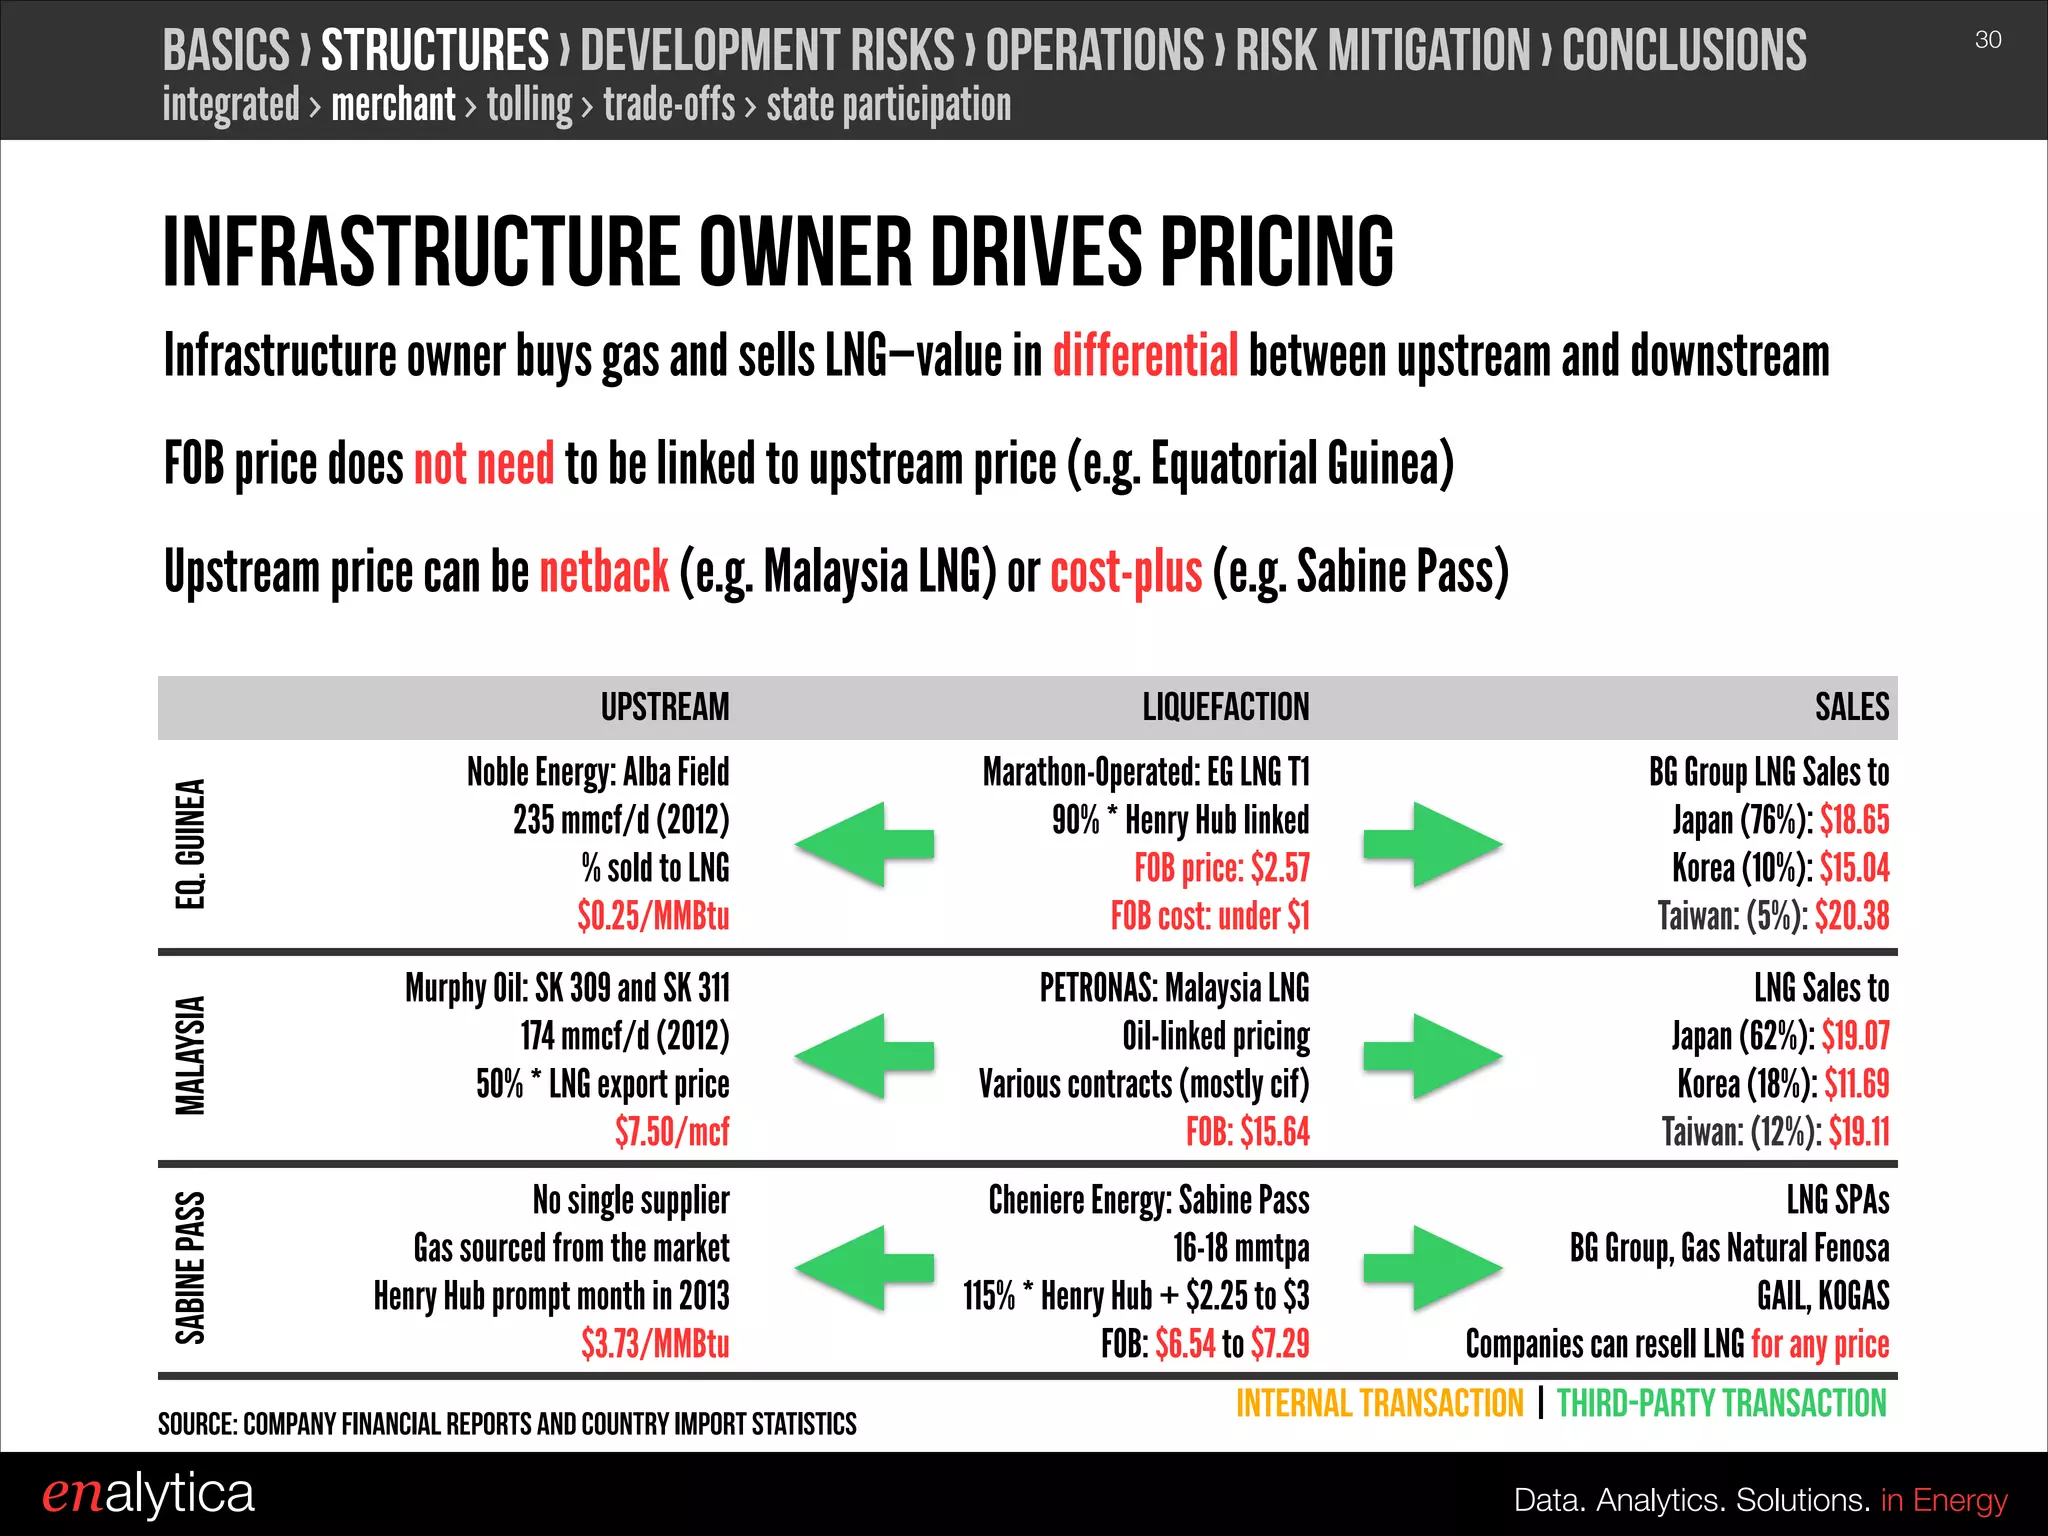

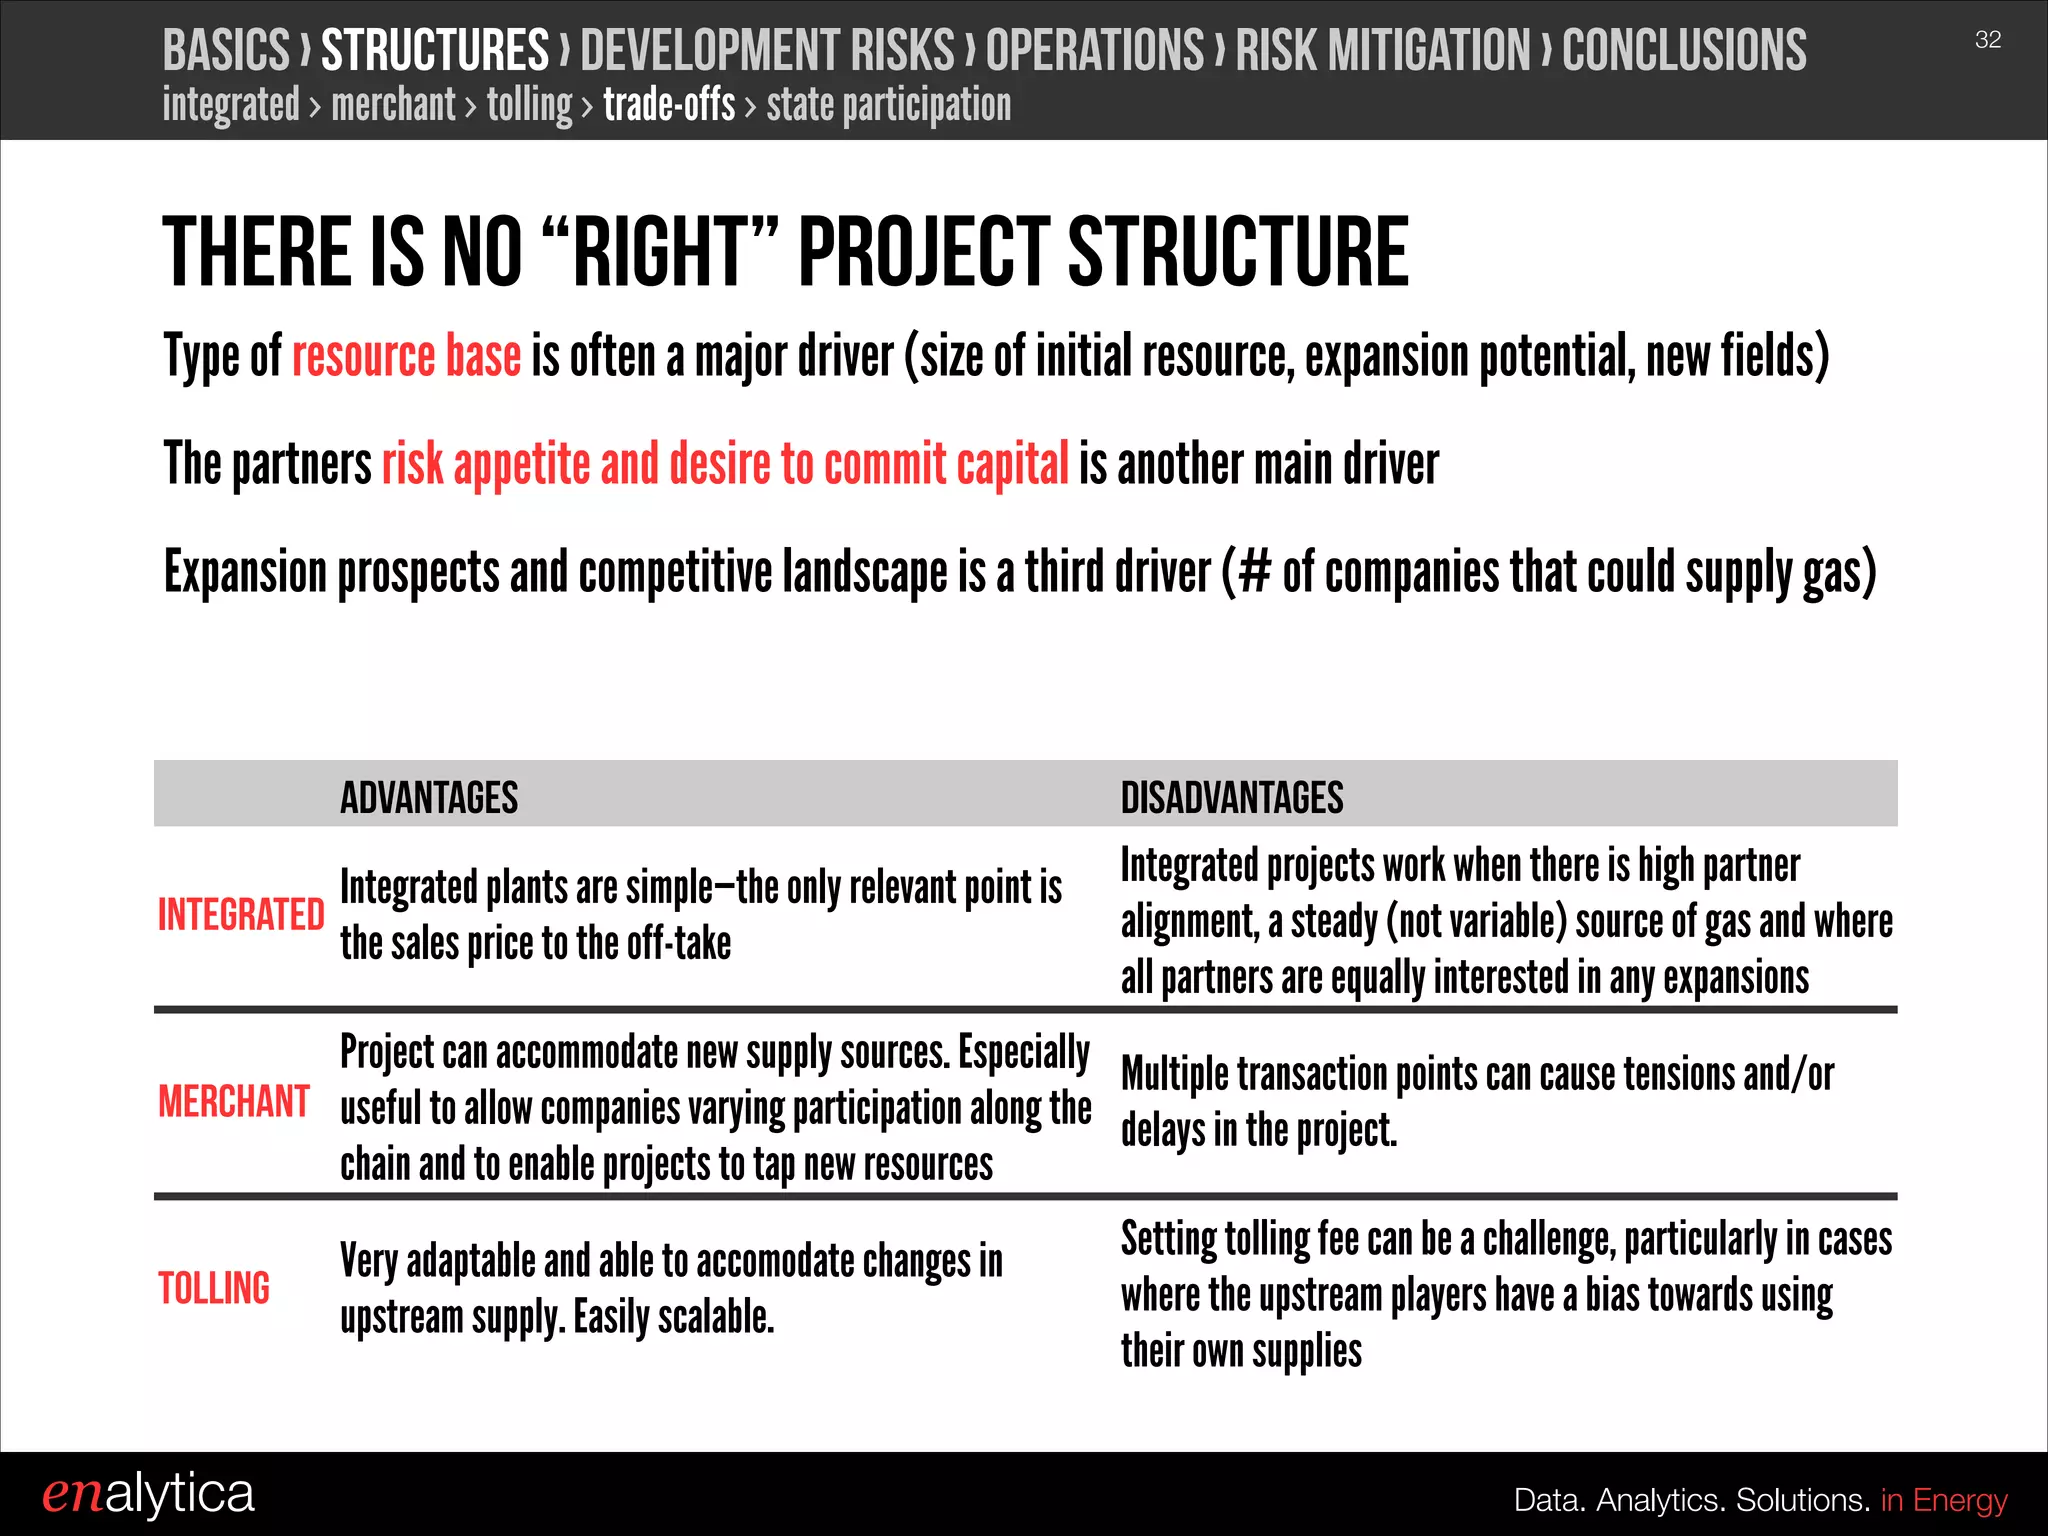
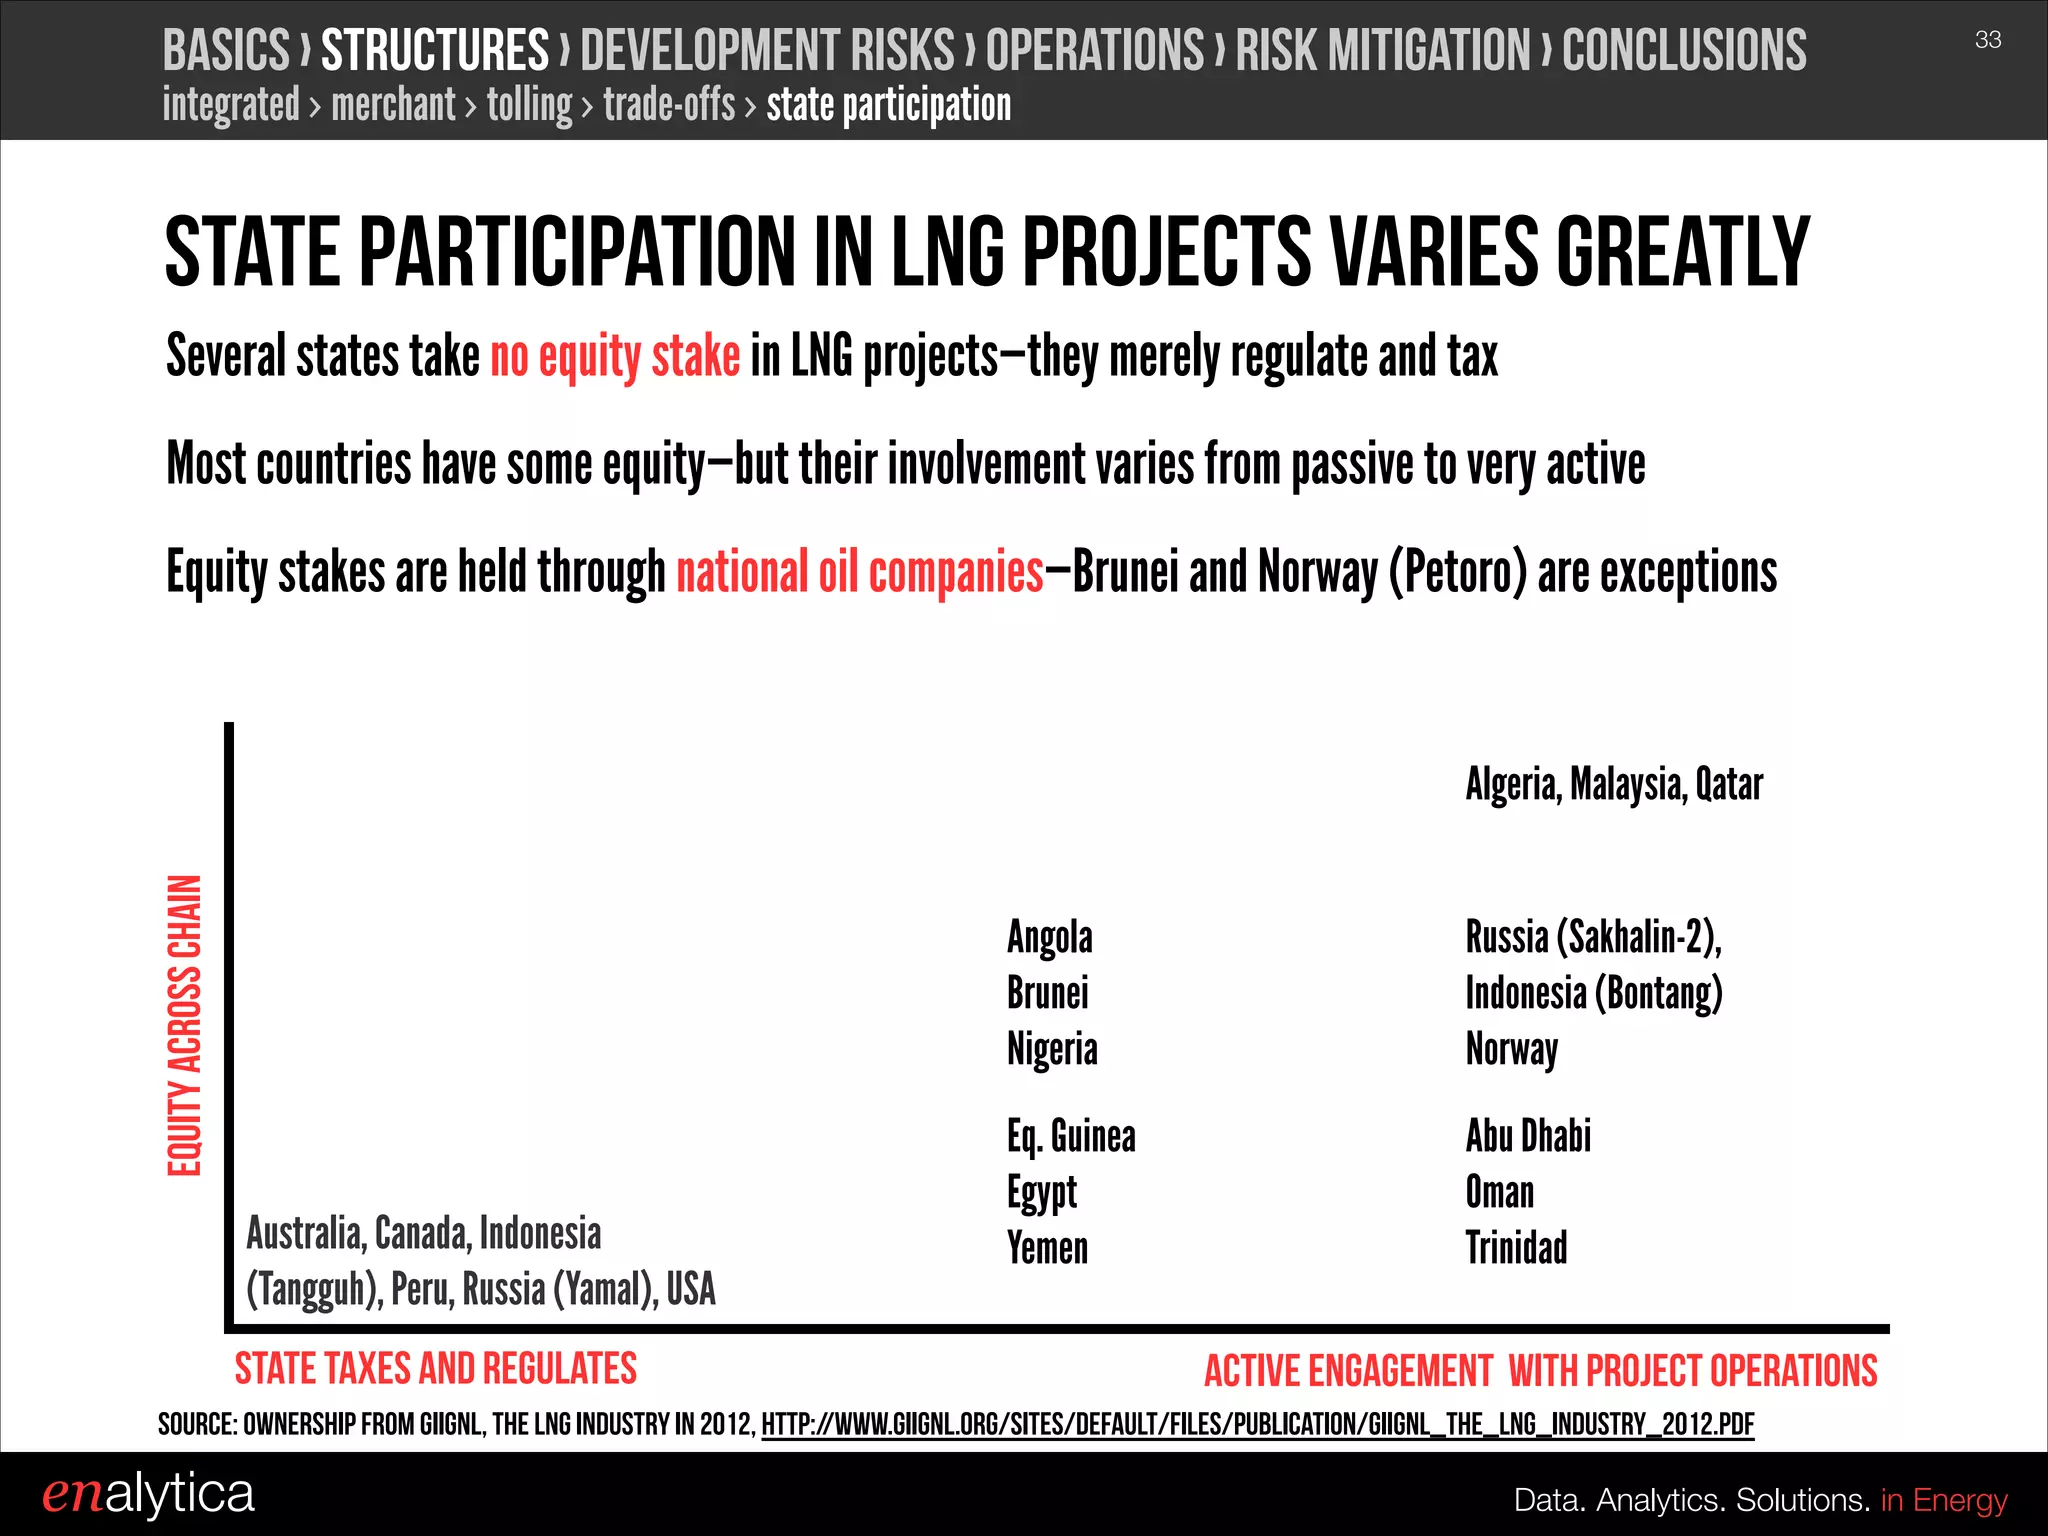

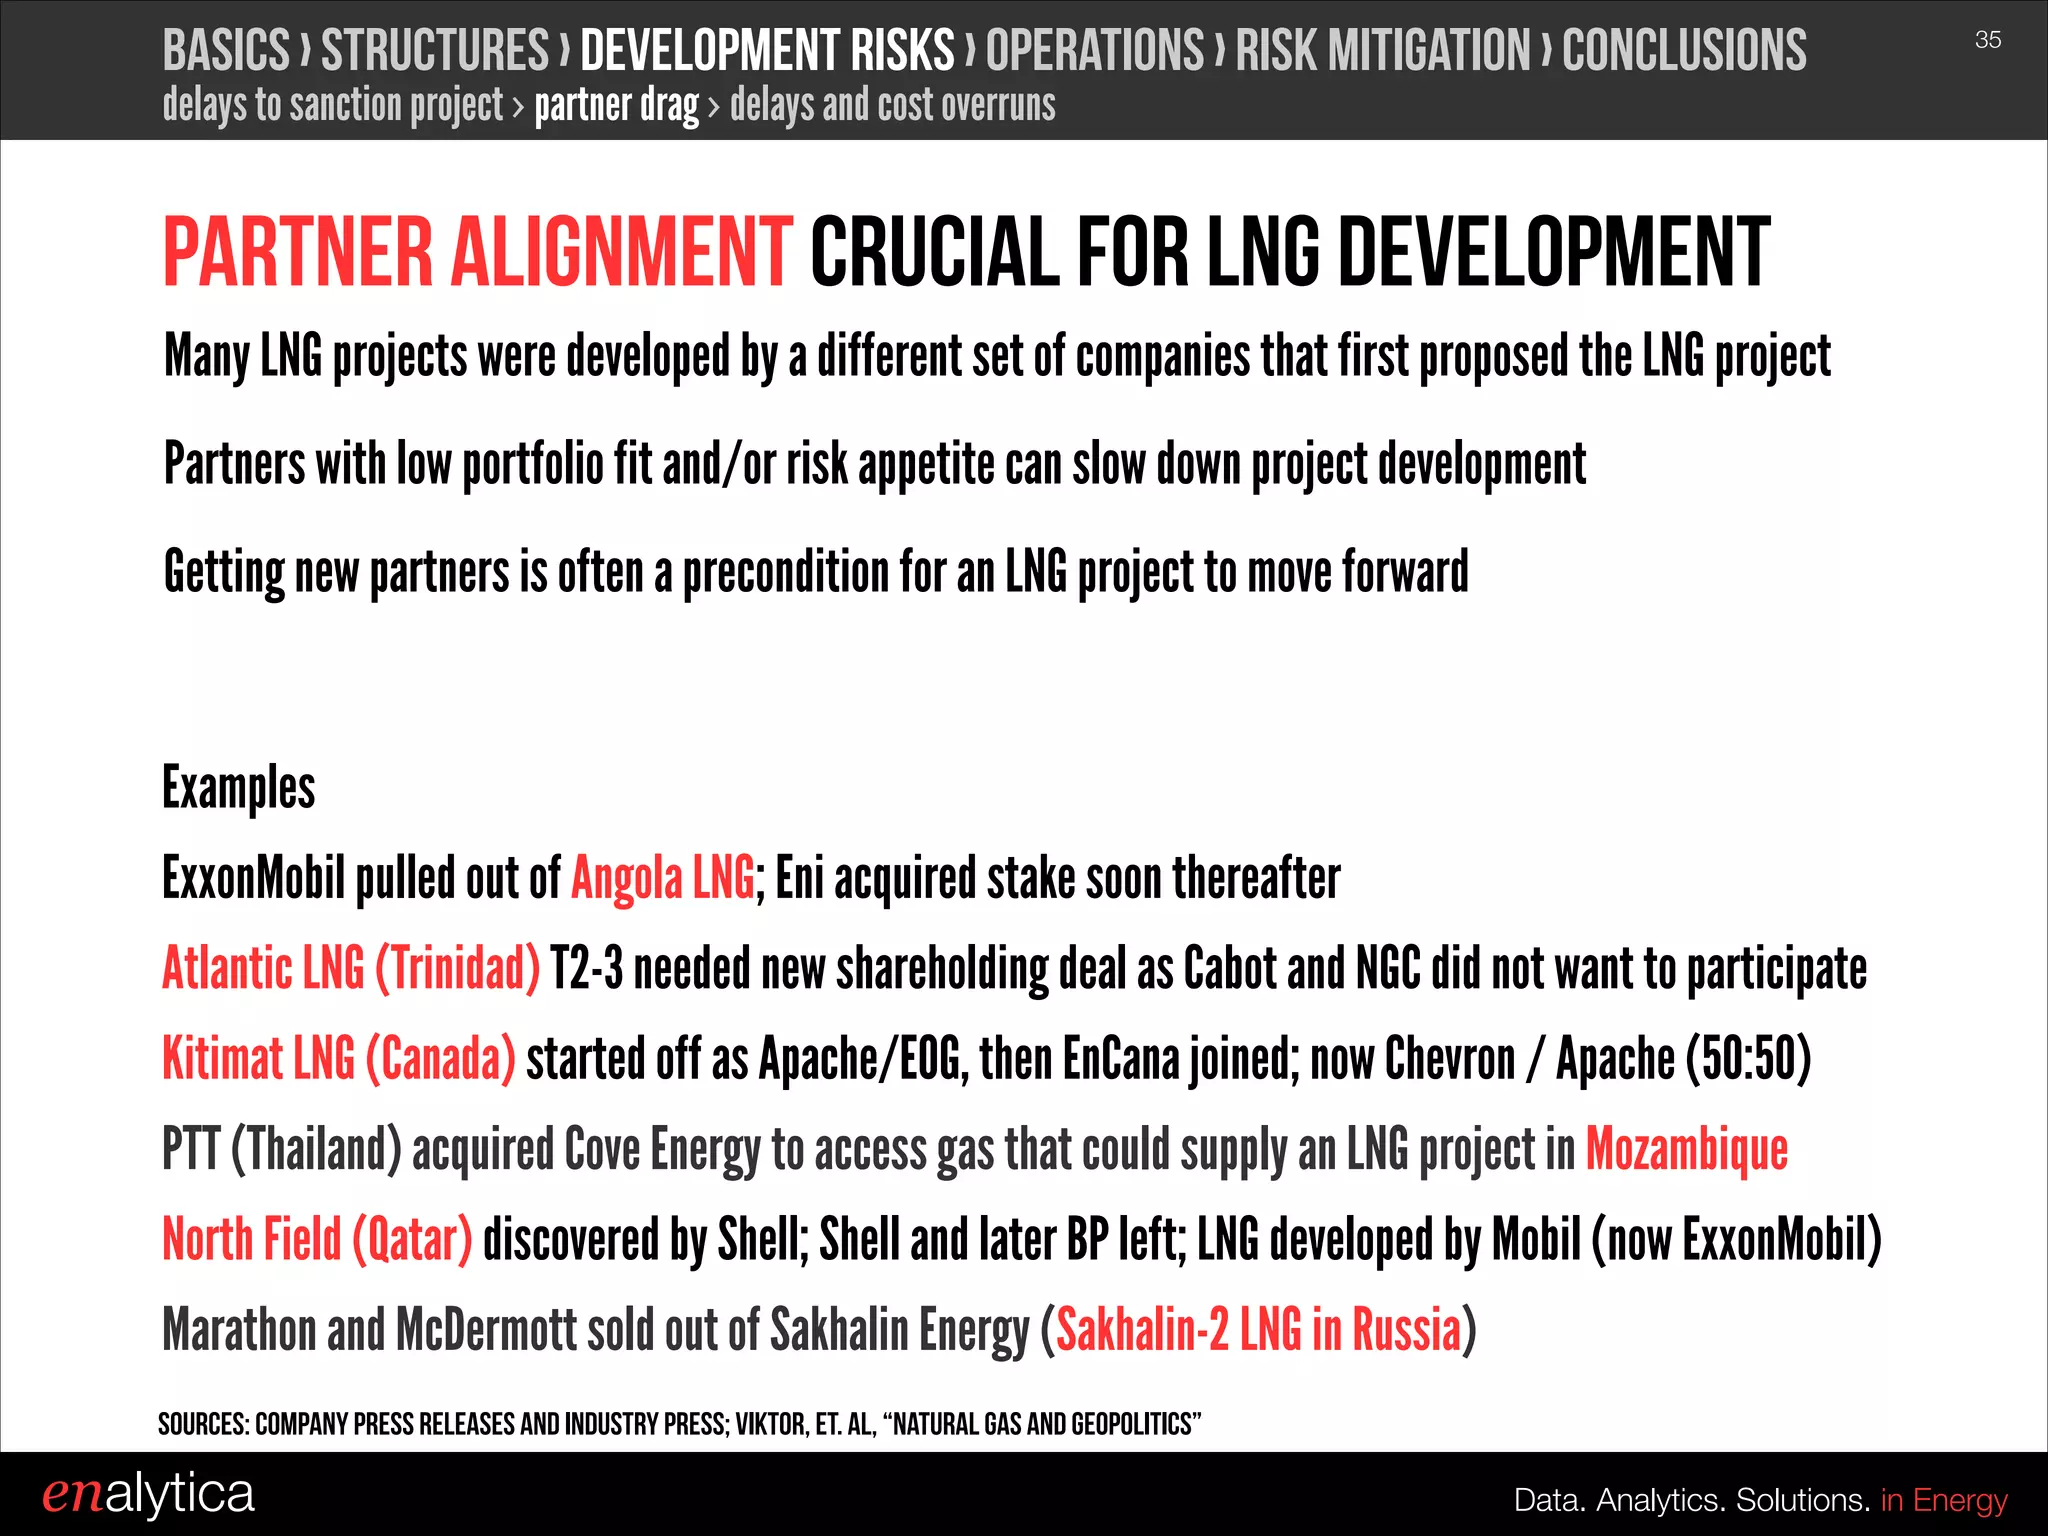


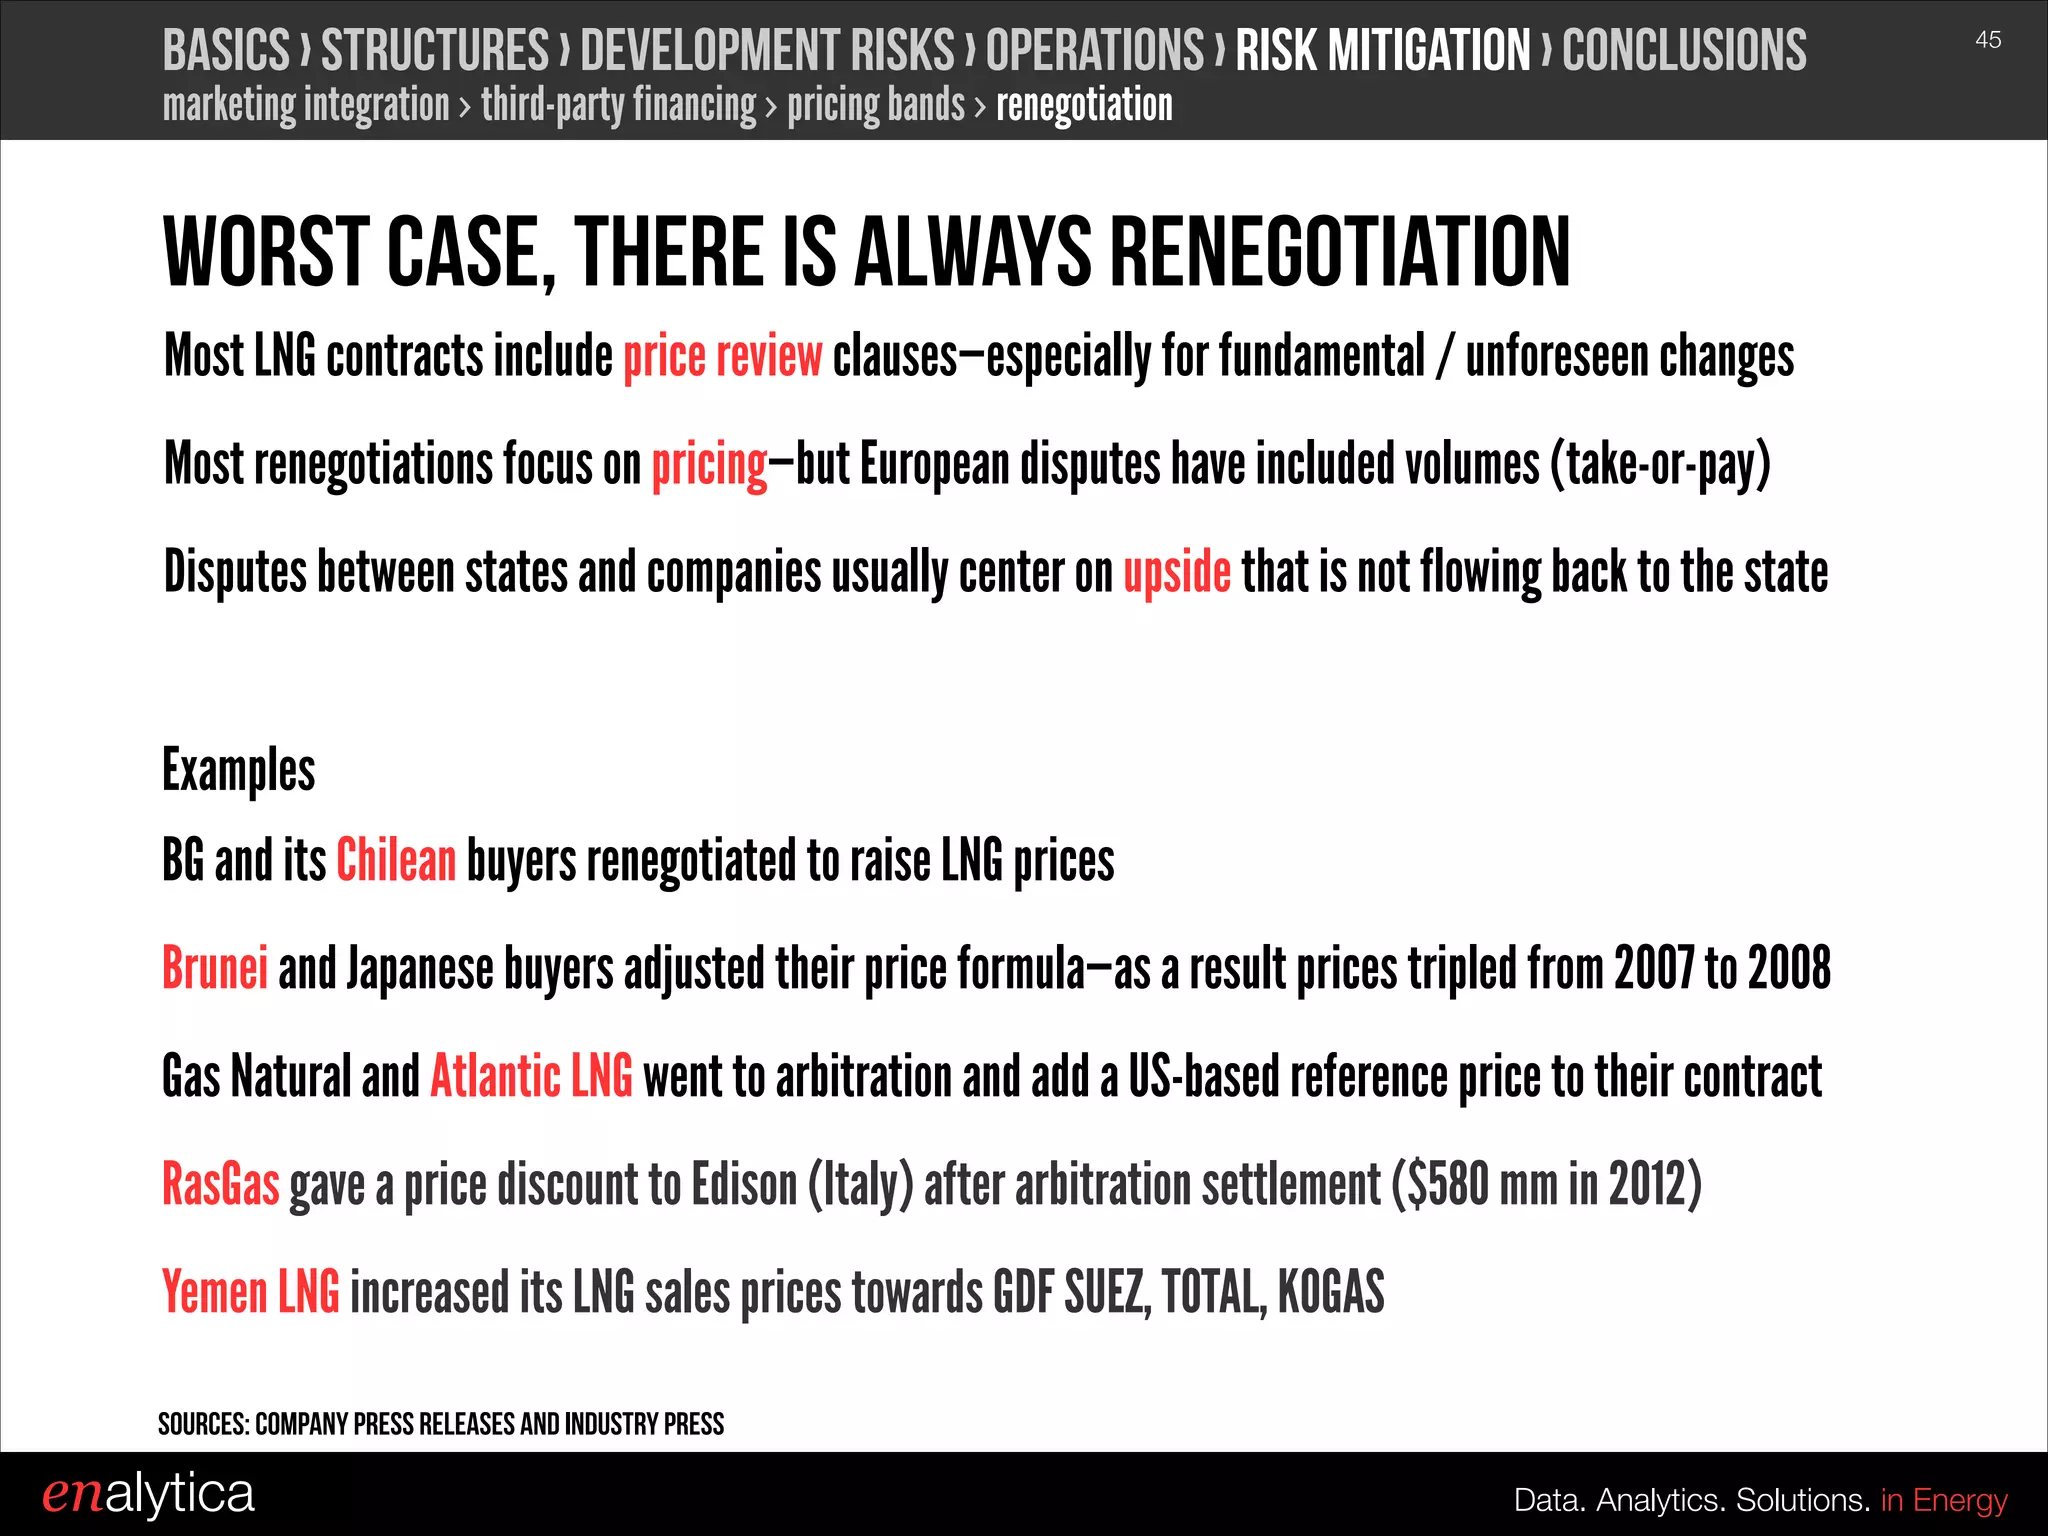


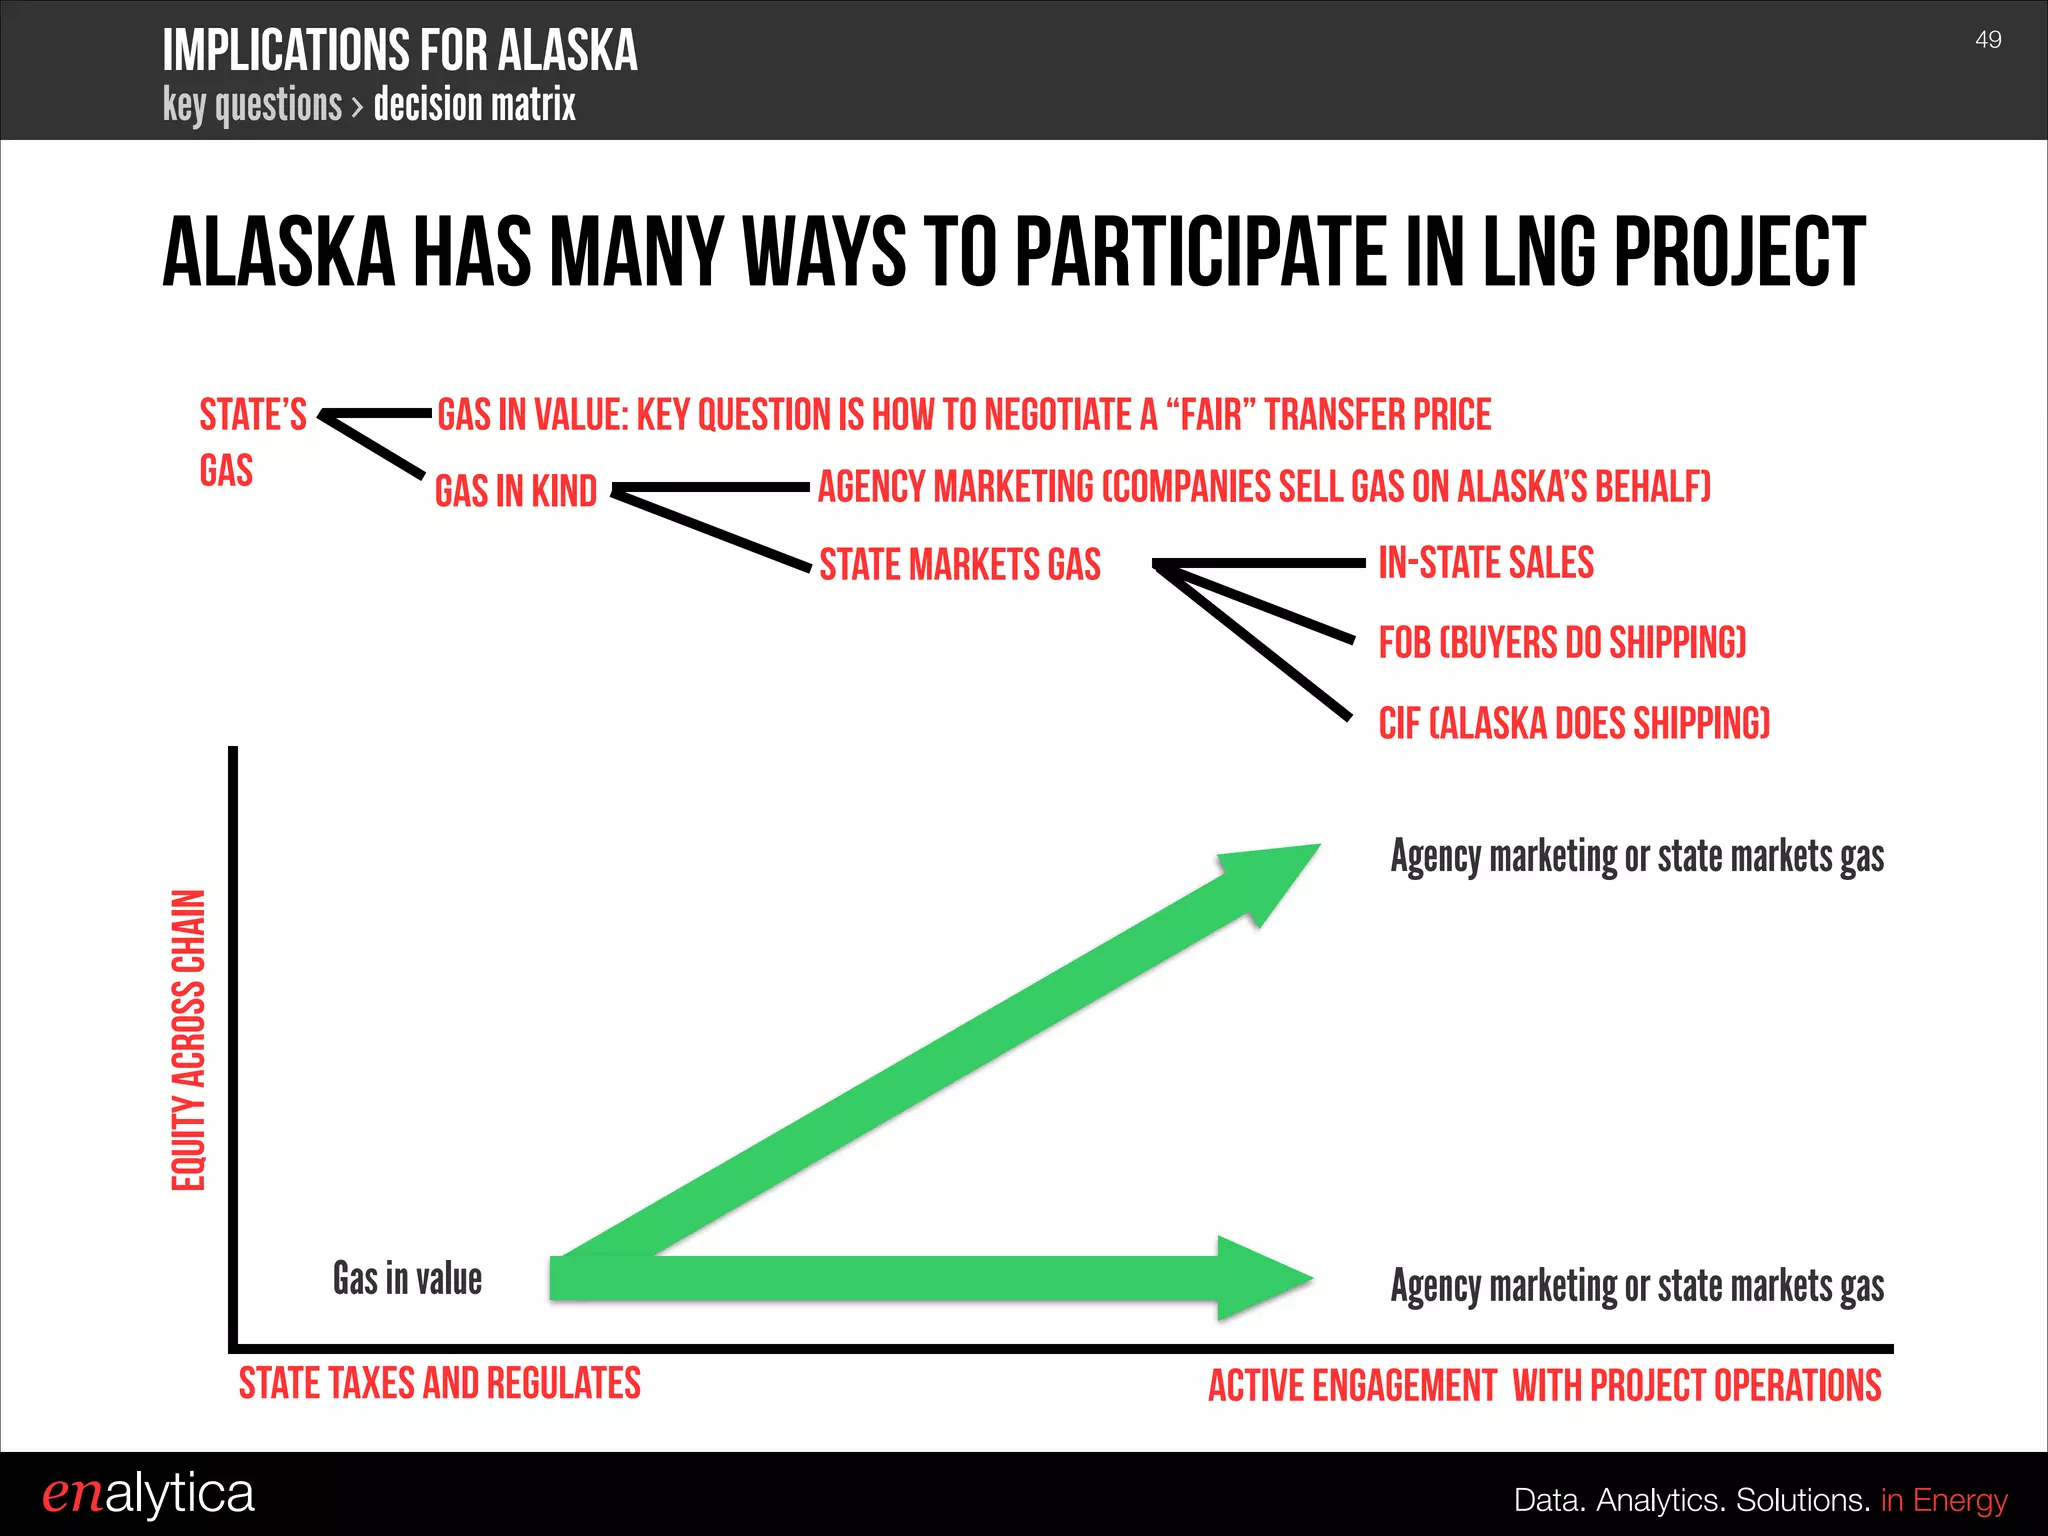


The document provides an outlook on the natural gas market and the fundamentals of the LNG business, emphasizing the rising demand for gas which is expected to grow faster than overall energy demand until 2035. It highlights LNG as the fastest-growing segment, especially in Asia, and discusses the complexities and risks associated with LNG projects in Alaska. Additionally, it covers strategies for Alaska's participation in LNG projects, including pricing negotiation and state involvement in the value chain.


