Ssgc Case Study Ibm
•
1 like•1,005 views

Sui Southern Gas Company (SSGC) in Pakistan deployed an innovative geographic information system (GIS) running on an IBM POWER7-based system to improve its ability to track supply and demand patterns for natural gas. The solution overlays digital maps with operational and financial data, enabling SSGC to visualize and analyze data geospatially. This provides better insight into issues like gas leakages and unaccounted-for gas. The new system using IBM Cognos software replaced outdated paper maps and manual reporting, allowing SSGC to more efficiently match supply and demand.

Recommended
More Related Content
Viewers also liked
Viewers also liked (11)
Similar to Ssgc Case Study Ibm
Similar to Ssgc Case Study Ibm (20)
Ssgc Case Study Ibm
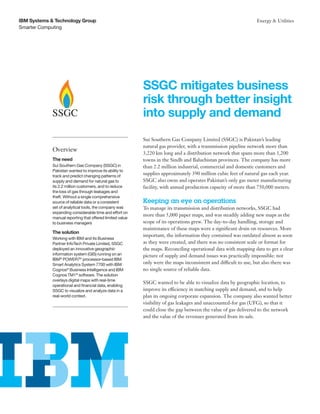
- 1. IBM Systems & Technology Group Energy & Utilities Smarter Computing SSGC mitigates business risk through better insight into supply and demand Sui Southern Gas Company Limited (SSGC) is Pakistan’s leading natural gas provider, with a transmission pipeline network more than Overview 3,220 km long and a distribution network that spans more than 1,200 The need towns in the Sindh and Baluchistan provinces. The company has more Sui Southern Gas Company (SSGC) in than 2.2 million industrial, commercial and domestic customers and Pakistan wanted to improve its ability to track and predict changing patterns of supplies approximately 390 million cubic feet of natural gas each year. supply and demand for natural gas to SSGC also owns and operates Pakistan’s only gas meter manufacturing its 2.2 million customers, and to reduce facility, with annual production capacity of more than 750,000 meters. the loss of gas through leakages and theft. Without a single comprehensive source of reliable data or a consistent Keeping an eye on operations set of analytical tools, the company was To manage its transmission and distribution networks, SSGC had expending considerable time and effort on more than 5,000 paper maps, and was steadily adding new maps as the manual reporting that offered limited value to business managers scope of its operations grew. The day-to-day handling, storage and maintenance of these maps were a significant drain on resources. More The solution important, the information they contained was outdated almost as soon Working with IBM and its Business Partner InfoTech Private Limited, SSGC as they were created, and there was no consistent scale or format for deployed an innovative geographic the maps. Reconciling operational data with mapping data to get a clear information system (GIS) running on an picture of supply and demand issues was practically impossible: not IBM® POWER7® processor-based IBM Smart Analytics System 7700 with IBM only were the maps inconsistent and difficult to use, but also there was Cognos® Business Intelligence and IBM no single source of reliable data. Cognos TM1® software. The solution overlays digital maps with real-time SSGC wanted to be able to visualize data by geographic location, to operational and financial data, enabling SSGC to visualize and analyze data in a improve its efficiency in matching supply and demand, and to help real-world context. plan its ongoing corporate expansion. The company also wanted better visibility of gas leakages and unaccounted-for gas (UFG), so that it could close the gap between the value of gas delivered to the network and the value of the revenues generated from its sale.
- 2. IBM Systems & Technology Group Energy & Utilities Smarter Computing “As part of our GIS project, we needed a single source of the truth for business analytics,” explains Irfan Zafar, Chief Technology Innovation The benefit Officer and Senior General Manager of Customer Services, Sui User-driven reporting with real-time data Southern Gas Company Limited. “We had some analytics tools already, updates has replaced the laborious, but they were limited in scope, and did not span the full spectrum of time-consuming creation of static reports. Different views and dashboards our information needs. Metrics were not always defined consistently are provided to each different type of across different systems, and it was difficult to compare data from information consumer within SSGC. With different sources. In addition to improving the quality and consistency a single trusted version of information, of the underlying data, we wanted to deliver information faster, to and the ability to geo-reference data, SSGC has a scalable integration introduce user-driven reporting, on demand.” platform to handle the variety of data and dramatically improve the speed and clarity of its insight into supply and Choosing IBM Smart Analytics demand issues. SSGC worked with ESRI, IBM and IBM Business Partner InfoTech Private Limited to create a combined GIS and analytics solution that features ESRI ArcGIS mapping software and an IBM POWER7 processor-based Smart Analytics System 7700 solution. The first stage of the project was the creation of a digital base map that merges spatial and geodesic data with scanned paper maps, new digital maps and satellite images. The base map covers land-use functions, water resources, gas pipeline network and assets, road and railway networks, and major and minor landmarks. In the second stage, the combined project team integrated the base map with a sophisticated yet user- friendly analytics solution. Smarter Computing: The IT Infrastructure of a Smarter Planet The IBM solution aggregates geographic data from more than 5,000 maps with data on assets (pipelines, fittings, depots), road and rail networks, and data from SSGC’s ERP and billing systems. By combining real-time operational and current geographic information, the solution enables timely, sophisticated analytics that reveal previously hidden insights. Uniting operational data with geographic data brings reporting and analysis to life, enabling SSGC to visualize supply and demand issues as never before. What-if analyses enable the business to test new ideas faster and understand the results with greater clarity, supporting key business transformation initiatives. The IBM Smart Analytics System 7700 solution is a pre-integrated and optimized stack of data warehouse management software, analytics tools, storage and IBM Power Systems servers. Designed to deliver optimal performance and flexibility for business analytics, the IBM solution was also fast and easy to deploy. As a complete business-ready analytics solution, the IBM Smart Analytics System 7700 offers simple deployment and operation, yet provides a rich and complete stack of technologies with the resiliency required for SSGC to analyze data with confidence and focus on business issues rather than on platform integration.
- 3. IBM Systems & Technology Group Energy & Utilities Smarter Computing Kashif Qadeer, Deputy General Manager (Business Systems), Sui Southern Gas Company Limited, comments, “Our key selection Solution Components criteria for the data warehouse and the analytics parts of the solution Hardware included the performance and scalability of the technology, the • IBM® Power® 740 quality of ETL [extract, transform, load] tools, and the quality of the • IBM System Storage® DS5300 user interface. The IBM solution scored highly in all areas, and we Software particularly appreciated the user-friendliness of the Cognos interfaces. • IBM AIX® We also found that the availability of skilled personnel in Pakistan • IBM Cognos® 8 Business Intelligence was much better with IBM than with Teradata or Oracle, and IBM’s • IBM Cognos TM1® • IBM General Parallel File System commercial offer was also much more compelling.” • IBM InfoSphere® Business Glossary • IBM InfoSphere Change Data Capture The key components of the data warehouse are IBM InfoSphere® • IBM InfoSphere DataStage • IBM InfoSphere Metadata Workbench Warehouse, IBM InfoSphere Business Glossary and IBM InfoSphere • IBM InfoSphere QualityStage DataStage®. The IBM Smart Analytics System 7700 deployed by SSGC • IBM InfoSphere Warehouse Enterprise is a pre-integrated stack of data warehouse management software and Edition analytics tools, with an IBM System Storage® DS5300 array and an IBM Business Partner IBM Power® 740 server with IBM POWER7 processors. Tuned to • InfoTech Private Limited deliver optimal performance and flexibility for business analytics, the IBM solution was also fast and easy to deploy, enabling SSGC to focus on business issues rather than on integration. “Both IBM and InfoTech were very accommodating during the deployment regarding change requests and scope variations,” says Irfan Zafar. “This helped to ensure a very smooth rollout with minimal disruption to the business. The combination of IBM analytics software and the IBM Power 740 server enables us to deliver business reporting faster, with low total cost of ownership.” Gaining a comprehensive view The combined GIS and analytics solution provides a web portal that delivers detailed, multi-layered digital maps overlaid with business and customer information for improved decision-making. Users can generate up-to-date versions of pre-built reports tailored to meet the needs of different job functions and management levels. Executive dashboards provide at-a-glance views of performance, and managers can use the intuitive drag-and-drop interface of IBM Cognos Report Studio to create their own tailored reports. There are two main application groups for business intelligence and analytics at SSGC: Customer Care and Billing, and ERP. The solution is already fully rolled out to the first group, which will represent 90 percent of the eventual total user base. SSGC is now integrating data from its ERP system into the combined GIS and analytics solution. When this part of the project is complete, SSGC will be able to consolidate information on gas sales (managed in the Customer Care and Billing environment) with information on gas purchases (managed in the ERP environment) in real time. This new insight will help improve pricing efficiency and maximize profitability.
- 4. IBM Systems & Technology Group Energy & Utilities Smarter Computing The GIS system includes full information on SSGC’s pipeline assets, with details such as the year each pipe was laid, and the materials used “With IBM Cognos in its construction. This information is cross-referenced to information Business Intelligence, on the local population, supporting improved risk analysis around the reporting is essentially likelihood gas pilferage. The GPS coordinates for every customer are stored in the system and cross-referenced to meter readers, enabling instantaneous, so there’s SSGC to ensure that field operatives are completing this work no need to wait until the correctly. month-end - or longer - The transmission network has a full SCADA (supervisory control and to get the latest figures. data acquisition) solution that is linked into the GIS, so that SSGC There’s also no effort can monitor the health of components and see incidents on the map in required, and the business real time. The distribution network is not controlled in the same way, though it does include some gas-leak detectors that deliver real-time is no longer reliant on alerts into the GIS. the IT function to get the reporting done.” Having built up internal skills with help from IBM and InfoTech, SSGC is now actively looking to offer similar GIS and analytics solutions to external clients, both in its own industry and beyond. —Kashif Qadeer, Deputy General Manager (Business Systems), Sui Southern Gas Company Limited Benefiting from enhanced reporting The IBM solution gives SSGC faster, more accurate and more comprehensive reporting and analytical capabilities, helping the company to identify hot spots for leaks and pilferage, to visualize supply and demand issues, and to undertake what-if analyses to plan more efficient processes. The creation of a data warehouse to store operational data for analysis and reporting has given SSGC a single version of the truth, improving the consistency and reliability of reporting. Thanks to the data warehouse, SSGC can also now easily leverage information from a wide variety of sources, providing a richer view of operational performance across multiple different dimensions and a better understanding of customer behavior. In the past, all reporting was based on month-end data - the billing cycle was, and continues to be, monthly. More than 1,000 standard reports on financial, volumetric and taxation data were run each month, and were typically available approximately 15 days into the following month. It would then take time for the reports to be manipulated and to reach the decision-makers - in some cases, managers were not receiving actionable information until the end of the following month, severely impacting the responsiveness of the business. Equally, the delay between taking an action and seeing the outcome made it difficult and risky to test new ideas.
- 5. IBM Systems & Technology Group Energy & Utilities Smarter Computing Kashif Qadeer comments, “In many cases, we were using Excel scripts to pull data in from multiple operational systems - that alone could “The IBM analytics take up to 48 hours. You would need to work on the report for a couple solution greatly improves of days to validate the data. With IBM Cognos Business Intelligence, our ability to define and reporting is essentially instantaneous, so there’s no need to wait until the month-end - or longer - to get the latest figures. There’s also no monitor business KPIs, effort required, and the business is no longer reliant on the IT function and it brings much to get the reporting done.” greater transparency Previously, it might have taken up to a week for the IT function to to reporting. We now create a new report. Now, business managers can use Cognos Report have a single version of Studio to build their own reports in minutes. They are also now self- the truth, and a single sufficient - the only time the IT function needs to get involved is when the business wants to add a new data source (and even this is now just a comprehensive report one-off ETL exercise). for each topic, instead of the multiple overlapping “The IBM solution has made a huge difference to the way we do business,” says Kashif Qadeer. “Business users now have the power to reports that we previously run forecasts, to test new ideas, and to see the impact of changes almost had, all giving a slightly immediately. They also spend far less time manually creating and different picture.” tweaking reports, so they can work much more productively.” Irfan Zafar comments, “The IBM analytics solution greatly improves — Irfan Zafar, Chief Technology Innovation Officer and Senior General Manager of our ability to define and monitor business KPIs, and it brings much Customer Services, Sui Southern Gas Company greater transparency to reporting. We now have a single version of the Limited truth, and a single comprehensive report for each topic, instead of the multiple overlapping reports that we previously had, all giving a slightly different picture. Reports are automatically and instantly refreshed with the latest data, so the business can actually see the impact of any changes it makes within days, rather than having to wait a month for the next report to appear.” For more information Contact your IBM sales representative or IBM Business Partner, or visit us at: ibm.com/systems/smartercomputing
- 6. © Copyright IBM Corporation 2012 IBM Corporation Systems and Technology Group Route 100 Somers, NY 10589 Produced in the United States of America April 2012 IBM, the IBM logo, ibm.com, AIX, Cognos, DataStage, DB2, GPFS, InfoSphere Power, POWER7, Power Systems, System Storage and TM1 are trademarks of International Business Machines Corp., registered in many jurisdictions worldwide. Other product and service names might be trademarks of IBM or other companies. A current list of IBM trademarks is available on the Web at “Copyright and trademark information” at www.ibm.com/legal/copytrade.shtml This document is current as of the initial date of publication and may be changed by IBM at any time. Not all offerings are available in every country in which IBM operates. The client examples cited are presented for illustrative purposes only. Actual performance results may vary depending on specific configurations and operating conditions. It is the user’s responsibility to evaluate and verify the operation of any other products or programs with IBM products and programs. THE INFORMATION IN THIS DOCUMENT IS PROVIDED “AS IS” WITHOUT ANY WARRANTY, EXPRESS OR IMPLIED, INCLUDING WITHOUT ANY WARRANTIES OF MERCHANTABILITY, FITNESS FOR A PARTICULAR PURPOSE AND ANY WARRANTY OR CONDITION OF NON-INFRINGEMENT. IBM products are warranted according to the terms and conditions of the agreements under which they are provided. Please Recycle POC03092-USEN-01