The real estate market in Oklahoma saw improvements in May 2013 compared to May 2012. Closed home sales increased 1.9% while average home prices rose 5.9% and average days on market decreased by over 10%. Total housing inventory declined 14.9% from the previous May. These positive trends indicate a strengthening market with increasing home values and a decreasing housing surplus. The report recommends contacting a local REALTOR for help navigating the real estate market.
Epic research daily commodity report 03rd apr 2017Epic Research
Epic Research contributes in rich returns of traders by depicting with most accurate stock market trading tips. Useful market insights are also offered through daily reports.
Epic Research is a leading financial advisory. We offer daily report on different segments of market to make the traders and investors aware about the market's performance and updates.
Epic research daily commodity report 07th mar 2017Epic Research
Epic Research Limited counts as the top research providing firm all over India as well as other global markets. We can say that 'Market Research' is the soul of the organization and the trust builder for the client base.
Epic research daily commodity report 27th april 2017Epic Research
Epic Research Limited counts as the top research providing firm all over India as well as other global markets. Our team having experienced researchers who offer updates on the sectors like – equity trading, commodity trading, FOREX trading, Equity tips etc.
Epic Research is a leading financial advisory. We offer daily report on different segments of market to make the traders and investors aware about the market's performance and updates.
Special report by epic research of 01 december 2017Epic Research
Epic Research is leading financial advisory company, We provide a daily special report on each segment of share market that helps traders to get a better overview of the market. It also improves return on investment.
GOLD - Gold on MCX settled up 0.18% at 28629 on short covering moving prices further away from their
lowest level in around five weeks as recent selling pressure tied to bets on another US interest rate hike this year
Special report by epic research of 24 november 2017Epic Research
Epic Research prepares a special report on a daily basis which provides share market overview to the investors in brief. We aim to serve you best in class financial services at affordable prices.
China's economic policymakers clearly didn't consult mother-of-one Chen Xuejun when they
decided to try stimulating consumer demand by slashing import tariffs on sneakers to skincare.
The 28-year-old speaks for many Chinese shoppers when she says the move last week won't
make her shift her purchases back home from overseas, suggesting the economic upside may be
less than Beijing has bargained for.
Epic Research is one of the best advisory company in Indore Madhya Pradesh. Apply today for the stock market advisor and build your career in stock market trading. Join our team now for job application visit Epic Research.
Epic Research has India's best experienced research analyst they keep on eyes 24*7 on market and update Daily & Weekly report of trading market in all market segments like Equity,Comex,Commodity,Forex etc.
Special report by epic research of 29 november 2017Epic Research
Epic Research prepares a special report on a daily basis which provides share market overview to the investors in brief. We aim to serve you best in class financial services at affordable prices.
Epic research daily commodity report 3rd jan 2017Epic Research
Epic Research Limited counts as the top research providing firm all over India as well as other global markets. We can say that 'Market Research' is the soul of the organization and the trust builder for the client base.
Special report by epic research of 14 aug 2017Epic Research
Epic Research is a leading financial advisory company provides daily share market reports on different segments. it provides daily updates to investors as well as it helps investors to boost their performance in the market.
Epic Research is a leading financial advisory. We offer daily report on different segments of market to make the traders and investors aware about the market's performance and updates.
GOLD -Gold on MCX settled down -0.52% at 28943 pauses it's run and slipped away trimming its recent gains as the dollar
regained some ground ahead of a string of US data due later in the day and on Friday amid mounting hopes for a June rate hike
by the Federal Reserve. Despite the recent run on resistance, day traders continue to buy on the dips.
Special report by epic research of 15 december 2017Epic Research
Epic Research is leading financial advisory company, We provide a daily special report on each segment of share market that helps traders to get a better overview of the market. It also improves return on investment.
Oklahoma State Treasurer Ken Miller's presentation on the Oklahoma Economic Outlook at Oklahoma Association of REALTORS® 2012 Leadership Development Conference.
June 2013's Monthly Indicators report - Boston Real Estate Market TrendsUnit Realty Group
What’s going on in the Boston real estate market? Concerns about interest rates rising helped push activity higher in the spring, which resulted in an increase in closed sales in June. Prices continue to move up because demand for available homes to buy is outpacing supply. Sellers are gaining confidence as new listings continue to be added to the market.
June single-family home sales – Up 1.6% over last year. June Single-family median prices were UP 6.9% to $350,000 (highest point since Aug. ‘07 $357k). Condo sales up 0.4% and median prices UP 2.9% ($320,000) (only 3rd time over $300k).
April 2013's Monthly Indicators report - Boston Real Estate Market TrendsUnit Realty Group
Here's April 2013's Monthly Indicators report from the Greater Boston Association of Realtors®. What's going on in the Boston real estate market?
• Shortage of homes to buy has pushed sales down in April as buyer interest remains high.
• Prices continue to move up because demand for available homes to buy is outpacing supply.
• Sellers are gaining confidence as new listings added to the market jumped in April.
July 2013's Monthly Indicators report - Boston Real Estate Market TrendsUnit Realty Group
Here's July 2013's Monthly Indicators report from the Greater Boston Association of Realtors.
What's going on in the Boston real estate market?
• July volume of closed sales (all property types) UP +17.2% over July, 2012
• July single-family market median sales price UP 4.5% over July, 2012
• July condo market median sales price UP 4% over July, 2012
Charlotte region -monthly indicators - feb 2018Scott Browder
New Listings were down in the Charlotte region 1.4 percent to 4,627. Pending Sales increased 8.3 percent to 4,092.
Inventory shrank 16.4 percent to 8,035 units.
Prices moved higher as Median Sales Price was up 12.9 percent to $227,000. Months
Supply of Homes for Sale was down 23.1 percent to 2.0 months, indicating that demand increased relative to supply.
As a growing number of homebuyers, many of whom put their purchase on hold due to stricter lending guidelines, now reactivate their search, the expectation is for
renewed growth in home sales in the second half of 2013,"
Discover Yeni Eyup Evleri 2, nestled among the rising values of Eyupsultan, offering the epitome of modern living in Istanbul.
With its spacious living areas, contemporary architecture, and meticulous details, Yeni Eyup Evleri 2 is poised to be the star of your happiest moments. Situated in the new favorite district of Eyupsultan, claim your spot and unlock the doors to a peaceful life alongside your loved ones. Nestled next to the historical and natural beauties of Eyupsultan, embrace the comfort of modern living and rediscover life.
Social Amenities:
Yeni Eyup 2 offers a life filled with joy with its green landscaping areas, gym, sauna, children’s play areas, café, outdoor pool, and basketball court. Reserve your place for unforgettable moments!
Reliable Structure:
With 1+1, 2+1, and 3+1 apartment options, Yeni Eyup Evleri 2 is designed with first-class materials and craftsmanship. The doors to a safe and comfortable life are here! Choose the option that suits you best and step into your dream home.
Project:
Yeni Eyup 2 is conveniently located, with Istanbul Airport just 26 minutes away, the Mecidiyeköy Metro Line 4 minutes away, and the Tram Stop 5 minutes away, making your life easier with its central location.
Location:
Your home is positioned in a privileged location, providing easy access to the city center, shopping malls, restaurants, schools, and other important places.
Yeni Eyup 2 offers 1+1, 2+1, and 3+1 apartment options designed to meet different needs. Find an option suitable for every lifestyle and open the doors to a comfortable life in your dream home.
https://listingturkey.com/property/yeni-eyup-evleri-2/
The KA Housing - Catalogue - Listing TurkeyListing Turkey
Welcome to KA Housing, a distinguished real estate development nestled in the heart of Eyüpsultan, one of Istanbul’s most promising districts.
Just 10 minutes from the bustling city center, Eyüpsultan offers a serene escape with the convenience of urban living. The direct metro line ensures seamless connectivity to all parts of Istanbul, making it an ideal location for residents who seek both tranquility and vibrancy.
KA Housing boasts unparalleled accessibility, with proximity to Istanbul Airport only 30 minutes away, facilitating easy international travel. Effortless city access is guaranteed by direct metro and transportation links to Istanbul’s cultural and commercial hubs. Quick access to key metro lines connects you to every corner of the city within minutes, making commuting and exploring the city hassle-free.
The development offers luxurious living spaces with a range of unit layouts from 1+1 to 4+1, designed with meticulous attention to detail. Each unit features balconies or terraces, providing stunning vistas of Istanbul and enhancing the living experience. High-quality materials and superior craftsmanship ensure durability and elegance, while sound-proof insulation and high ceilings (2.95 m) offer comfort and sophistication.
Residents of KA Housing enjoy exclusive on-site amenities, including a state-of-the-art gym, outdoor swimming pool, yoga area, and walking paths. Entertainment options abound with a private cinema, children’s playground, and a variety of dining options including a café and restaurant. Security and convenience are paramount with 24/7 security, a dedicated carpark garage, and an IP intercom system.
KA Housing represents a prime investment opportunity with limited availability in a high-demand area, ensuring enduring value and potential for lucrative returns. Homes in this development provide exceptional value without compromising on quality, offering affordable luxury for discerning buyers. The construction is of the highest quality, built to the latest seismic and disaster resistance standards, ensuring safety and resilience.
The community and surroundings of KA Housing are enriched by close proximity to prestigious universities such as Haliç University, Bilgi University, and Istanbul Ticaret University, making it an ideal location for students and academics. The development is adjacent to the Alibeyköy stream leading into the Halic waters, offering serene natural escapes amidst lush greenery. Residents can enjoy the cultural richness of the area, surrounded by historical and cultural landmarks that blend leisure, nature, and culture seamlessly.
https://listingturkey.com/property/the-ka-housing/
Serviced Apartment Ho Chi Minh For RentalGVRenting
GVRenting is the leading rental real estate company in Vietnam. We help you to find a serviced apartment for rent in Ho Chi Minh & Saigon. Discover our broad range of rental properties in Vietnam.
For more details https://gvrenting.com/
The SVN® organization shares a portion of their new weekly listings via their SVN Live® Weekly Property Broadcast. Visit https://svn.com/svn-live/ if you would like to attend our weekly call, which we open up to the brokerage community.
Keep Your Home Naturally Cool and Warm Out Change in Seasons
Vinra Construction is a private limited company registered under the ROC. The management has an experience of over 15 years of understanding the needs and delivering apt solutions to the end users We are providing turnkey solutions in construction fields. like Construction, Interior Designing Facility Management, Plantation Management, etc..
Vinra Construction Tech Enabled Company for Eco-Friendly Home Construction
Contact With Vinra for a Greener Future >>> Call us @ 888 4898 765
Sense Levent Kagithane Catalog - Listing TurkeyListing Turkey
Sense Levent offers a luxurious living experience in the heart of Istanbul’s vibrant Levent district.
This cutting-edge development seamlessly integrates modern design with natural elements, featuring live evergreen plants maintained by an advanced irrigation system, ensuring lush greenery year-round.
The building’s elegant ceramic balconies are both stylish and durable, enhancing the overall aesthetic and functionality. Residents can enjoy the 700m Sky Lounge, which provides breathtaking views of Istanbul and a perfect space to relax and unwind.
Sense Levent promotes a healthy and active lifestyle with a full gym, swimming pool, sauna, and steam room, all available in the building. The interiors are crafted with high-quality materials, ensuring a luxurious and inviting living space.
Designed with young professionals in mind, Sense Levent features 1+1 and 2+1 units with smart floor plans and balconies. The project promises high investment returns, with an expected annual return of 6.5-7%, significantly above Istanbul’s average ROI.
Located in the rapidly growing and highly desirable Levent area, the development benefits from ongoing urban regeneration projects. Its prime location offers proximity to shopping malls, municipal buildings, universities, and public transportation, adding immense value to your investment.
Early investors can take advantage of discounted units during the construction phase, with an expected capital appreciation of +45% USD upon completion. Property Turkey provides comprehensive rental management services, ensuring a seamless and profitable investment experience.
Additionally, robust legal support and significant tax advantages are available through Property Turkey’s licensed Real Estate Investment Fund. Levent is a dynamic urban hub, ideal for young professionals with its numerous corporate headquarters and shopping malls.
Sense Levent is more than just a residence; it’s a place where dreams and opportunities come to life. Contact us today to secure your place in this exclusive development and experience the best of Istanbul living. Sense Levent: Sense the Opportunity. Live the Dream.
https://listingturkey.com/property/sense-levent/
The SVN® organization shares a portion of their new weekly listings via their SVN Live® Weekly Property Broadcast. Visit https://svn.com/svn-live/ if you would like to attend our weekly call, which we open up to the brokerage community.
Presentation to Windust Meadows HOA Board of Directors June 4, 2024: Focus o...Joseph Lewis Aguirre
Presentation to Windust Meadows HOA Board of Directors June 4, 2024: Focus on Public Safety as Job #1, Engagement, Wealth of HOA, Branding, Communication, Culture, Civic Responsibility
Recent Trends Fueling The Surge in Farmhouse Demand in IndiaFarmland Bazaar
Embarking on the journey to acquire a farmhouse for sale is just the beginning; the real investment lies in crafting an environment that contributes to our mental and physical well-being while satisfying the soul. At Farmlandbazaar.com, India’s leading online marketplace dedicated to farm land, farmhouses, and agricultural lands, we understand the importance of transforming a humble farmland into a warm and inviting sanctuary. Let's explore the fundamental aspects that can elevate your farmhouse into a tranquil haven.
Rams Garden Bahcelievler - Istanbul - ListingTurkeyListing Turkey
Implemented by Rams Global in Bahcelievler, the Rams Garden Bahcelievler Apartments includes 796 residences of different types from 2+1 to 5+1.
Next to the project, which will have 33 thousand square meters of green area, there will be 42 thousand 300 square meters of woodland. There will also be a 210-meter-long pond in the landscape of the project. There are 94.5 square meters of green space per flat.
Rams Garden Bahcelievler Apartments, which has 8 times more green space than the average of Istanbul with its 33 thousand square meters of green area located within a total of 75 thousand square meters, offers various housing options from 2+1 to 5+1.RAMS Garden has brought a lifeline to the construction industry.
Rams Global, which has signed projects in many places from Dubai to Phuket and delivered more than 20 thousand residences, is now starting new projects in Istanbul.
Rams Garden Bahcelievler is located 9 minutes from Metroport AVM, 5 minutes from Marmara Forum AVM, 12 minutes from Kazlıçeşme beach, 9 minutes from Yıldız Technical University, 7 minutes from Istinye University, 9 minutes from Ramada Hotel and Medicana Hospital.
https://listingturkey.com/property/rams-garden-bahcelievler-apartments/
Simpolo Tiles & Bathware
Tile ho,
toh Simpolo.
Since the first steps were taken in 1977, Simpolo Ceramics has carved its niche as a consistently growing organisation with unparalleled innovation and passion rooted in simplicity.
We endure gratification for every experience we offer, created to share something meaningful. It may not resonate with the majority, but that makes us a class apart. If only a handful were to understand the purpose of our existence, we would be proud to have found our believers. Rather, people with whom we can share our beliefs.
VISUALIZER
Design your space in your style with our very own Visualizer. Now, you can choose the tiles of your liking from our wide selection and see how they would look in a space. Select the tile from the multiple options and the visualiser will replace the surfaces in the image with the selected tiles. This way, instead of just your imagination, you can choose the tiles for your place by getting an actual picture of how they would look in a space. So, design your space the way you desire digitally and implement it in real life to get the best results!
You can also share this visualiser with others to help them design their space.
Committed to delighting customers with world-class ceramic products and services. Make Simpolo synonymous with the best quality and set new benchmarks of excellence for all stakeholders. Pursue best business practices with utmost integrity to make Simpolo an exciting organisation to work with, for vendors, channel partners, investors and employees alike.
Gain worldwide recognition in the field of ceramic building products through Research and Innovation and bring an enhanced lifestyle within reach for every household.
Total Environment Tangled Up In The Green - Residential Plots Where Nature an...JagadishKR1
Embark on a journey where lush landscapes and contemporary living converge at Total Environment's Tangled Up In The Green Residential Plots in Devanahalli, Bangalore. Surrounded by verdant expanses, these plots offer an idyllic setting for your dream home. Immerse yourself in the serenity of nature while enjoying the finest amenities and design, where every moment is a harmonious blend of luxury and tranquility.
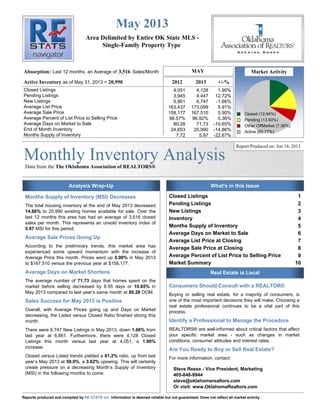
1. Monthly Inventory AnalysisData from the The Oklahoma Association of REALTORS®
Area Delimited by Entire OK State MLS -
Single-Family Property Type
May 2013
Report Produced on: Jun 14, 2013
Absorption:
Active Inventory
3,516
20,990
MAY Market Activity
2012 2013 +/-%
Last 12 months, an Average of Sales/Month
as of May 31, 2013 =
Closed Listings
Pending Listings
New Listings
Average List Price
Average Sale Price
Average Percent of List Price to Selling Price
Average Days on Market to Sale
End of Month Inventory
Months Supply of Inventory
Closed Listings 1
Pending Listings 2
New Listings 3
Inventory 4
Months Supply of Inventory 5
Average Days on Market to Sale 6
Average List Price at Closing 7
Average Sale Price at Closing 8
Average Percent of List Price to Selling Price 9
Market Summary 10
4,051 4,128 1.90%
3,945 4,447 12.72%
6,861 6,747 -1.66%
163,437 173,099 5.91%
158,177 167,510 5.90%
96.57% 96.92% 0.36%
80.28 71.73 -10.65%
24,653 20,990 -14.86%
7.72 5.97 -22.67%
Analysis Wrap-Up What's in this Issue
Real Estate is Local
Closed (12.94%)
Pending (13.93%)
Other OffMarket (7.36%)
Active (65.77%)
Months Supply of Inventory (MSI) Decreases
The total housing inventory at the end of May 2013 decreased
14.86% to 20,990 existing homes available for sale. Over the
last 12 months this area has had an average of 3,516 closed
sales per month. This represents an unsold inventory index of
5.97 MSI for this period.
Average Sale Prices Going Up
According to the preliminary trends, this market area has
experienced some upward momentum with the increase of
Average Price this month. Prices went up 5.90% in May 2013
to $167,510 versus the previous year at $158,177.
Average Days on Market Shortens
The average number of 71.73 days that homes spent on the
market before selling decreased by 8.55 days or 10.65% in
May 2013 compared to last year’s same month at 80.28 DOM.
Sales Success for May 2013 is Positive
Overall, with Average Prices going up and Days on Market
decreasing, the Listed versus Closed Ratio finished strong this
month.
There were 6,747 New Listings in May 2013, down 1.66% from
last year at 6,861. Furthermore, there were 4,128 Closed
Listings this month versus last year at 4,051, a 1.90%
increase.
Closed versus Listed trends yielded a 61.2% ratio, up from last
year’s May 2013 at 59.0%, a 3.62% upswing. This will certainly
create pressure on a decreasing Month’s Supply of Inventory
(MSI) in the following months to come.
Consumers Should Consult with a REALTOR®
Buying or selling real estate, for a majority of consumers, is
one of the most important decisions they will make. Choosing a
real estate professional continues to be a vital part of this
process.
Identify a Professional to Manage the Procedure
REALTORS® are well-informed about critical factors that affect
your specific market area - such as changes in market
conditions, consumer attitudes and interest rates.
Are You Ready to Buy or Sell Real Estate?
For more information, contact:
Steve Reese - Vice President, Marketing
405-848-9944
steve@oklahomarealtors.com
Or visit: www.OklahomaRealtors.com
Reports produced and compiled by Information is deemed reliable but not guaranteed. Does not reflect all market activity.RE STATS Inc.
2. Monthly Inventory Analysis
The Oklahoma Association of
REALTORS®
May 2013
ClosedListings
Closed Listings
ReadytoBuyorSellRealEstate?
ContactanexperiencedREALTOR
Data from the
Area Delimited by Entire OK State MLS - Single-Family Property Type
Closed Sales as of Jun 12, 2013
Report Produced on: Jun 14, 2013
MAY YEAR TO DATE (YTD)
5 YEAR MARKET ACTIVITY TRENDS 5yr MAY AVG = 3,808 3 MONTHS
CLOSED LISTINGS & BEDROOMS DISTRIBUTION BY PRICE
High
Low
Aug 2012 = 4,158
Jan 2010 = 1,728
Closed Listingsthis
month at
above the 5 yr MAY
average of
4,128,
3,808
M
A
R
A
P
R
M
A
Y
Distribution of Closed Listings by Price Range % AVDOM 2 Beds 3 Beds 4 Beds 5 Beds+
2009
3,474
2010
3,968
2011
3,417
2012
4,051
2013
4,128
1 Year
2 Year
+1.90%
+20.81%
2009
13,921
2010
15,124
2011
13,605
2012
16,130
2013
16,969
1 Year
2 Year
+5.20%
+24.73%
3,672
3,941
7.33%
4,128
4.74%
404 9.79% 73.3 178 208 16 2
$50,000
and less
358 8.67% 79.8 99 222 34 3
$50,001
$75,000
433 10.49% 81.0 116 275 40 2
$75,001
$100,000
1,063 25.75% 67.6 168 761 130 4
$100,001
$150,000
768 18.60% 69.8 96 463 202 7
$150,001
$200,000
589 14.27% 67.0 67 244 258 20
$200,001
$275,000
513 12.43% 73.8 47 122 288 56
$275,001
and up
5,000
4,000
3,000
2,000
1,000
0
Jun 2009 Dec 2009 Jun 2010 Dec 2010 Jun 2011 Dec 2011 Jun 2012 Dec 2012
Total Closed Units:
Total Closed Volume:
Average Closed Price:
4,128
691,480,012
$167,510
71.7 771
92.02M
$119,350
2295
324.41M
$141,356
968
233.32M
$241,037
94
41.73M
$443,890
pp. 1Reports produced and compiled by Information is deemed reliable but not guaranteed. Does not reflect all market activity.RE STATS Inc.
Steve Reese 405-848-9944 steve@oklahomarealtors.com
3. Monthly Inventory Analysis
The Oklahoma Association of
REALTORS®
May 2013
PendingListings
Pending Listings
ReadytoBuyorSellRealEstate?
ContactanexperiencedREALTOR
Data from the
Area Delimited by Entire OK State MLS - Single-Family Property Type
Pending Listings as of Jun 12, 2013
Report Produced on: Jun 14, 2013
MAY YEAR TO DATE (YTD)
5 YEAR MARKET ACTIVITY TRENDS 5yr MAY AVG = 3,559 3 MONTHS
PENDING LISTINGS & BEDROOMS DISTRIBUTION BY PRICE
High
Low
Apr 2010 = 4,963
Dec 2009 = 2,048
Pending Listingsthis
month at
above the 5 yr MAY
average of
4,447,
3,559
M
A
R
A
P
R
M
A
Y
Distribution of Pending Listings by Price Range % AVDOM 2 Beds 3 Beds 4 Beds 5 Beds+
2009
3,735
2010
2,418
2011
3,251
2012
3,945
2013
4,447
1 Year
2 Year
+12.72%
+36.79%
2009
16,290
2010
16,966
2011
15,242
2012
18,388
2013
20,182
1 Year
2 Year
+9.76%
+32.41%
4,104
4,463
8.75%
4,447
-0.36%
416 9.35% 63.8 186 203 25 2
$50,000
and less
330 7.42% 70.8 102 200 22 6
$50,001
$75,000
481 10.82% 73.5 125 314 38 4
$75,001
$100,000
1,132 25.46% 60.5 219 792 114 7
$100,001
$150,000
884 19.88% 65.3 123 534 216 11
$150,001
$200,000
652 14.66% 69.1 88 260 291 13
$200,001
$275,000
552 12.41% 68.7 48 130 296 78
$275,001
and up
5,000
4,000
3,000
2,000
1,000
0
Jun 2009 Dec 2009 Jun 2010 Dec 2010 Jun 2011 Dec 2011 Jun 2012 Dec 2012
Total Pending Units:
Total Pending Volume:
Average Listing Price:
4,447
770,866,672
$179,149
71.1 891
111.09M
$124,685
2433
354.19M
$145,576
1002
250.41M
$249,910
121
55.18M
$455,999
pp. 2Reports produced and compiled by Information is deemed reliable but not guaranteed. Does not reflect all market activity.RE STATS Inc.
Steve Reese 405-848-9944 steve@oklahomarealtors.com
4. Monthly Inventory Analysis
The Oklahoma Association of
REALTORS®
May 2013
NewListings
New Listings
ReadytoBuyorSellRealEstate?
ContactanexperiencedREALTOR
Data from the
Area Delimited by Entire OK State MLS - Single-Family Property Type
New Listings as of Jun 12, 2013
Report Produced on: Jun 14, 2013
MAY YEAR TO DATE (YTD)
5 YEAR MARKET ACTIVITY TRENDS 5yr MAY AVG = 6,197 3 MONTHS
NEW LISTINGS & BEDROOMS DISTRIBUTION BY PRICE
High
Low
Apr 2010 = 7,848
Dec 2012 = 3,714
New Listings this
month at
above the 5 yr MAY
average of
6,747,
6,197
M
A
R
A
P
R
M
A
Y
Distribution of New Listings by Price Range % 2 Beds 3 Beds 4 Beds 5 Beds+
2009
5,894
2010
5,304
2011
6,180
2012
6,861
2013
6,747
1 Year
2 Year
-1.66%
+9.17%
2009
28,519
2010
31,269
2011
30,044
2012
32,604
2013
32,099
1 Year
2 Year
-1.55%
+6.84%
6,747
7,125
5.60%
6,747
-5.31%
588 8.71% 276 275 35 2
$50,000
and less
596 8.83% 213 341 38 4
$50,001
$75,000
743 11.01% 183 507 46 7
$75,001
$100,000
2,232 33.08% 355 1,543 317 17
$100,001
$175,000
957 14.18% 145 498 300 14
$175,001
$225,000
847 12.55% 94 303 391 59
$225,001
$325,000
784 11.62% 78 155 418 133
$325,001
and up
8,000
7,000
6,000
5,000
4,000
3,000
2,000
1,000
0
Jun 2009 Dec 2009 Jun 2010 Dec 2010 Jun 2011 Dec 2011 Jun 2012 Dec 2012
Total New Listed Units:
Total New Listed Volume:
Average New Listed Listing Price:
6,747
1,283,653,864
$210,002
1344
185.02M
$137,667
3622
545.07M
$150,490
1545
436.03M
$282,223
236
117.52M
$497,968
pp. 3Reports produced and compiled by Information is deemed reliable but not guaranteed. Does not reflect all market activity.RE STATS Inc.
Steve Reese 405-848-9944 steve@oklahomarealtors.com
5. Monthly Inventory Analysis
The Oklahoma Association of
REALTORS®
May 2013
ActiveInventory
Active Inventory
ReadytoBuyorSellRealEstate?
ContactanexperiencedREALTOR
Data from the
Area Delimited by Entire OK State MLS - Single-Family Property Type
Active Inventory as of Jun 12, 2013
Report Produced on: Jun 14, 2013
END OF MAY ACTIVE DURING MAY
5 YEAR MARKET ACTIVITY TRENDS 5yr MAY AVG = 23,494 3 MONTHS
INVENTORY & BEDROOMS DISTRIBUTION BY PRICE
High
Low
Jul 2011 = 27,315
Dec 2009 = 20,264
Inventory this
month at
below the 5 yr MAY
average of
20,990,
23,494
M
A
R
A
P
R
M
A
Y
Distribution of Inventory by Price Range % AVDOM 2 Beds 3 Beds 4 Beds 5 Beds+
2009
22,102
2010
23,581
2011
26,159
2012
24,637
2013
20,990
1 Year
2 Year
-14.80%
-19.76%
2009
27,983
2010
27,966
2011
31,689
2012
30,921
2013
27,783
1 Year
2 Year
-10.15%
-12.33%
20,736
21,047
1.50%
20,990
-0.27%
1,879 8.95% 123.6 1,013 756 101 9
$50,000
and less
2,226 10.61% 119.3 850 1,205 149 22
$50,001
$75,000
2,511 11.96% 109.3 688 1,579 224 20
$75,001
$100,000
6,247 29.76% 97.9 1,215 3,941 1,009 82
$100,001
$175,000
2,661 12.68% 99.0 414 1,329 848 70
$175,001
$225,000
3,388 16.14% 104.0 514 1,106 1,489 279
$225,001
$375,000
2,078 9.90% 117.9 185 418 996 479
$375,001
and up
30,000
20,000
10,000
0
Jun 2009 Dec 2009 Jun 2010 Dec 2010 Jun 2011 Dec 2011 Jun 2012 Dec 2012
Total Active Inventory by Units:
Total Active Inventory by Volume:
Average Active Inventory Listing Price:
20,990
4,240,557,434
$202,028
106.9 4,879
671.39M
$137,608
10,334
1.62B
$156,903
4,816
1.40B
$290,762
961
547.42M
$569,636
pp. 4Reports produced and compiled by Information is deemed reliable but not guaranteed. Does not reflect all market activity.RE STATS Inc.
Steve Reese 405-848-9944 steve@oklahomarealtors.com
6. Monthly Inventory Analysis
The Oklahoma Association of
REALTORS®
May 2013
MonthsSupply
Months Supply of Inventory
ReadytoBuyorSellRealEstate?
ContactanexperiencedREALTOR
Data from the
Area Delimited by Entire OK State MLS - Single-Family Property Type
Active Inventory as of Jun 12, 2013
Report Produced on: Jun 14, 2013
MSI FOR MAY INDICATORS FOR MAY 2013
5 YEAR MARKET ACTIVITY TRENDS 5yr MAY AVG = 7.4 3 MONTHS
MONTHS SUPPLY & BEDROOMS DISTRIBUTION BY PRICE
High
Low
Jun 2011 = 9.8
Mar 2013 = 6.0
Months Supply this
month at
below the 5 yr MAY
average of
6.0,
7.4
M
A
R
A
P
R
M
A
Y
Distribution of Active Inventory by Price Range and MSI % MSI 2 Beds 3 Beds 4 Beds 5 Beds+
2009
6.9
2010
7.1
2011
9.4
2012
7.7
2013
6.0
1 Year
2 Year
-22.62%
-36.71%
Inventory
20,990
End of
Month
Active
Inventory
Closed
42,191
Closed
Last
12
Months
Absorption
3,516
Average
Closed per
Month over
12 Months
MSI
6.0
Months
Supply
of
Inventory
MSI %
16.750%
Percent
Months
Supply of
Inventory
6.0
6.0
0.49%
6.0
-0.45%
1,879 8.95% 4.3 5.4 3.5 3.5 2.4
$50,000
and less
2,792 13.30% 6.9 8.4 6.3 6.0 7.5
$50,001
$80,000
2,617 12.47% 5.8 6.5 5.5 6.1 10.7
$80,001
$110,000
5,222 24.88% 4.9 5.9 4.6 5.0 8.1
$110,001
$170,000
3,600 17.15% 6.0 7.5 6.0 5.4 7.4
$170,001
$240,000
2,724 12.98% 6.9 9.0 7.2 6.0 9.3
$240,001
$370,000
2,156 10.27% 13.0 17.8 14.1 11.2 15.0
$370,001
and up
10
9
8
7
6
5
4
3
2
1
0
Jun 2009 Dec 2009 Jun 2010 Dec 2010 Jun 2011 Dec 2011 Jun 2012 Dec 2012
MSI:
Total Active Inventory: 20,990
6.0 6.8
4,879
5.4
10,334
6.2
4,816
10.6
961
pp. 5Reports produced and compiled by Information is deemed reliable but not guaranteed. Does not reflect all market activity.RE STATS Inc.
Steve Reese 405-848-9944 steve@oklahomarealtors.com
7. Monthly Inventory Analysis
The Oklahoma Association of
REALTORS®
May 2013
AverageDaysonMarket
Average Days on Market to Sale
ReadytoBuyorSellRealEstate?
ContactanexperiencedREALTOR
Data from the
Area Delimited by Entire OK State MLS - Single-Family Property Type
Closed Sales as of Jun 12, 2013
Report Produced on: Jun 14, 2013
MAY YEAR TO DATE (YTD)
5 YEAR MARKET ACTIVITY TRENDS 5yr MAY AVG = 80 3 MONTHS
AVERAGE DOM OF CLOSED SALES & BEDROOMS DISTRIBUTION BY PRICE
High
Low
Mar 2011 = 98
May 2013 = 72
Average DOM this
month at
below the 5 yr MAY
average of
72,
80
M
A
R
A
P
R
M
A
Y
Distribution of Average Days on Market to Sale by Price Range % AVDOM 2 Beds 3 Beds 4 Beds 5 Beds+
2009
88
2010
74
2011
86
2012
80
2013
72
1 Year
2 Year
-10.65%
-16.67%
2009
90
2010
79
2011
93
2012
88
2013
80
1 Year
2 Year
-8.50%
-14.01%
83
81
-2.15%
72
-11.35%
404 9.79% 73.3 70.1 75.9 81.6 14.0
$50,000
and less
358 8.67% 79.8 93.4 71.5 92.7 95.7
$50,001
$75,000
433 10.49% 81.0 96.5 72.0 99.9 50.0
$75,001
$100,000
1,063 25.75% 67.6 89.7 60.8 76.7 133.3
$100,001
$150,000
768 18.60% 69.8 102.1 66.3 64.2 22.1
$150,001
$200,000
589 14.27% 67.0 82.8 64.6 64.8 71.4
$200,001
$275,000
513 12.43% 73.8 121.0 63.1 68.7 84.3
$275,001
and up
100
90
80
70
60
50
40
30
20
10
0
Jun 2009 Dec 2009 Jun 2010 Dec 2010 Jun 2011 Dec 2011 Jun 2012 Dec 2012
Average Closed DOM:
Total Closed Units:
Total Closed Volume:
71.7
4,128
691,480,012
89.5
771
92.02M
66.2
2295
324.41M
70.1
968
233.32M
77.2
94
41.73M
pp. 6Reports produced and compiled by Information is deemed reliable but not guaranteed. Does not reflect all market activity.RE STATS Inc.
Steve Reese 405-848-9944 steve@oklahomarealtors.com
8. Monthly Inventory Analysis
The Oklahoma Association of
REALTORS®
May 2013
AverageListPrice
Average List Price at Closing
ReadytoBuyorSellRealEstate?
ContactanexperiencedREALTOR
Data from the
Area Delimited by Entire OK State MLS - Single-Family Property Type
Closed Sales as of Jun 12, 2013
Report Produced on: Jun 14, 2013
MAY YEAR TO DATE (YTD)
5 YEAR MARKET ACTIVITY TRENDS 5yr MAY AVG = 159K 3 MONTHS
AVERAGE LIST PRICE OF CLOSED SALES & BEDROOMS DISTRIBUTION BY PRICE
High
Low
May 2013 = 173,099
Jan 2010 = 139,108
Average LPrice this
month at
above the 5 yr MAY
average of
173,099,
158,965
M
A
R
A
P
R
M
A
Y
Distribution of Average List Price at Closing by Price Range % AVL$ 2 Beds 3 Beds 4 Beds 5 Beds+
2009
147,713
2010
152,463
2011
158,113
2012
163,437
2013
173,099
1 Year
2 Year
+5.91%
+9.48%
2009
144,242
2010
146,155
2011
150,805
2012
153,781
2013
164,964
1 Year
2 Year
+7.27%
+9.39%
165,136
164,928
-0.13%
173,099
4.95%
385 9.33% 32,507 31,869 35,906 33,329 33,000
$50,000
and less
328 7.95% 64,760 66,247 67,228 70,578 70,867
$50,001
$75,000
442 10.71% 88,806 90,864 91,822 94,155 88,500
$75,001
$100,000
1,058 25.63% 128,736 131,051 130,239 134,828 131,100
$100,001
$150,000
775 18.77% 174,009 175,918 175,768 179,884 168,057
$150,001
$200,000
591 14.32% 236,160 239,327 239,003 242,298 235,210
$200,001
$275,000
549 13.30% 420,606 379,280 391,095 405,093 682,923
$275,001
and up
200,000
100,000
0
Jun 2009 Dec 2009 Jun 2010 Dec 2010 Jun 2011 Dec 2011 Jun 2012 Dec 2012
Average List Price:
Total Closed Units:
Total List Volume:
$173,099
4,128
714,551,399
$123,913
771
95.54M
$145,607
2295
334.17M
$247,668
968
239.74M
$479,833
94
45.10M
pp. 7Reports produced and compiled by Information is deemed reliable but not guaranteed. Does not reflect all market activity.RE STATS Inc.
Steve Reese 405-848-9944 steve@oklahomarealtors.com
9. Monthly Inventory Analysis
The Oklahoma Association of
REALTORS®
May 2013
AverageSoldPrice
Average Sold Price at Closing
ReadytoBuyorSellRealEstate?
ContactanexperiencedREALTOR
Data from the
Area Delimited by Entire OK State MLS - Single-Family Property Type
Closed Sales as of Jun 12, 2013
Report Produced on: Jun 14, 2013
MAY YEAR TO DATE (YTD)
5 YEAR MARKET ACTIVITY TRENDS 5yr MAY AVG = 154K 3 MONTHS
AVERAGE SOLD PRICE OF CLOSED SALES & BEDROOMS DISTRIBUTION BY PRICE
High
Low
May 2013 = 167,510
Jan 2010 = 133,466
Average SPrice this
month at
above the 5 yr MAY
average of
167,510,
153,621
M
A
R
A
P
R
M
A
Y
Distribution of Average Sold Price at Closing by Price Range % AVS$ 2 Beds 3 Beds 4 Beds 5 Beds+
2009
142,786
2010
147,438
2011
152,195
2012
158,177
2013
167,510
1 Year
2 Year
+5.90%
+10.06%
2009
139,009
2010
140,996
2011
144,604
2012
148,212
2013
159,544
1 Year
2 Year
+7.65%
+10.33%
160,142
159,601
-0.34%
167,510
4.96%
404 9.79% 31,282 29,123 33,118 31,652 29,500
$50,000
and less
358 8.67% 63,569 62,151 64,106 64,133 64,233
$50,001
$75,000
433 10.49% 87,840 86,423 88,435 87,798 89,000
$75,001
$100,000
1,063 25.75% 127,147 126,393 126,777 130,362 124,750
$100,001
$150,000
768 18.60% 172,826 171,097 172,016 175,758 165,471
$150,001
$200,000
589 14.27% 235,415 234,843 232,929 238,037 233,845
$200,001
$275,000
513 12.43% 412,287 367,293 377,189 393,269 624,317
$275,001
and up
200,000
100,000
0
Jun 2009 Dec 2009 Jun 2010 Dec 2010 Jun 2011 Dec 2011 Jun 2012 Dec 2012
Average Closed Price:
Total Closed Units:
Total Closed Volume:
$167,510
4,128
691,480,012
$119,350
771
92.02M
$141,356
2295
324.41M
$241,037
968
233.32M
$443,890
94
41.73M
pp. 8Reports produced and compiled by Information is deemed reliable but not guaranteed. Does not reflect all market activity.RE STATS Inc.
Steve Reese 405-848-9944 steve@oklahomarealtors.com
10. Monthly Inventory Analysis
The Oklahoma Association of
REALTORS®
May 2013
AverageList/SellPrice
Average Percent of List Price to Selling Price
ReadytoBuyorSellRealEstate?
ContactanexperiencedREALTOR
Data from the
Area Delimited by Entire OK State MLS - Single-Family Property Type
Closed Sales as of Jun 12, 2013
Report Produced on: Jun 14, 2013
MAY YEAR TO DATE (YTD)
5 YEAR MARKET ACTIVITY TRENDS 5yr MAY AVG=96.53% 3 MONTHS
AVERAGE L/S% OF CLOSED SALES & BEDROOMS DISTRIBUTION BY PRICE
High
Low
Mar 2013 = 97.20%
Jan 2011 = 95.15%
Average List/Sell this
month at
above the 5 yr MAY
average of
96.92%,
96.53%
M
A
R
A
P
R
M
A
Y
Distribution of $avgmed L/S % by Price Range % AVL/S% 2 Beds 3 Beds 4 Beds 5 Beds+
2009
96.36%
2010
96.76%
2011
96.05%
2012
96.57%
2013
96.92%
1 Year
2 Year
+0.36%
+0.90%
2009
95.87%
2010
96.41%
2011
95.63%
2012
96.01%
2013
96.69%
1 Year
2 Year
+0.71%
+1.10%
97.20%
96.64%
-0.58%
96.92%
0.28%
404 9.79% 93.57% 92.54% 94.31% 95.66% 90.74%
$50,000
and less
358 8.67% 95.56% 94.36% 96.59% 92.70% 91.11%
$50,001
$75,000
433 10.49% 96.17% 95.79% 96.59% 94.19%100.52%
$75,001
$100,000
1,063 25.75% 97.31% 96.63% 97.55% 96.83% 94.83%
$100,001
$150,000
768 18.60% 97.98% 97.43% 98.11% 97.90% 98.56%
$150,001
$200,000
589 14.27% 98.21% 98.35% 97.64% 98.33%103.22%
$200,001
$275,000
513 12.43% 97.25% 96.93% 97.06% 97.56% 96.37%
$275,001
and up
98
97
96
95
Jun 2009 Dec 2009 Jun 2010 Dec 2010 Jun 2011 Dec 2011 Jun 2012 Dec 2012
Average List/Sell Ratio:
Total Closed Units:
Total Closed Volume:
96.90%
4,128
691,480,012
95.54%
771
92.02M
97.15%
2295
324.41M
97.40%
968
233.32M
97.73%
94
41.73M
pp. 9Reports produced and compiled by Information is deemed reliable but not guaranteed. Does not reflect all market activity.RE STATS Inc.
Steve Reese 405-848-9944 steve@oklahomarealtors.com
11. Monthly Inventory Analysis
The Oklahoma Association of
REALTORS®
May 2013
Market Summary
Data from the
Area Delimited by Entire OK State MLS - Single-Family Property Type
Inventory as of Jun 12, 2013
Report Produced on: Jun 14, 2013
Inventory Inventory Market Activity Market Activity
New Listings Closed Sales
Pending Sales
Other Off Market
Active Inventory
Start Inventory
Total Inventory
Units
Volume
6,747 = 24.27%
21,051
27,798
$5,462,489,118
4,128 = 12.94%
4,447 = 13.93%
2,348 = 7.36%
20,990 = 65.77%
Absorption:
Active Inventory
3,516
20,990
MAY Year To Date
2012 2013 +/-% 2012 2013 +/-%
Last 12 months, an Average of Sales/Month
as of May 31, 2013 =
Closed Sales
Pending Sales
New Listings
Average List Price
Average Sale Price
Average Percent of List Price to Selling Price
Average Days on Market to Sale
Monthly Inventory
Months Supply of Inventory
4,051 4,128 1.90%
3,945 4,447 12.72%
6,861 6,747 -1.66%
163,437 173,099 5.91%
158,177 167,510 5.90%
96.57% 96.92% 0.36%
80.28 71.73 -10.65%
24,653 20,990 -14.86%
7.72 5.97 -22.67%
16,130 16,969 5.20%
18,388 20,182 9.76%
32,604 32,099 -1.55%
153,781 164,964 7.27%
148,212 159,544 7.65%
96.01% 96.69% 0.71%
87.83 80.36 -8.50%
24,653 20,990 -14.86%
7.72 5.97 -22.67%
New Listings Pending Listings List Price Sale Price
Active Inventory Monthly Supply of Inventory % of List to Sale Price Days on Market to Sale
2012
2013
2012
2013
2012
2013
2012
2013
MAY MARKET AVERAGE PRICES
INVENTORY AVERAGE L/S% & DOM
6,861
3,945
6,747
-1.66%
4,447
+12.72%
163,437
158,177
173,099
+5.91%
167,510
+5.90%
24,653 7.72
20,990
-14.86%
5.97
-22.67%
96.57%
80.2896.92%
+0.36%
71.73
-10.65%
pp. 10Reports produced and compiled by Information is deemed reliable but not guaranteed. Does not reflect all market activity.RE STATS Inc.
Steve Reese 405-848-9944 steve@oklahomarealtors.com