Download as PDF, PPTX

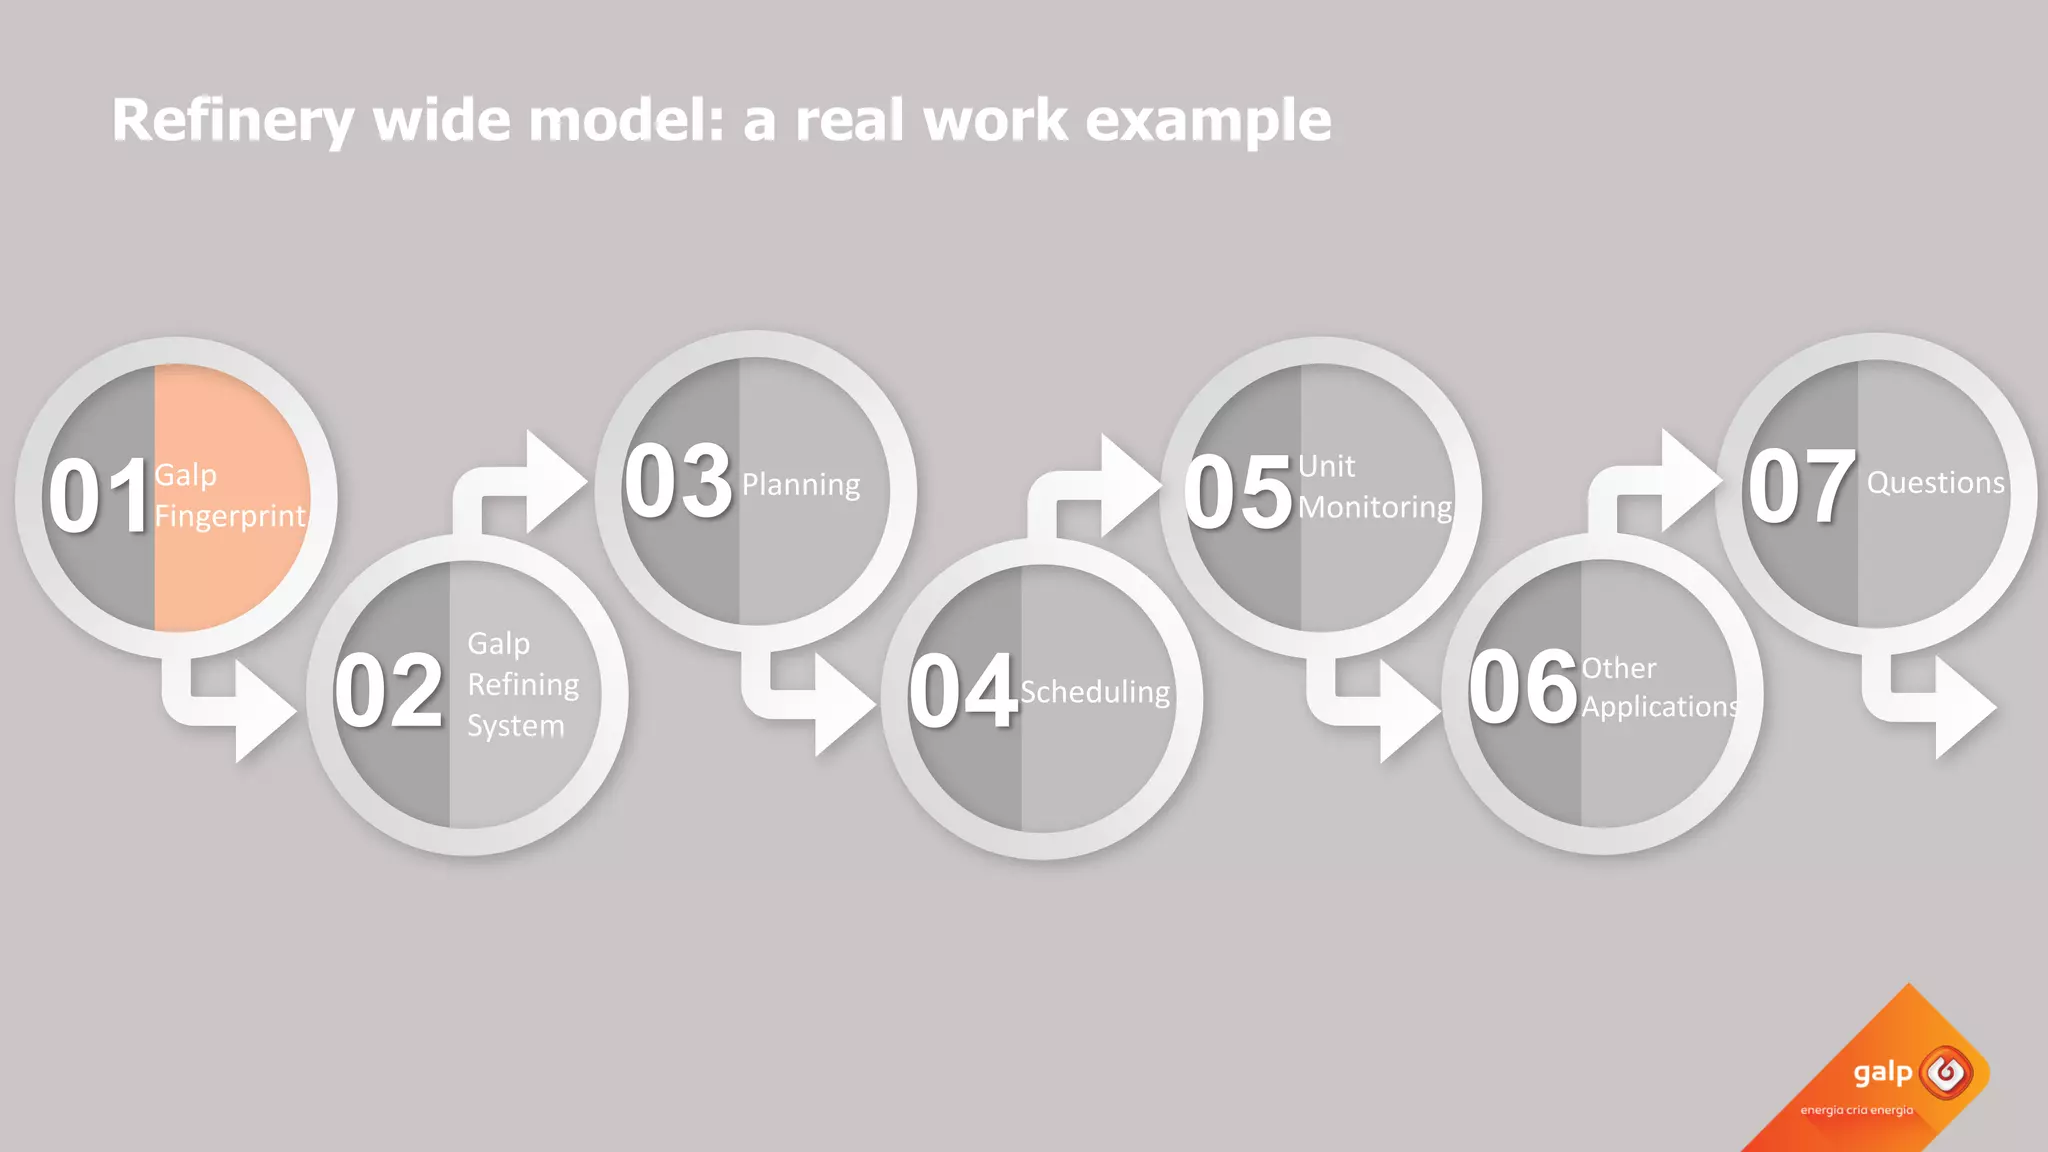
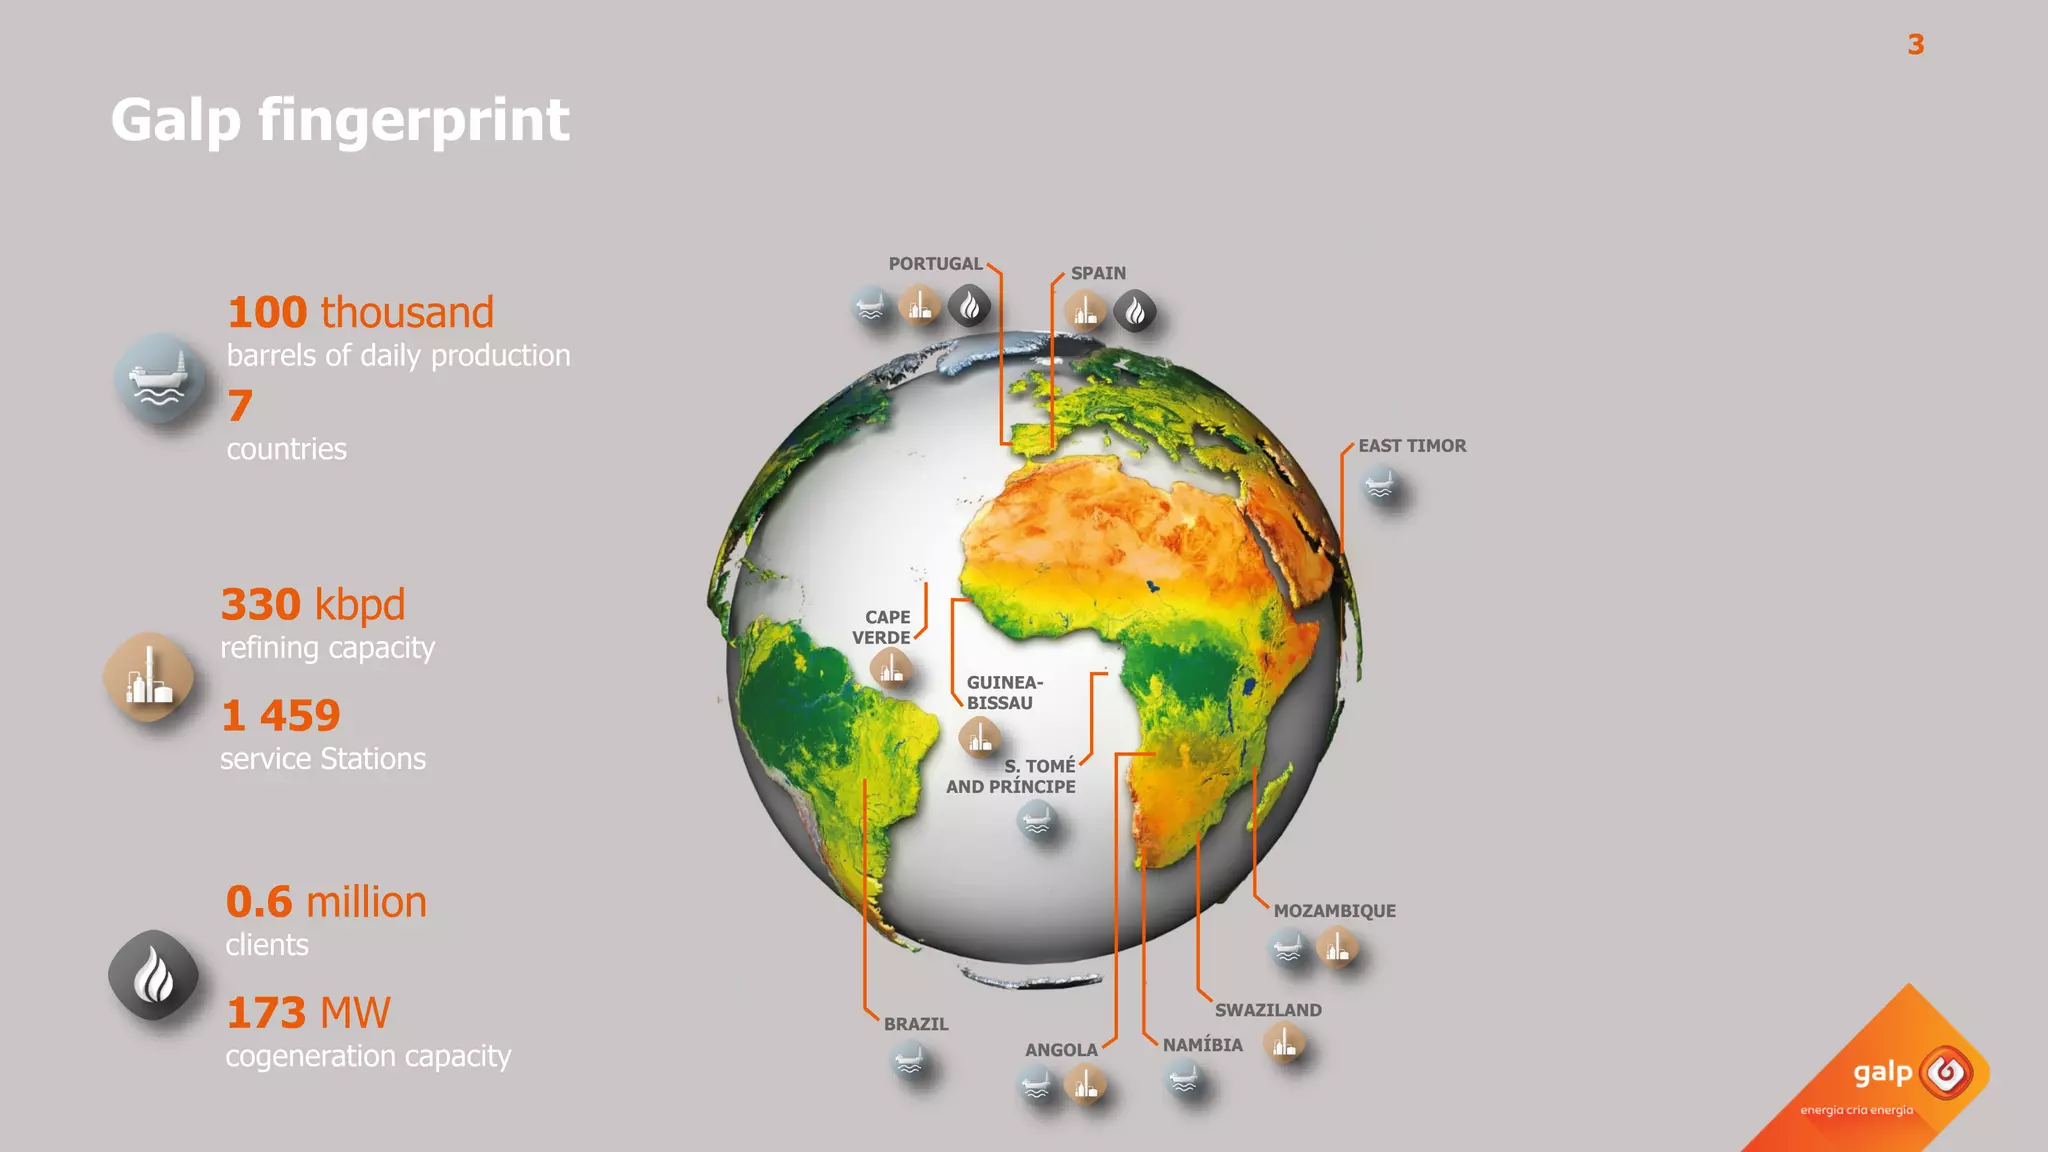
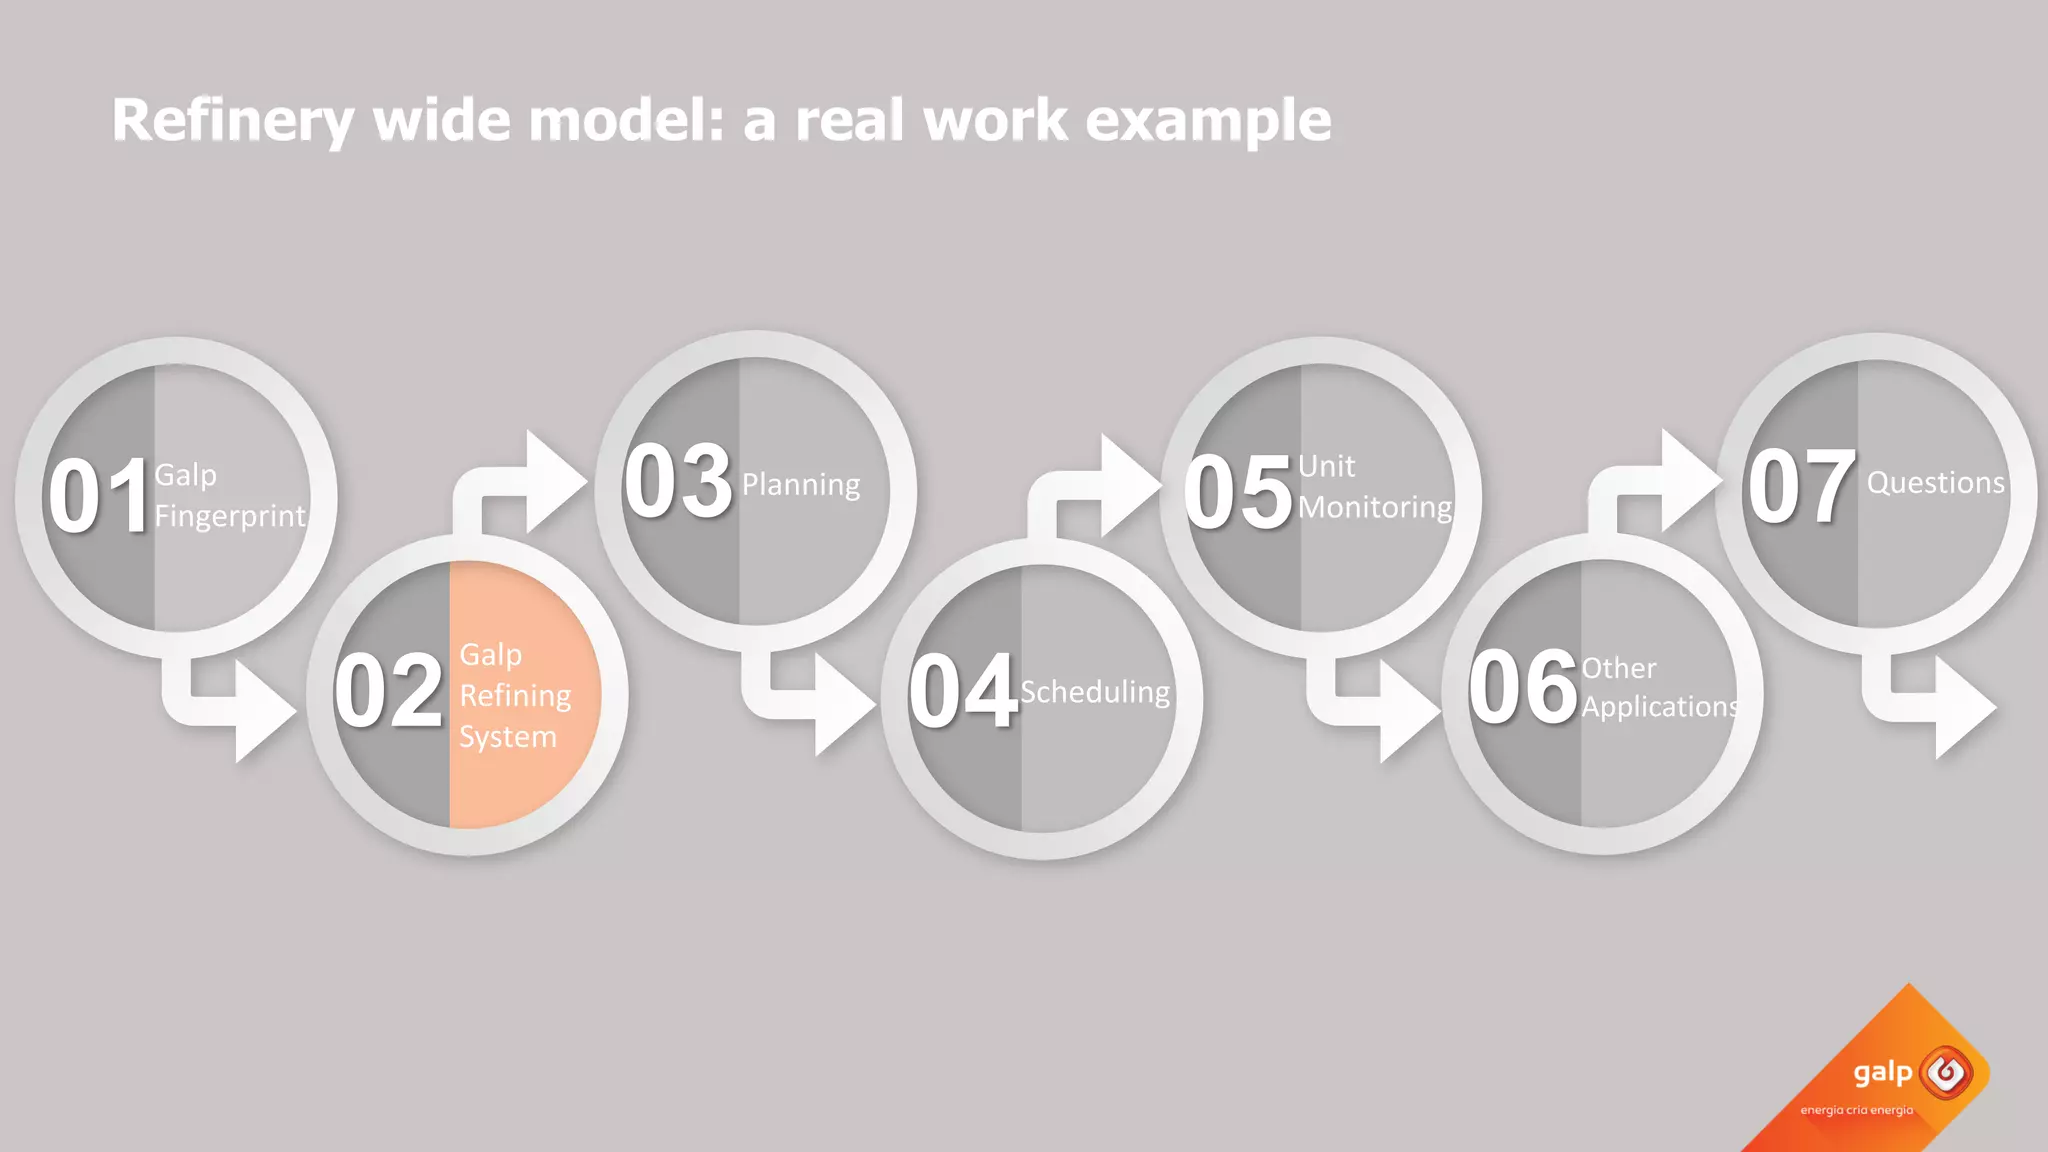
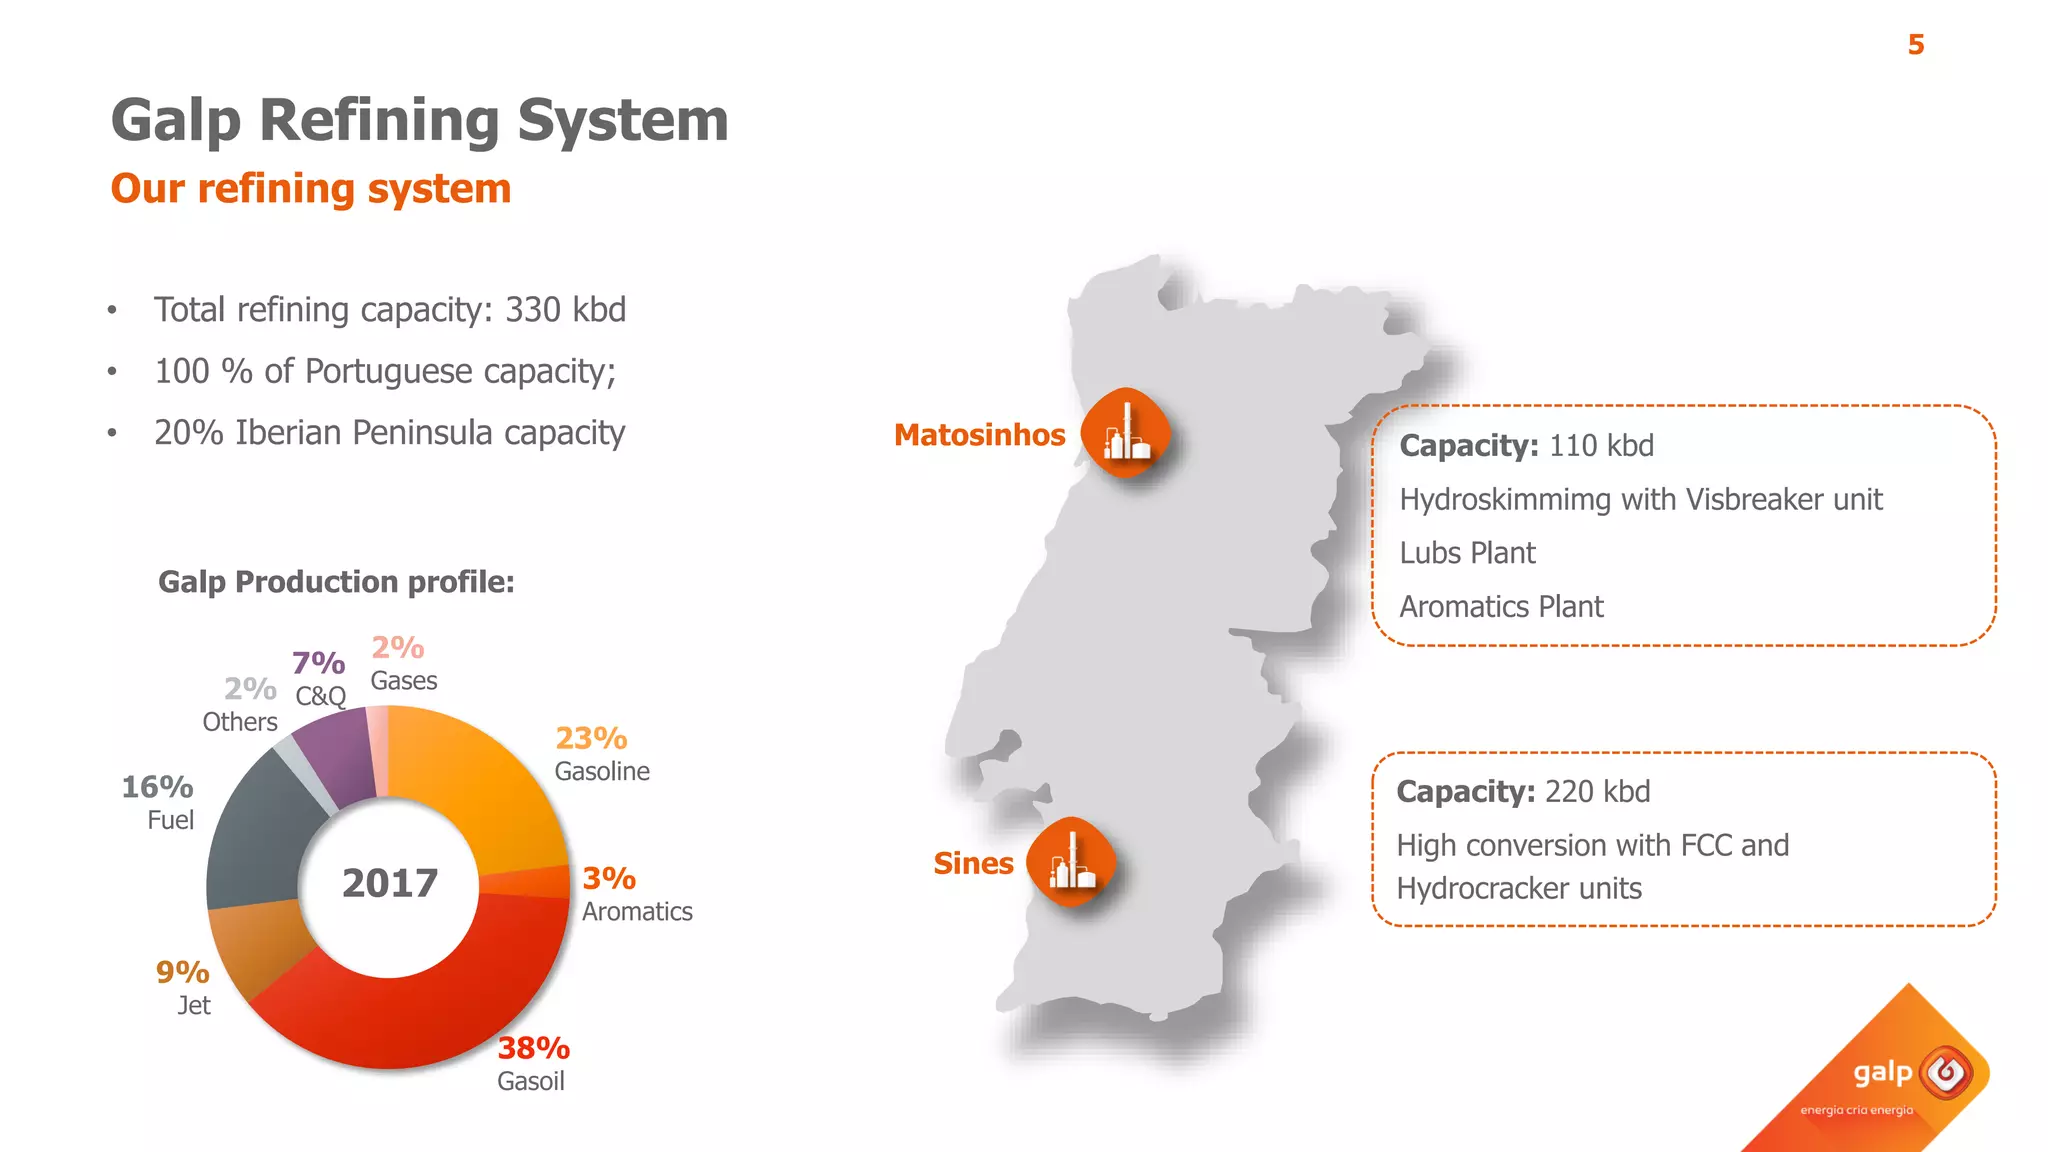
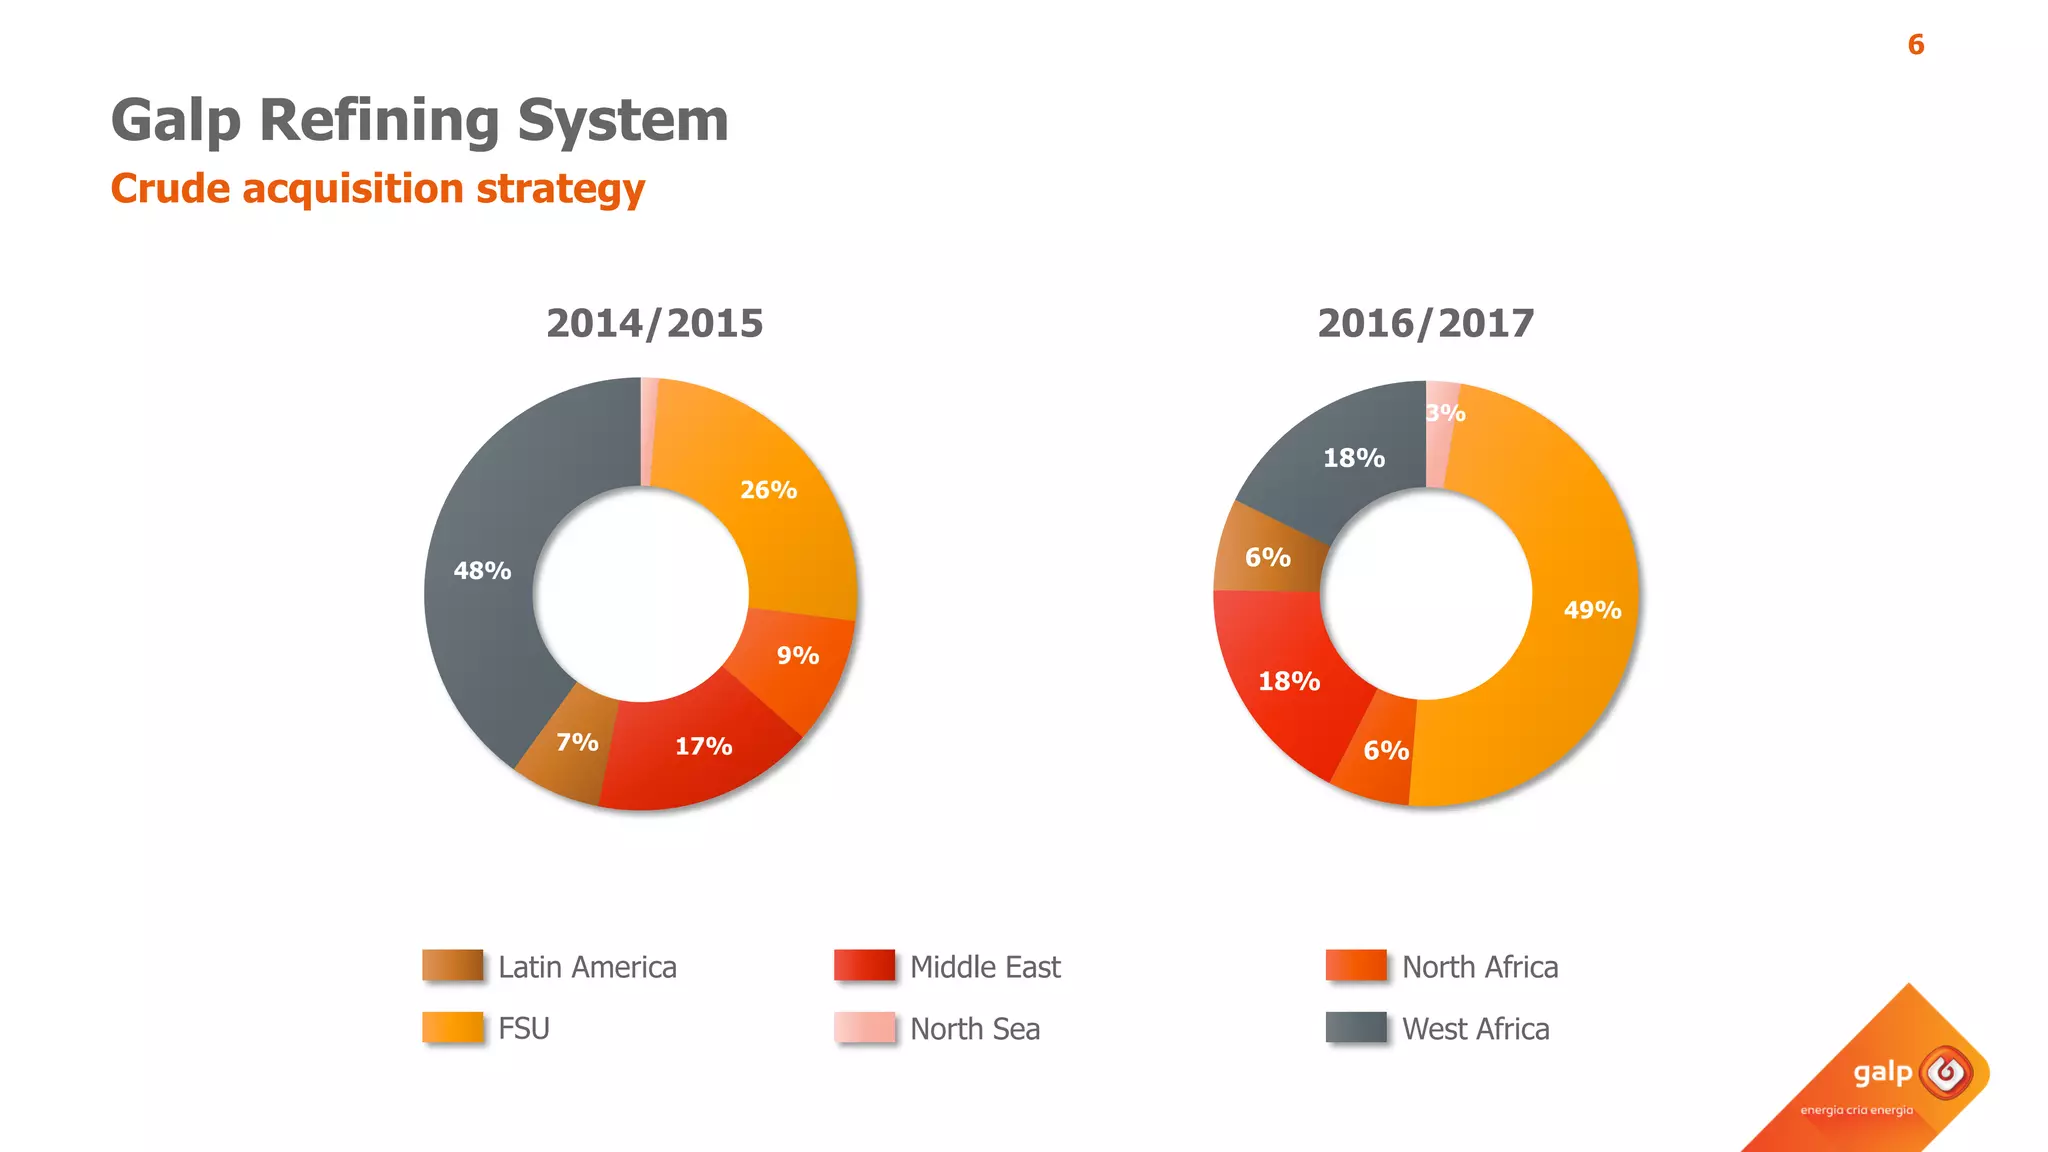
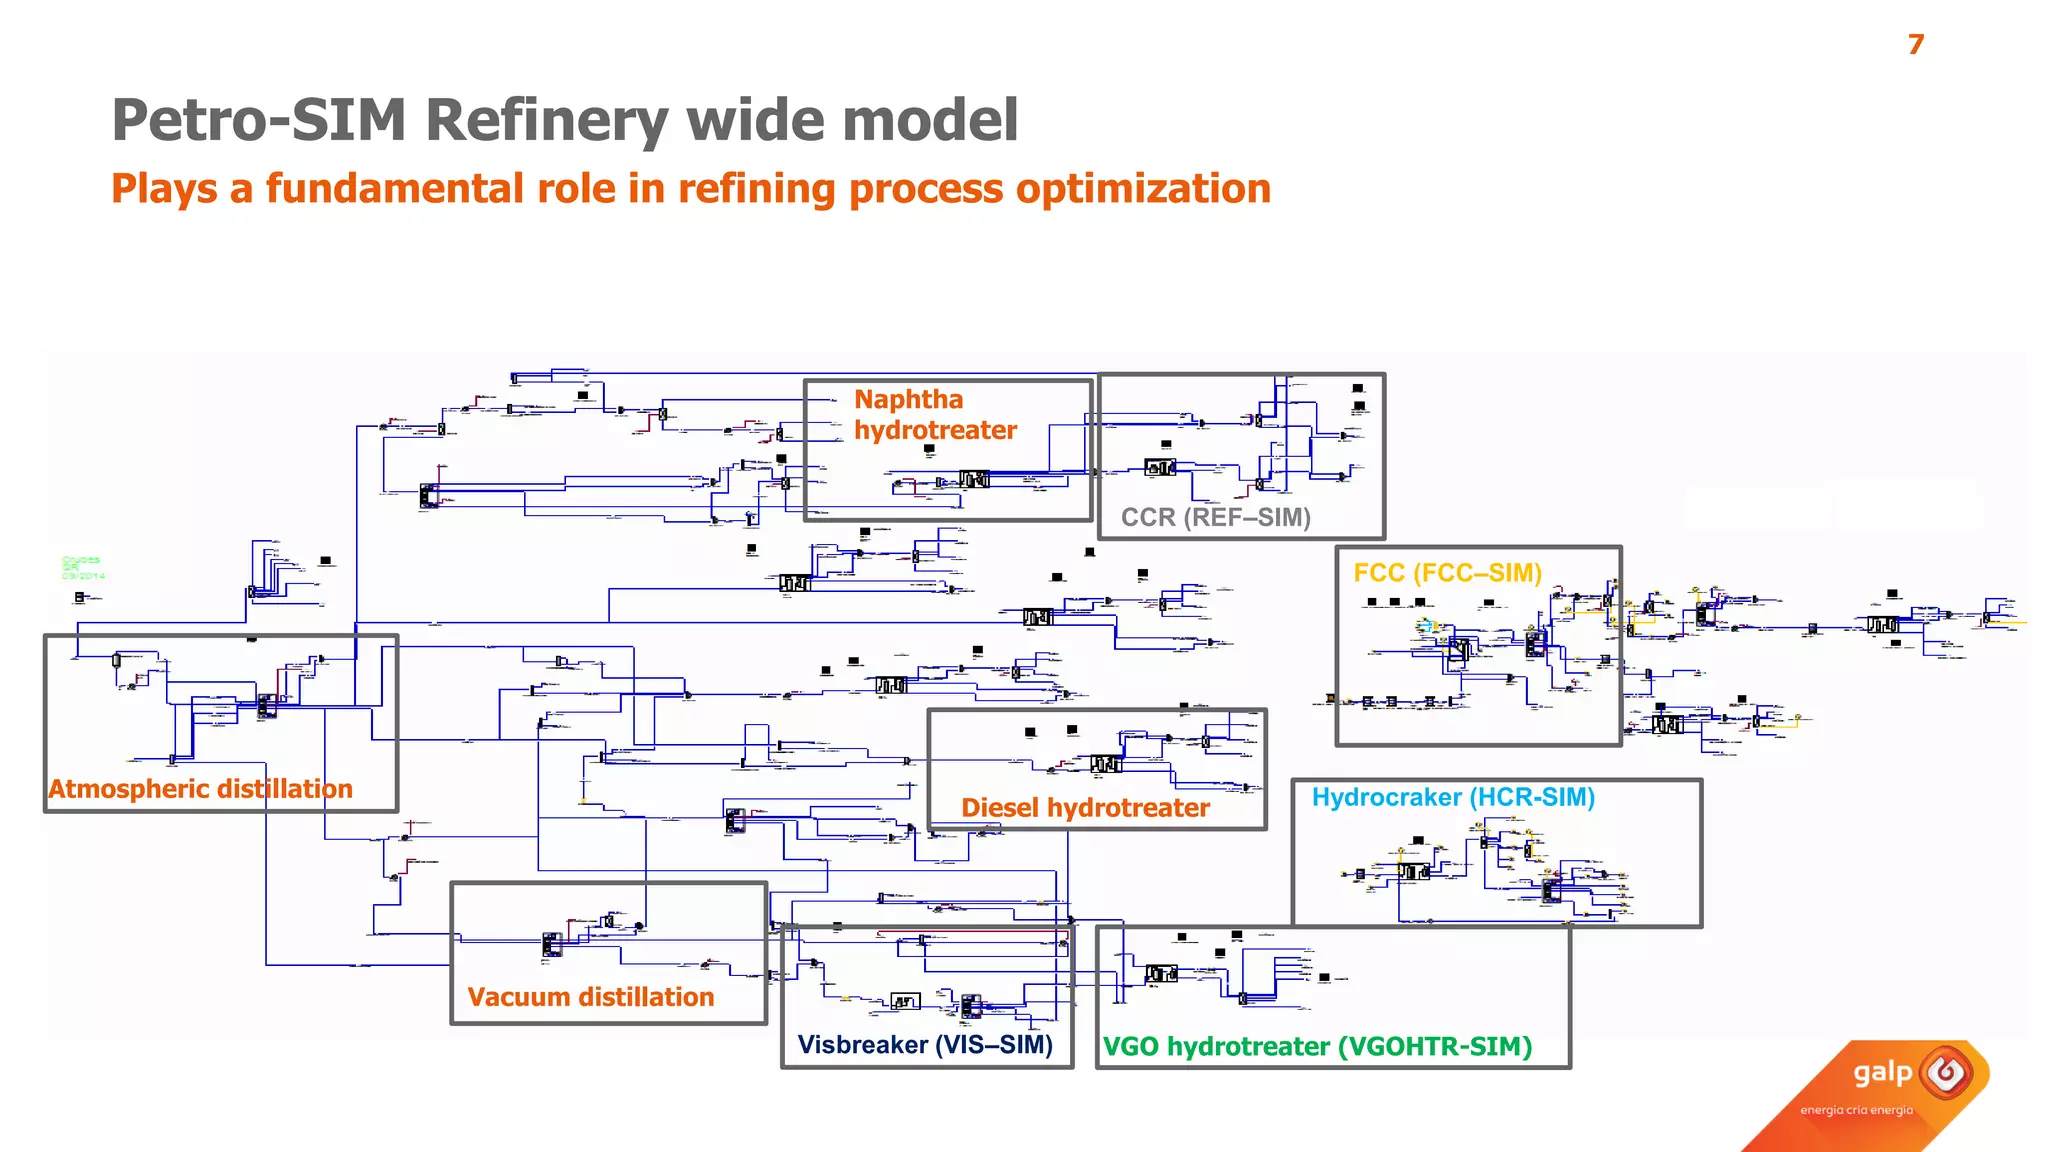
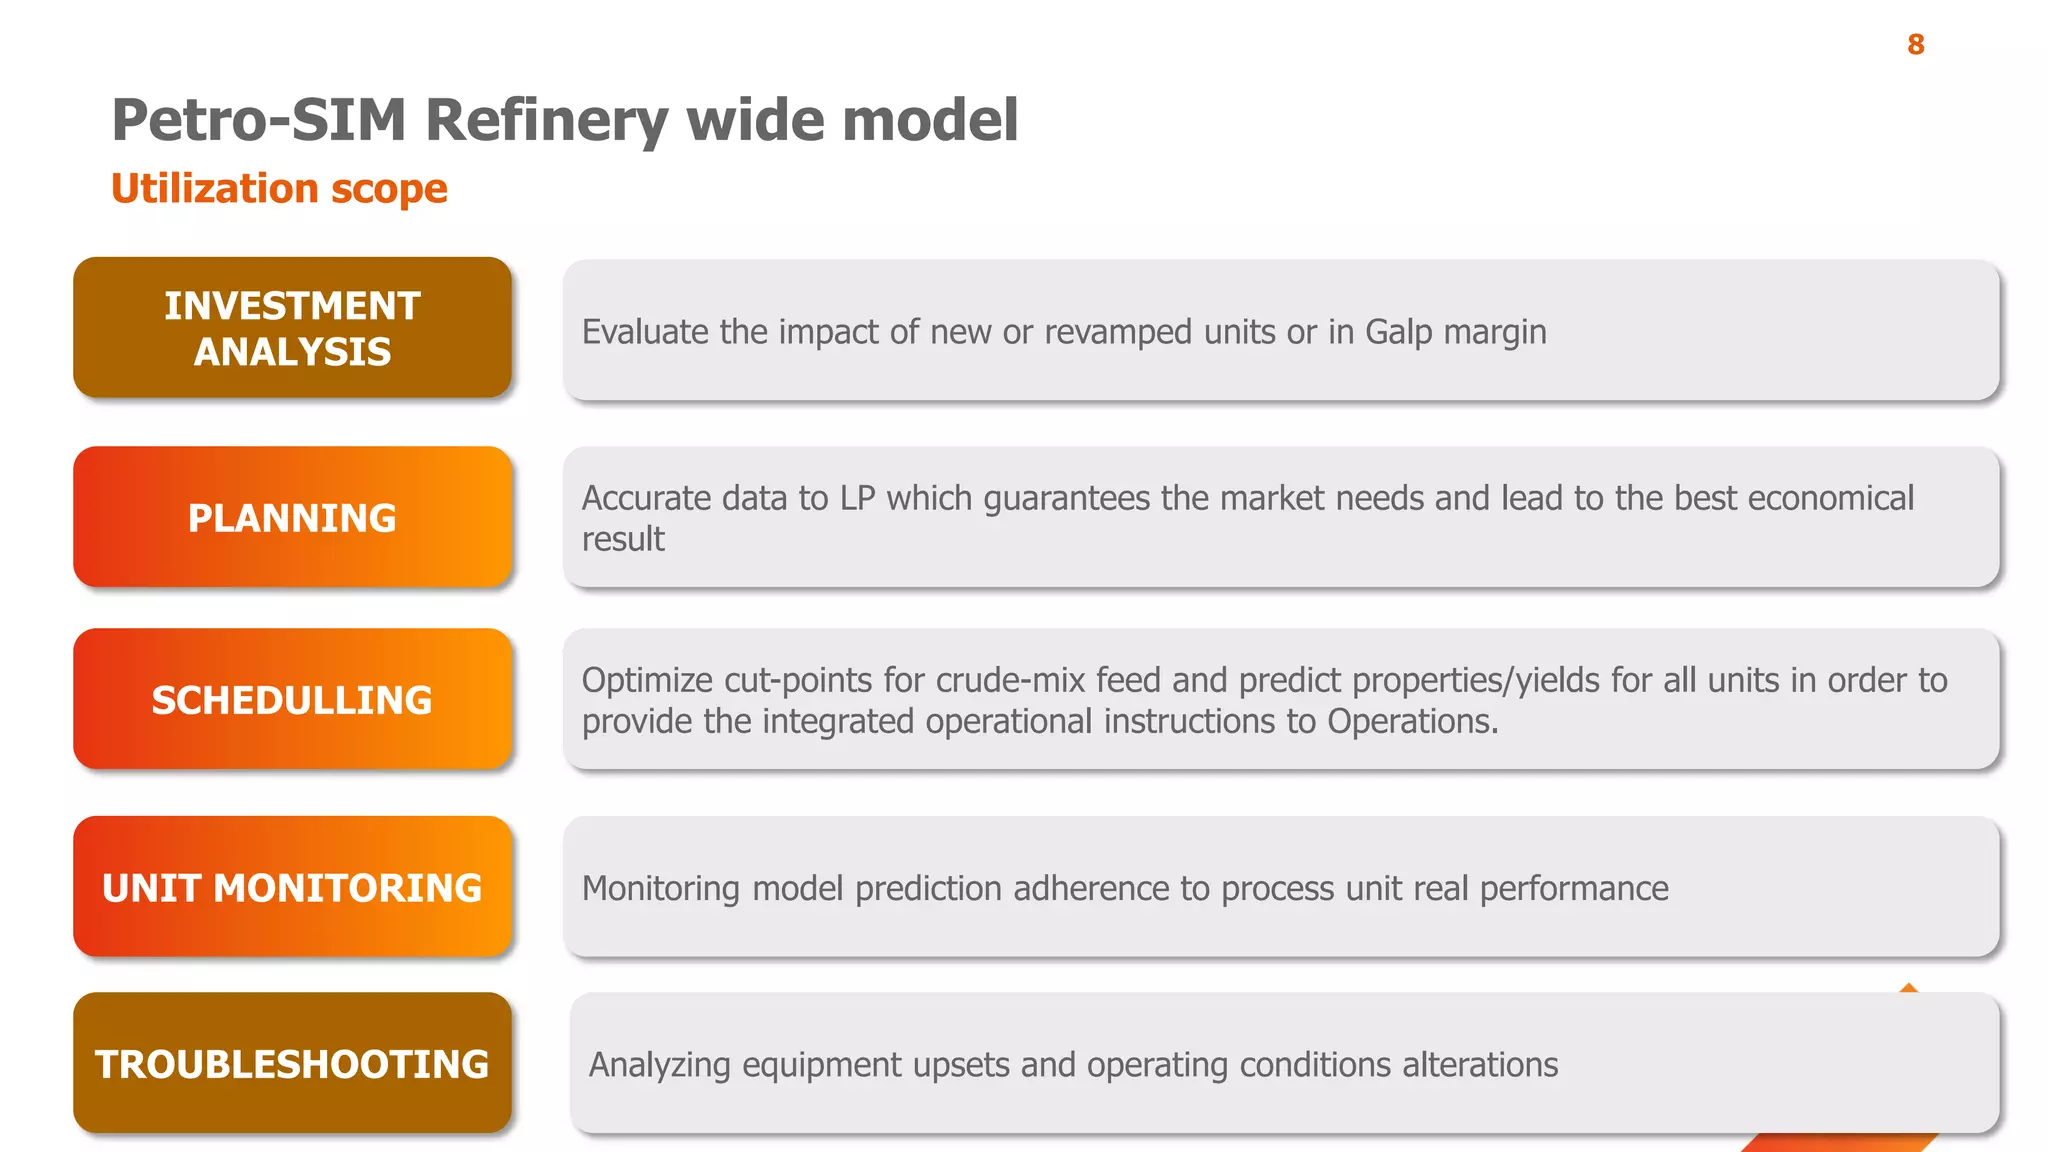
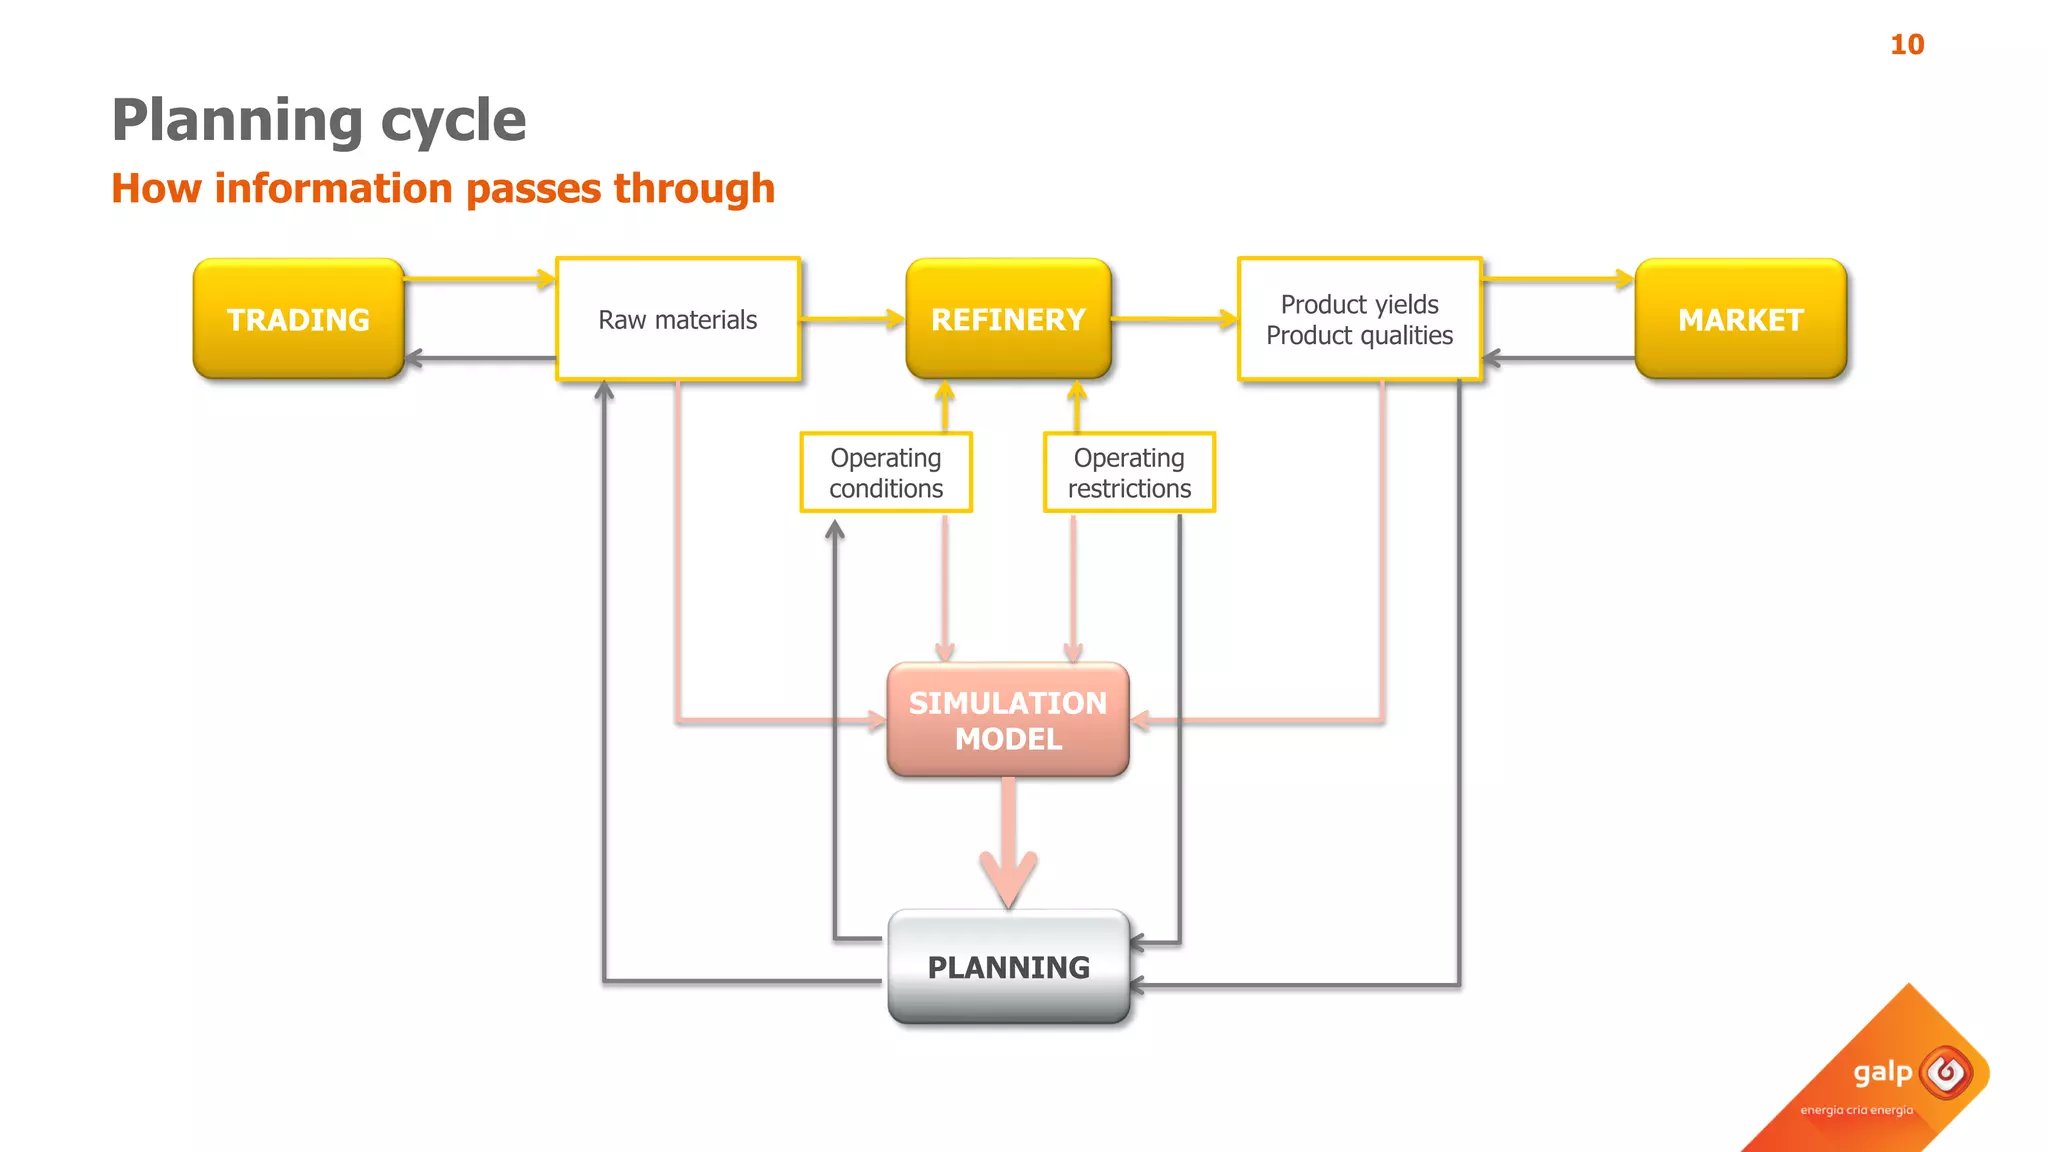
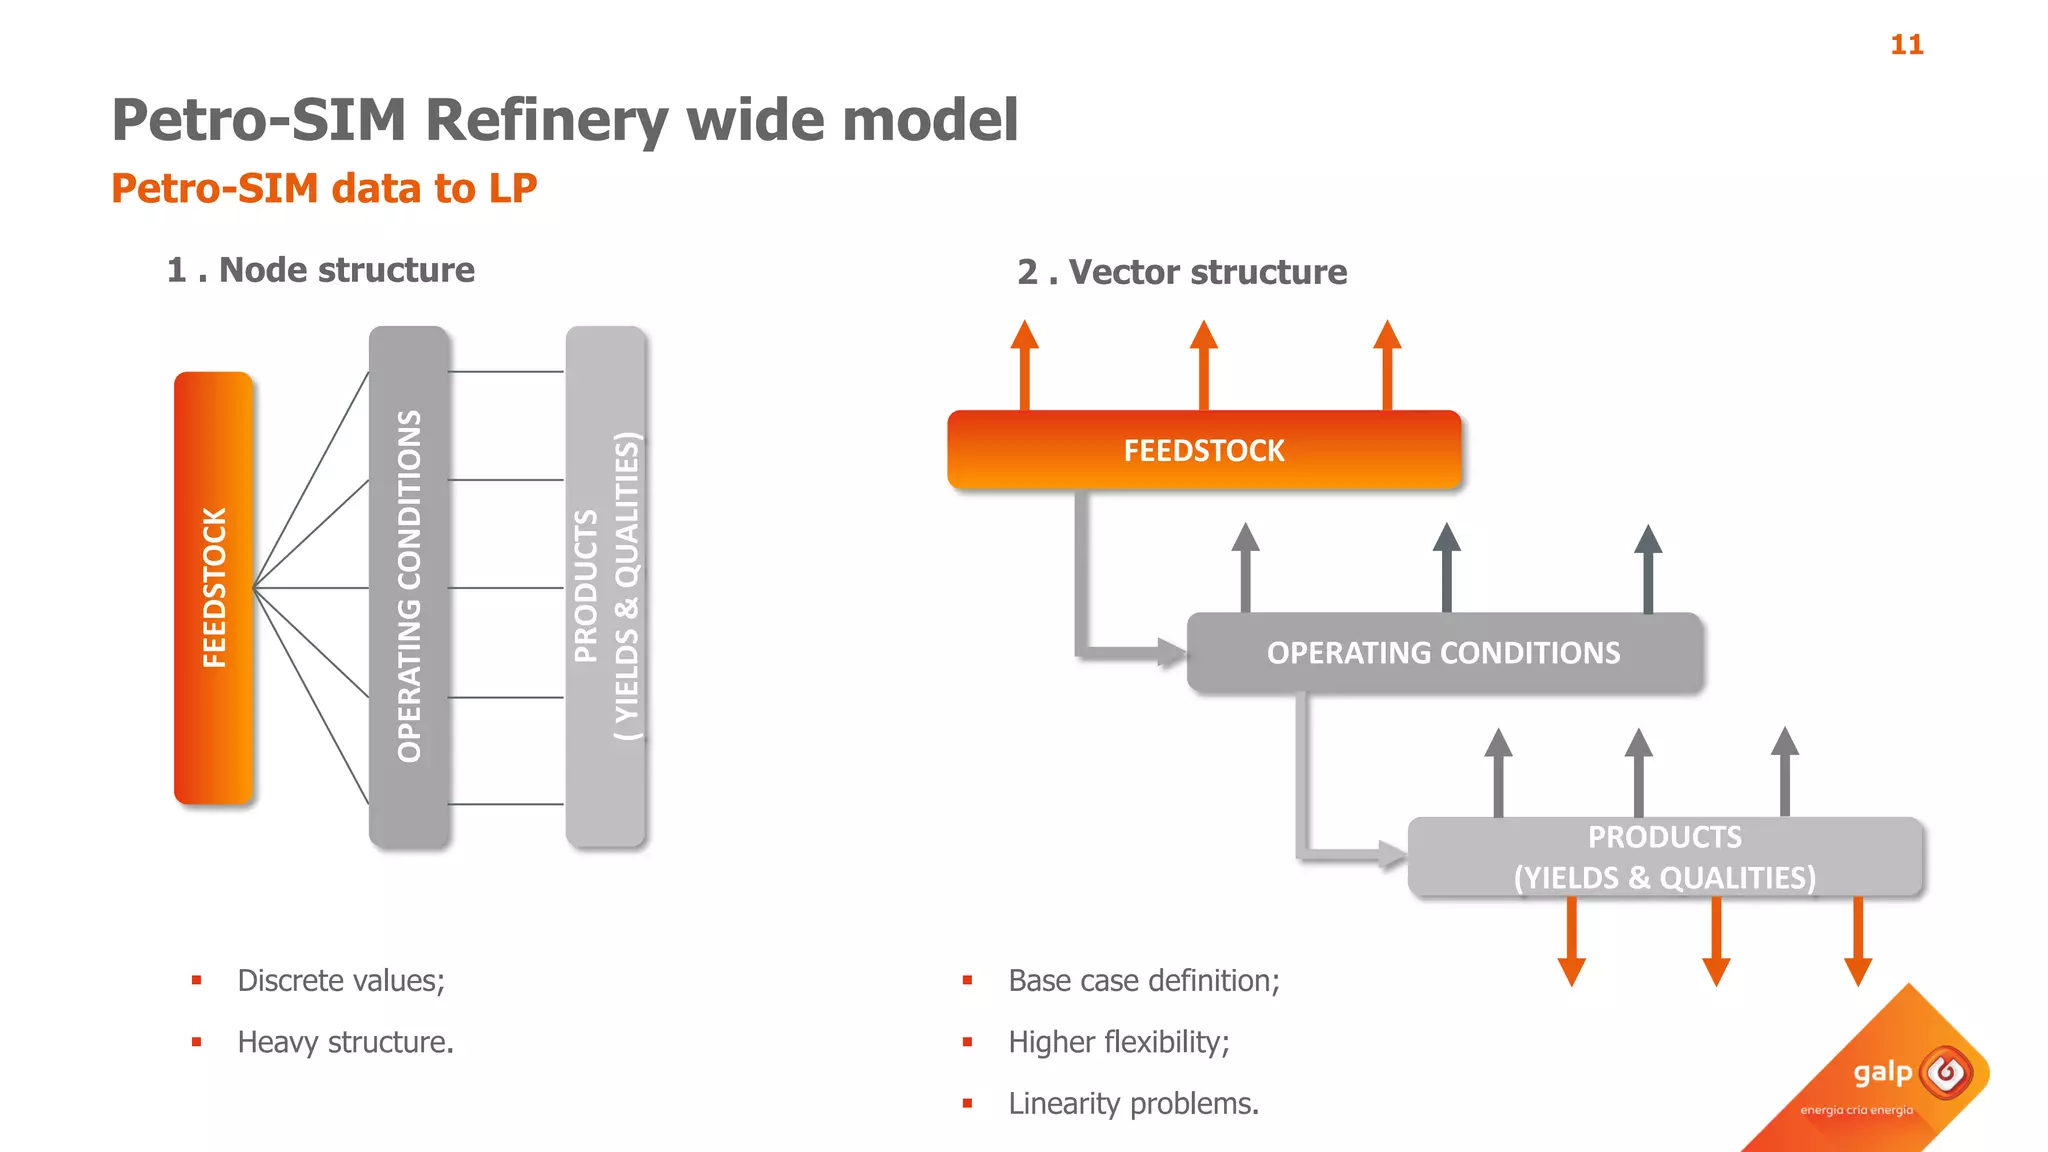
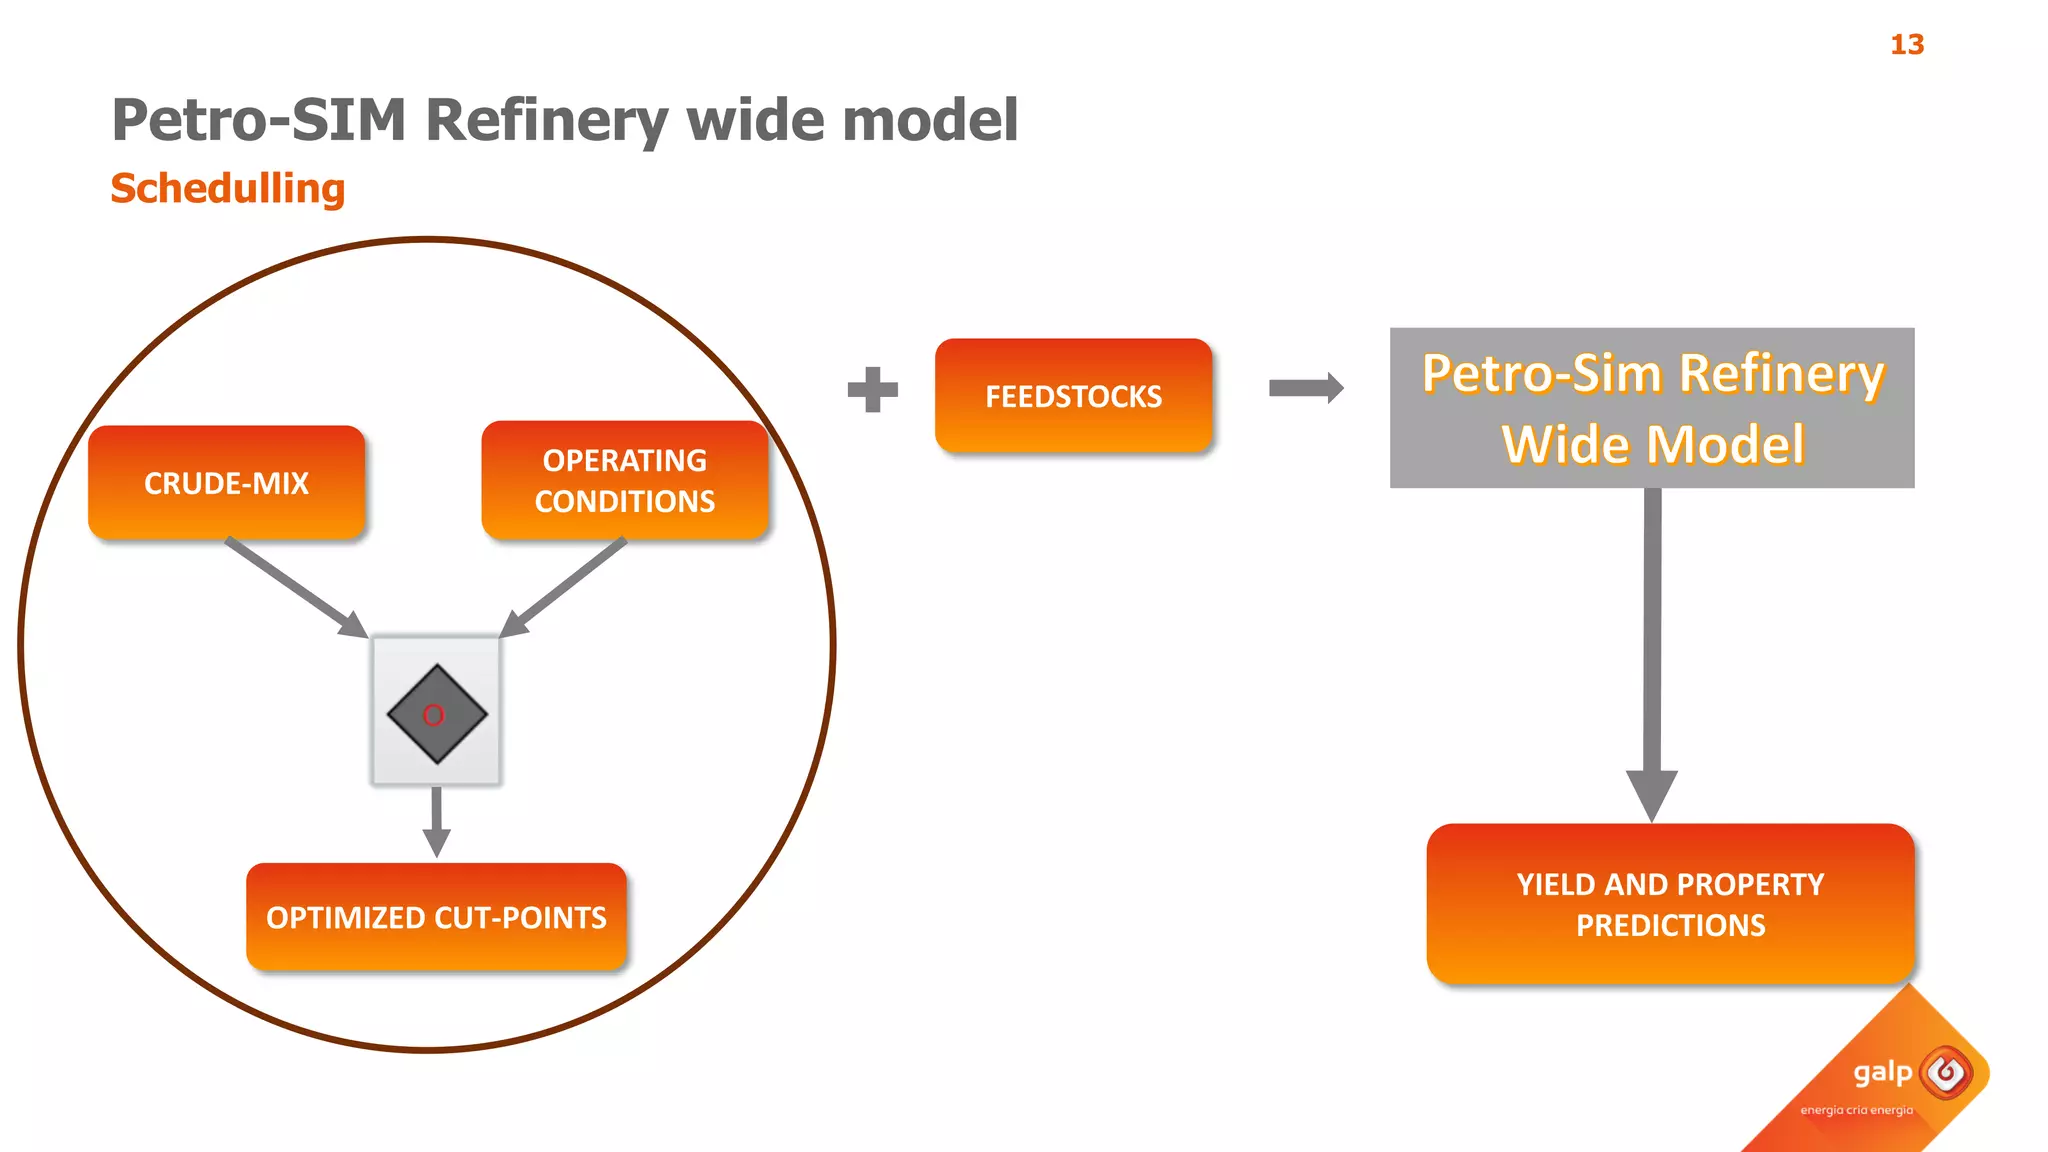
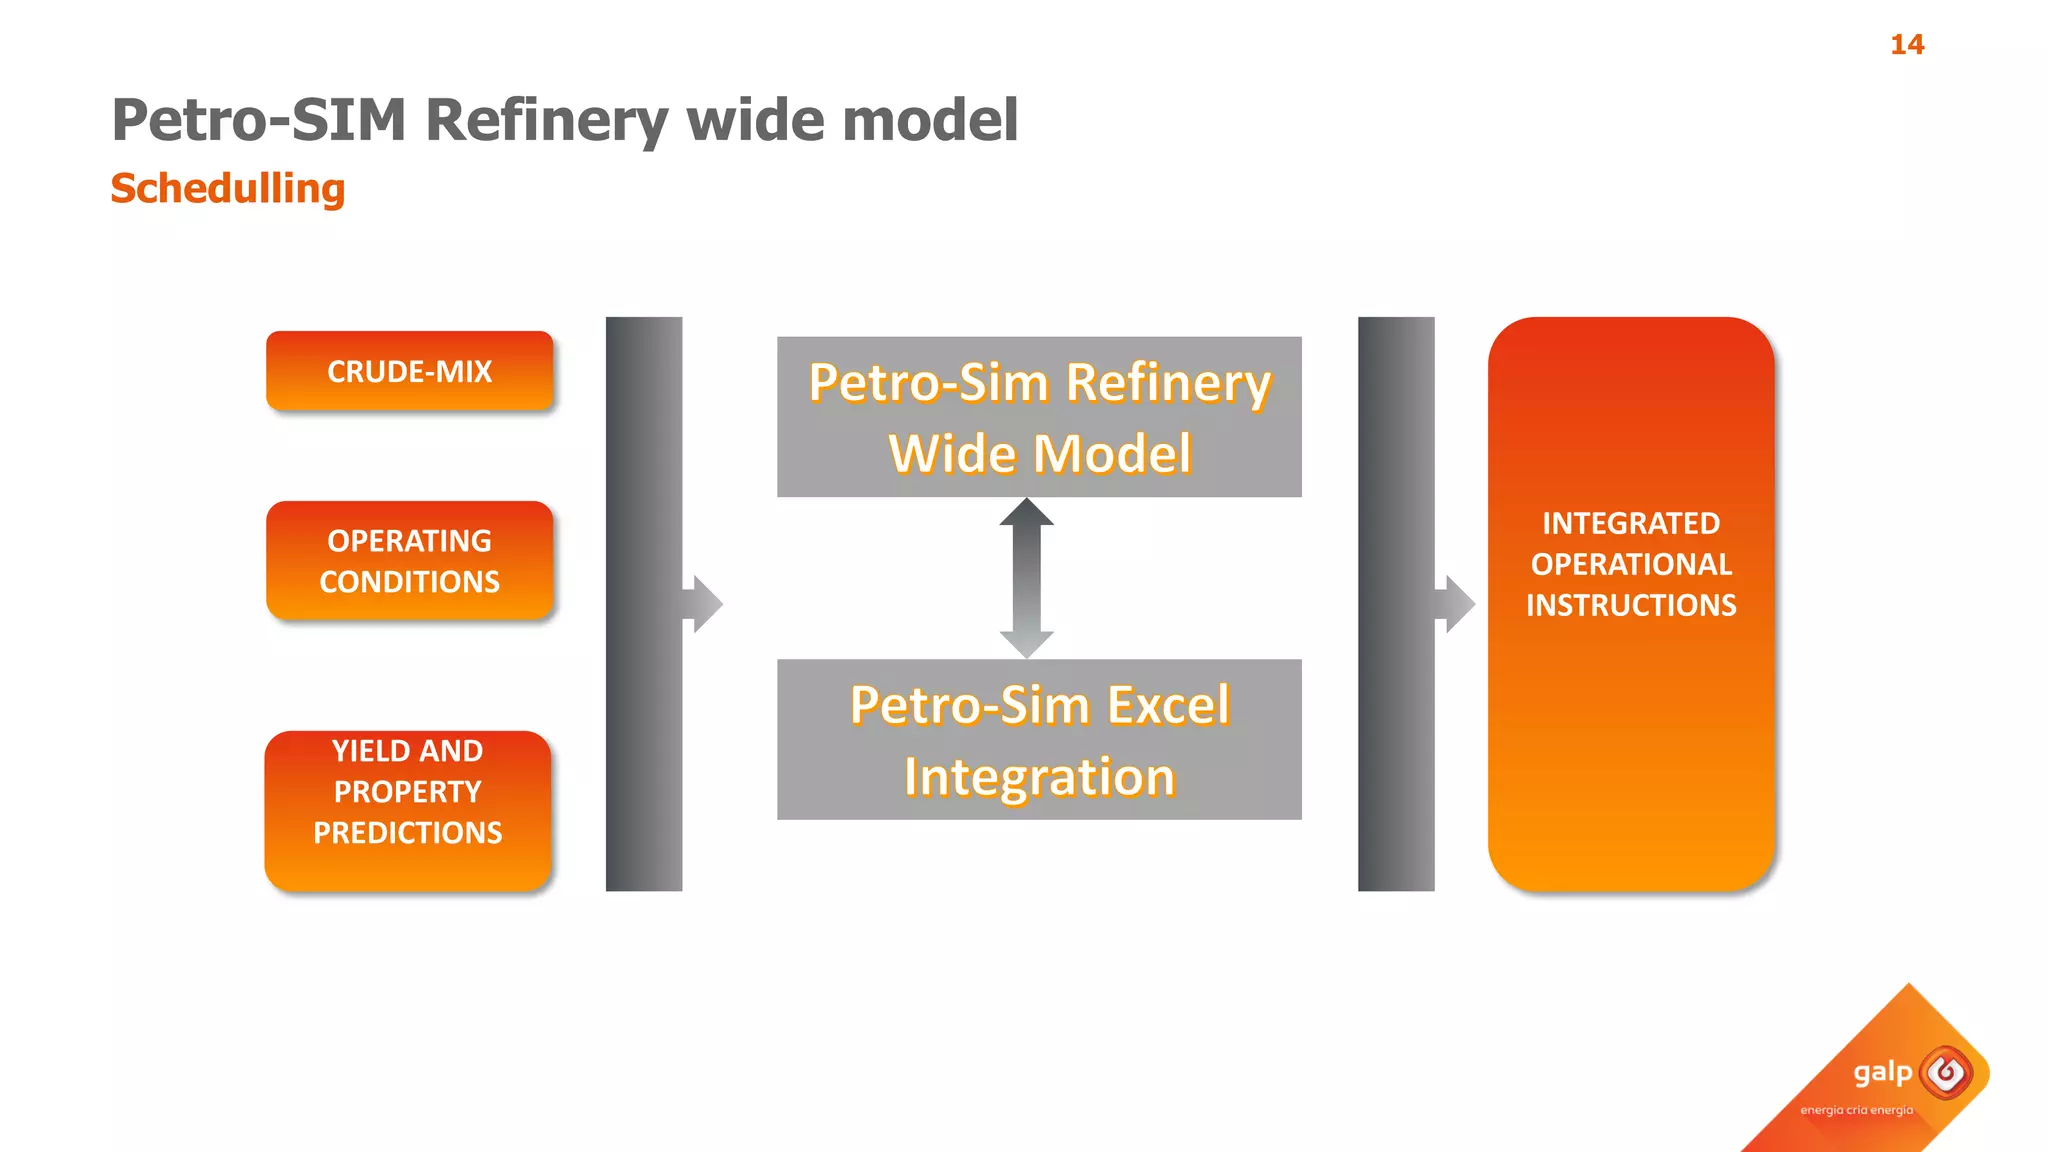
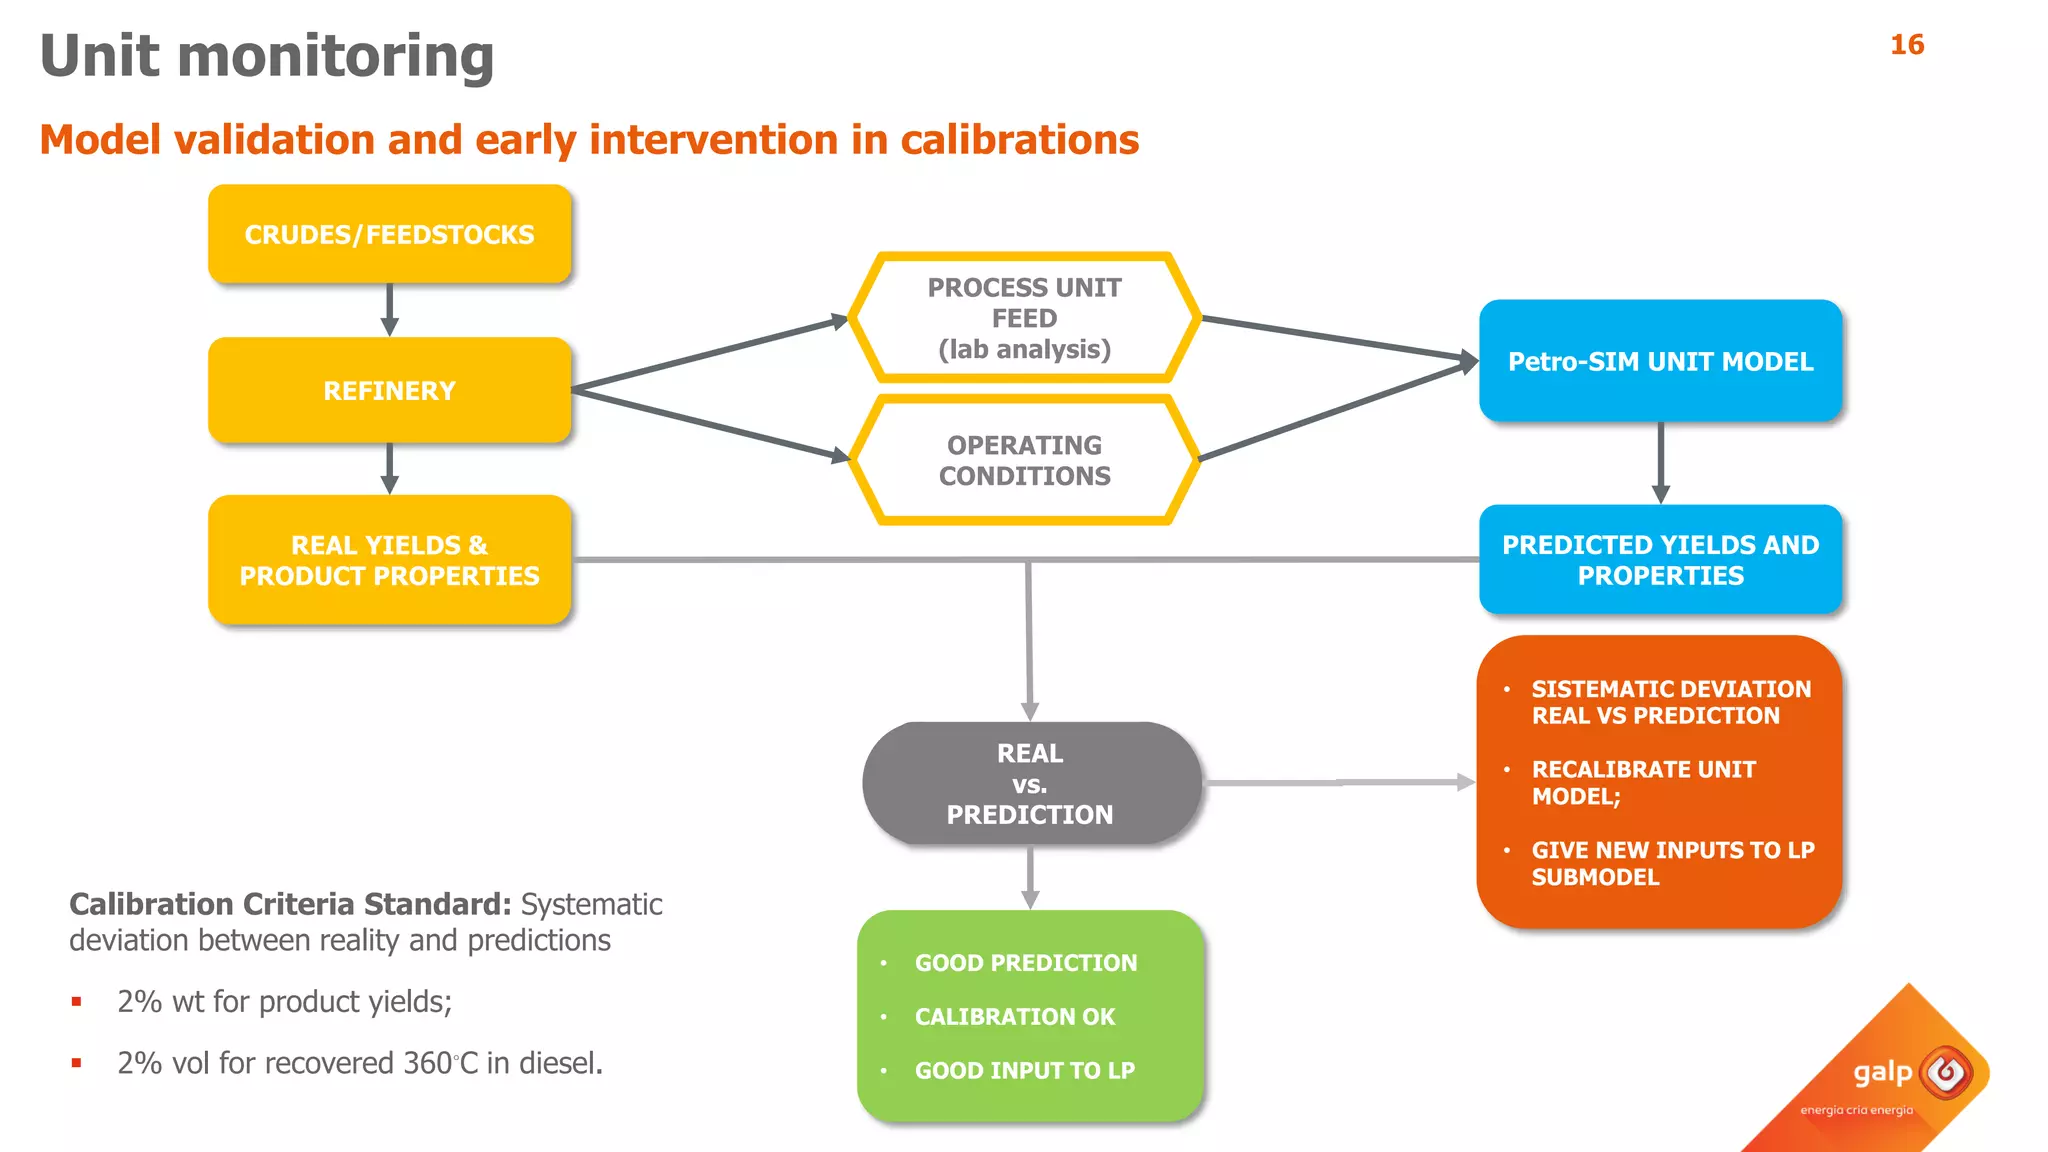
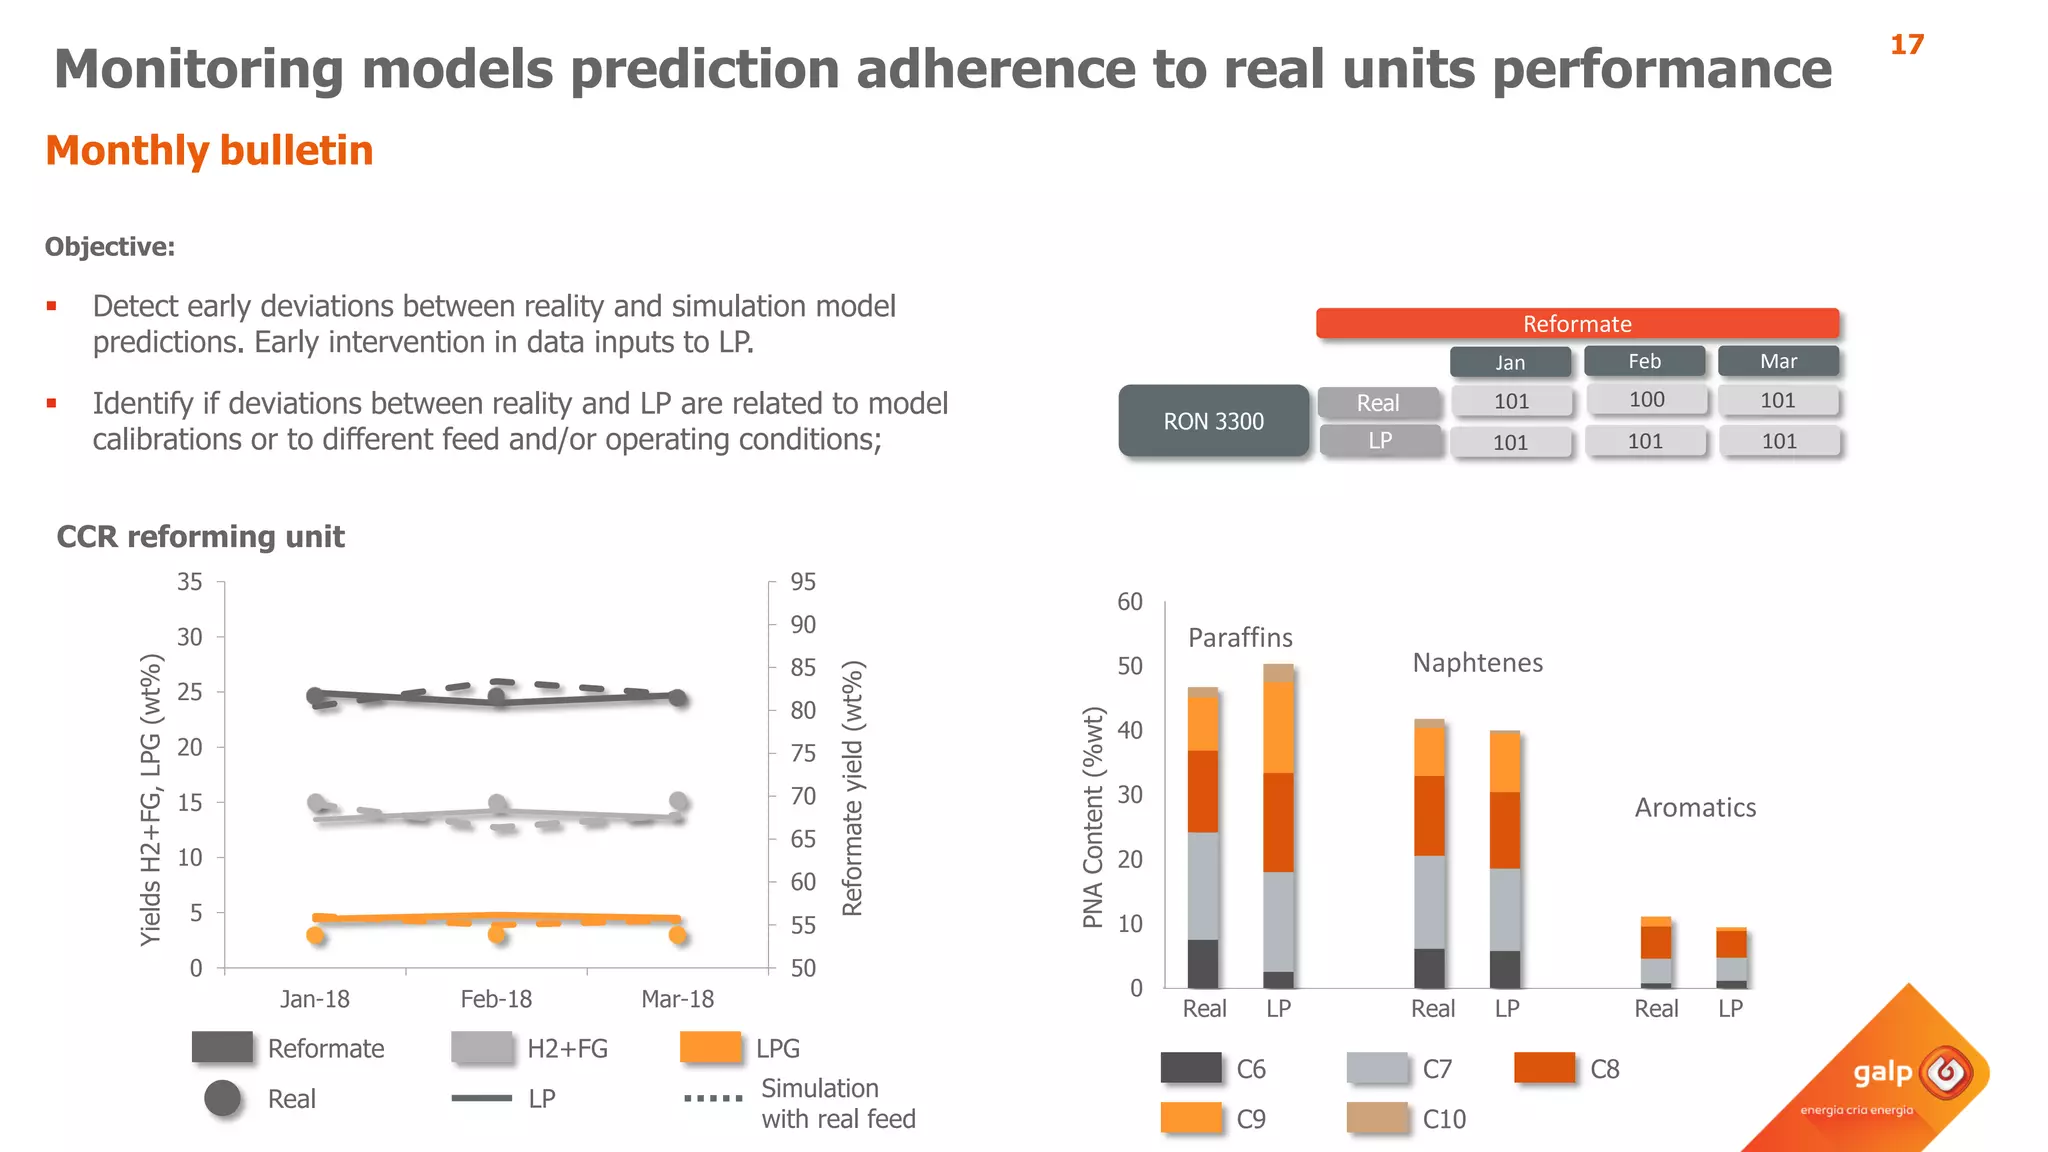
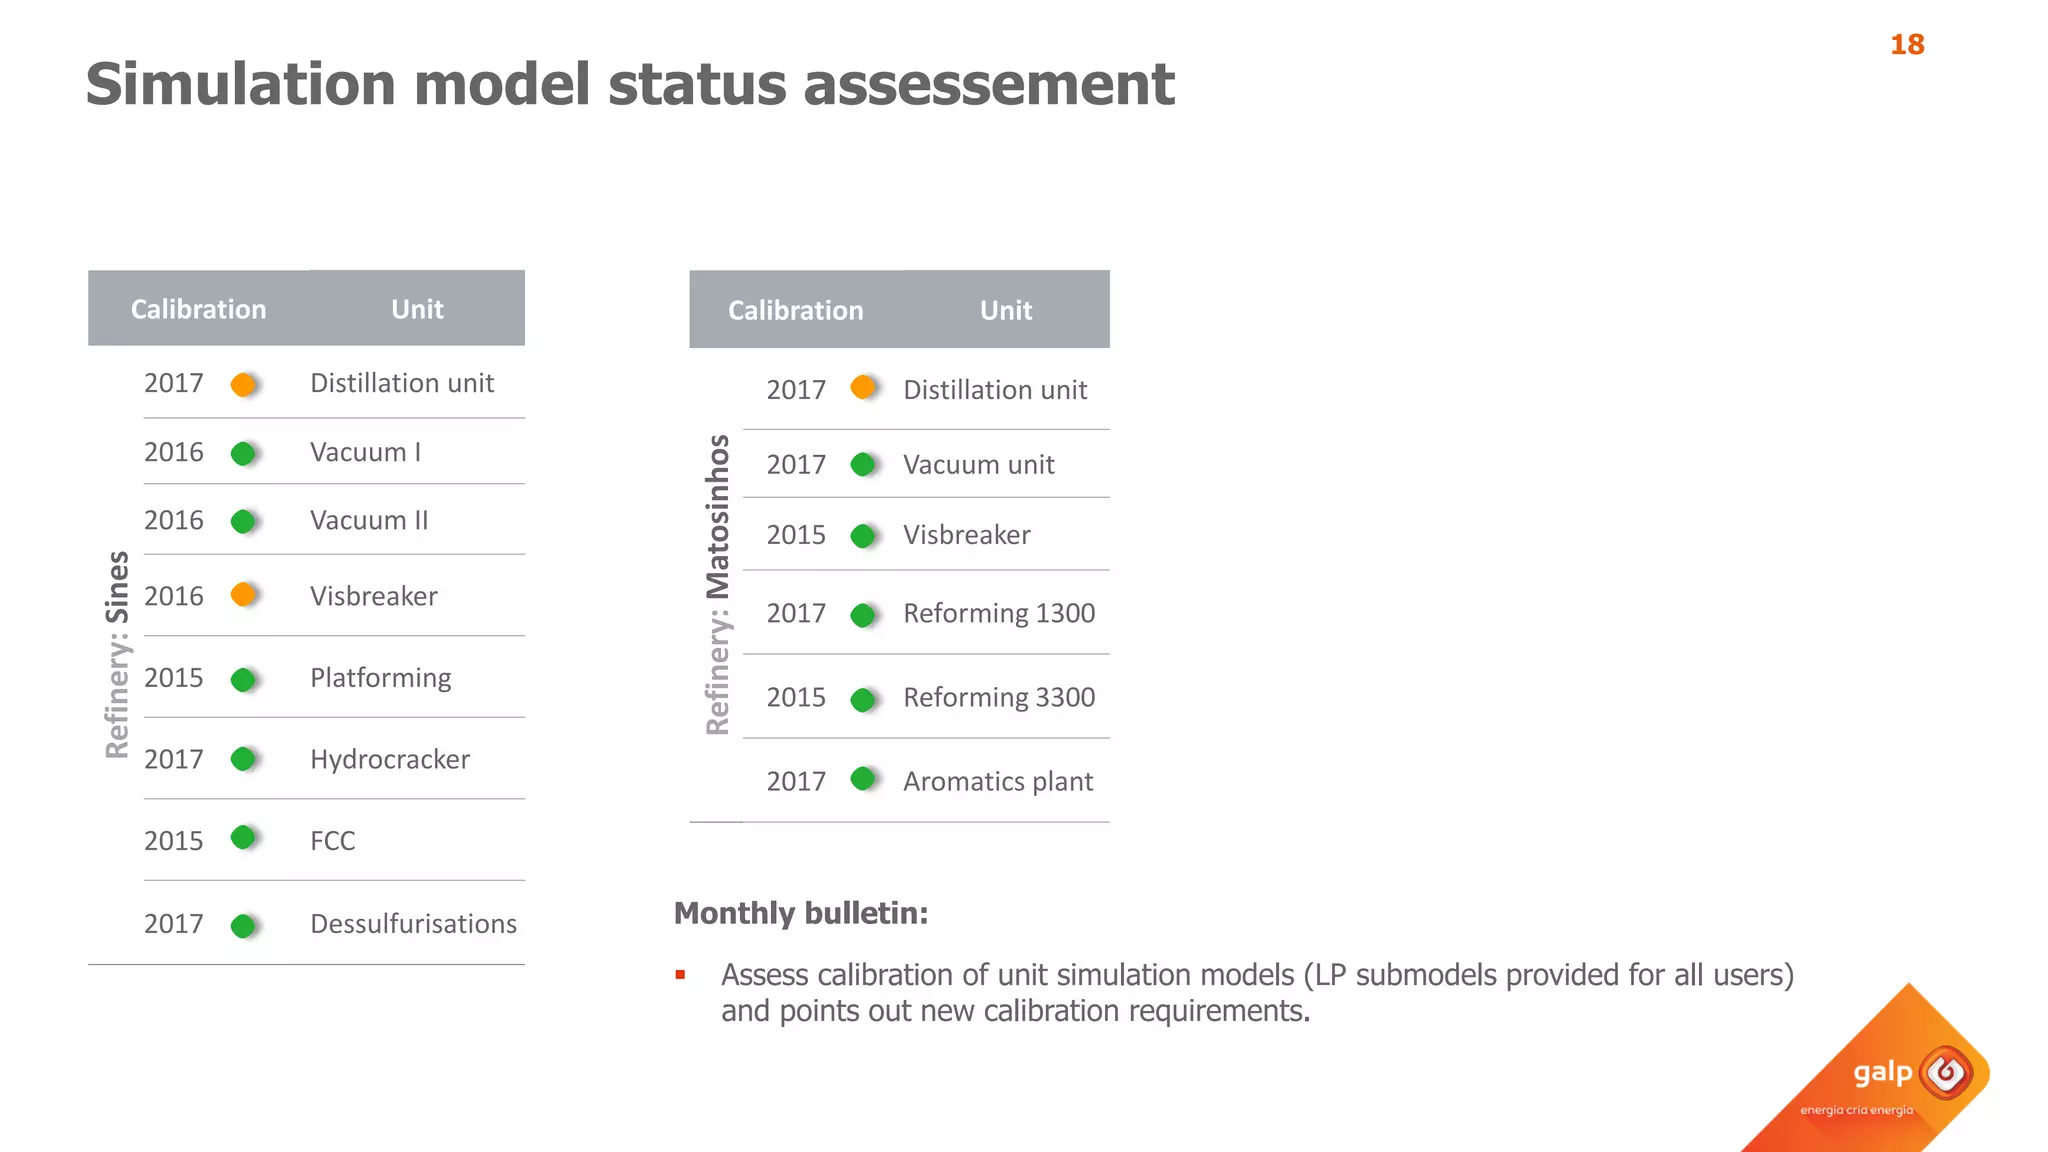
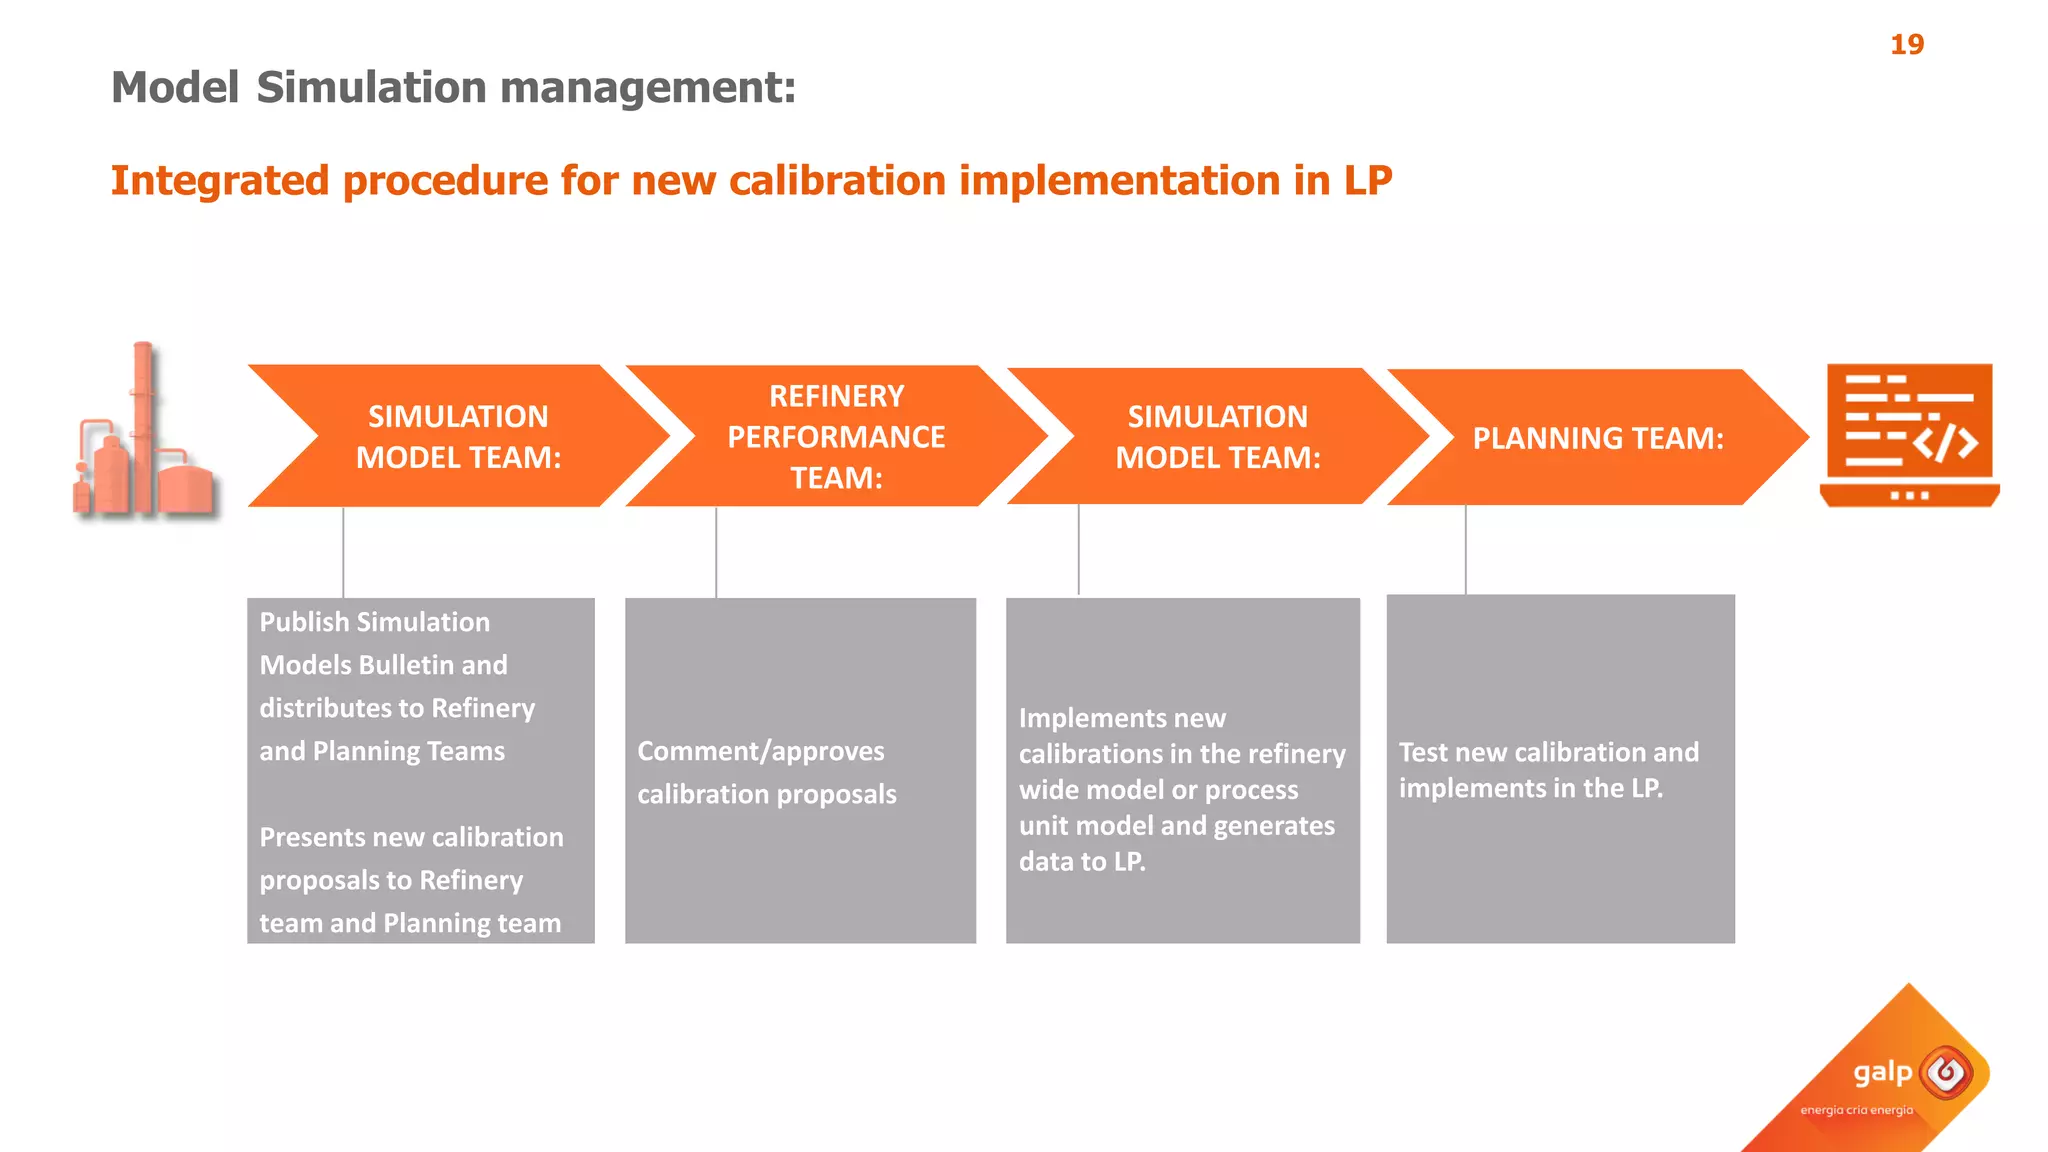
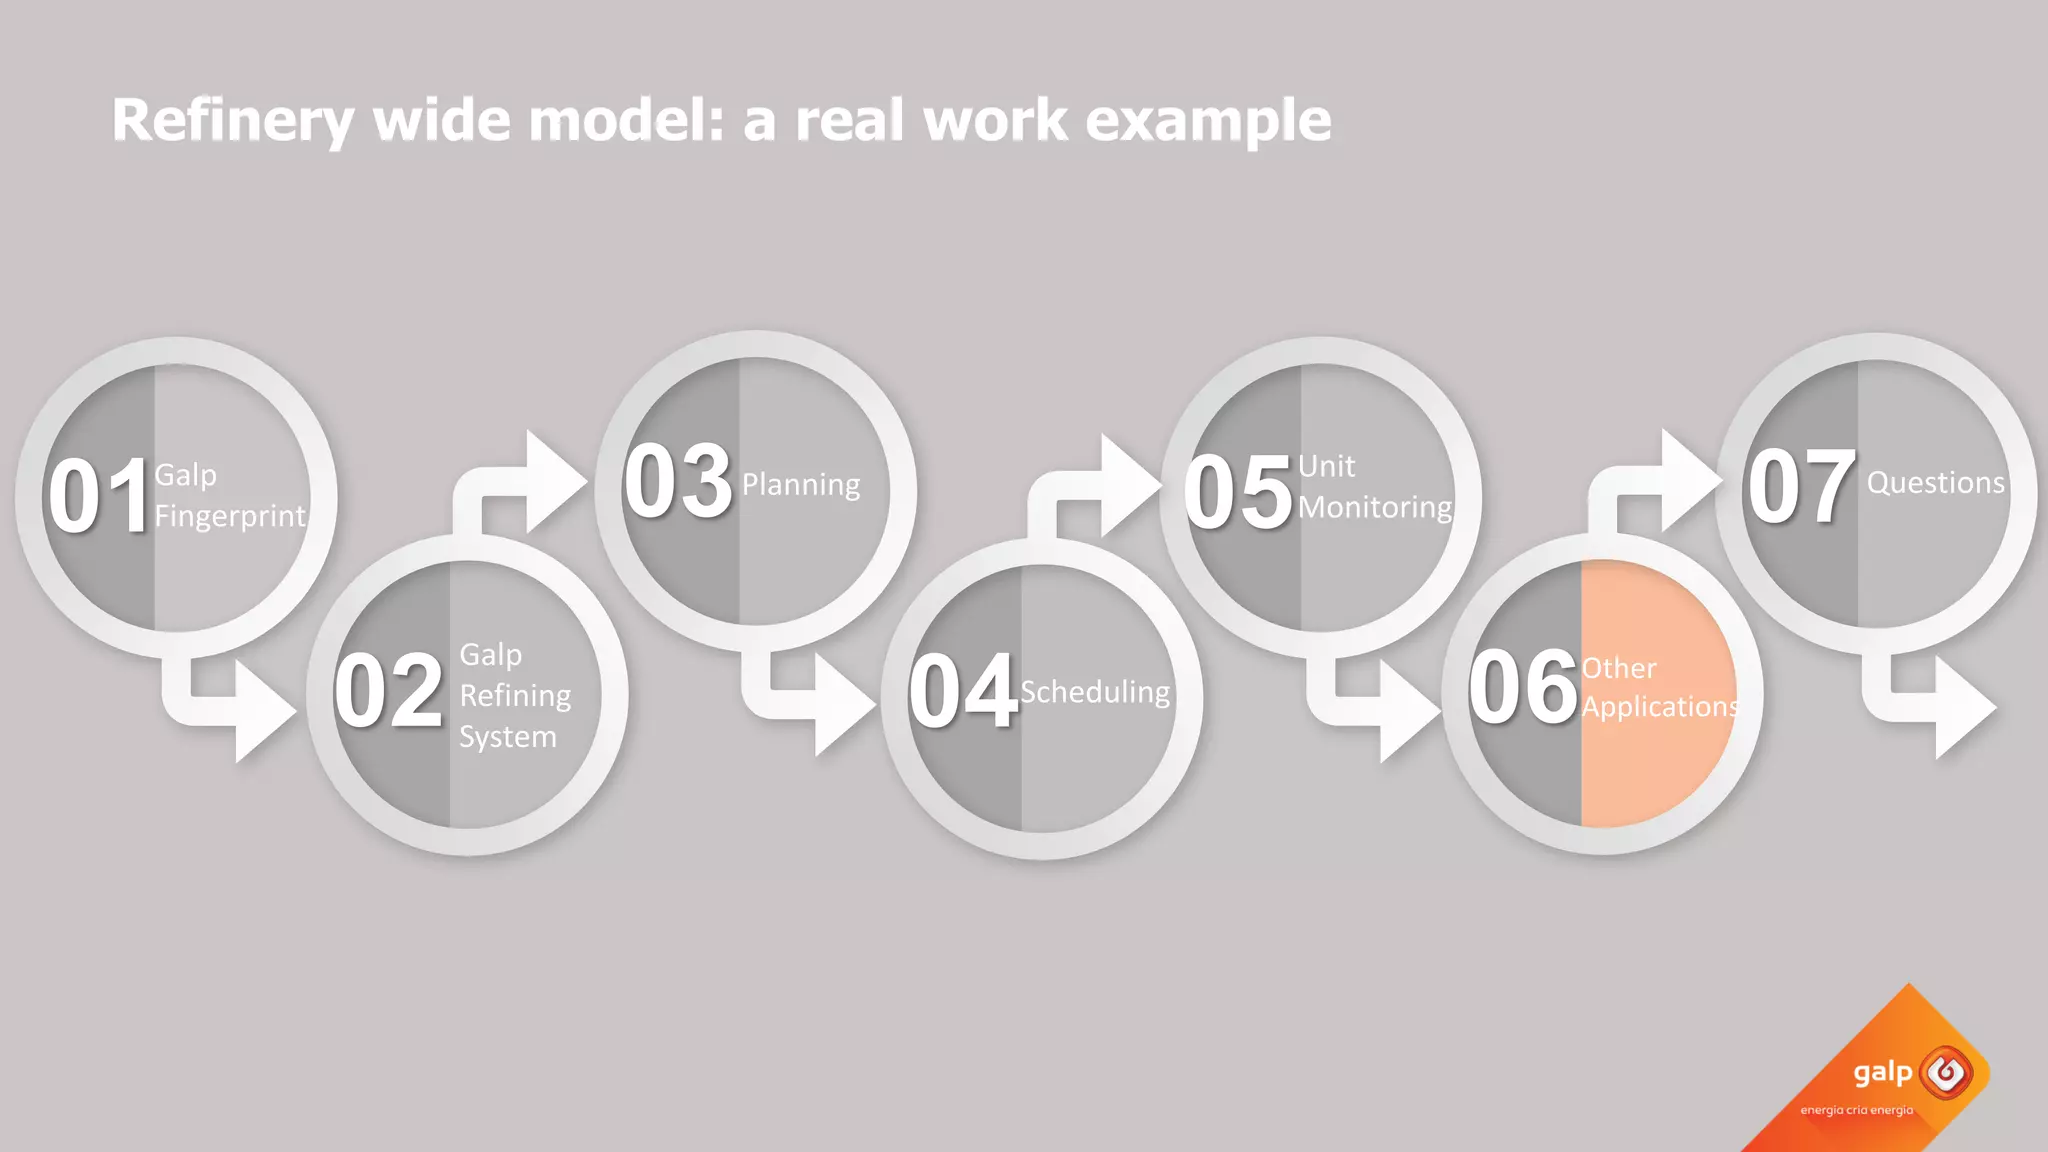
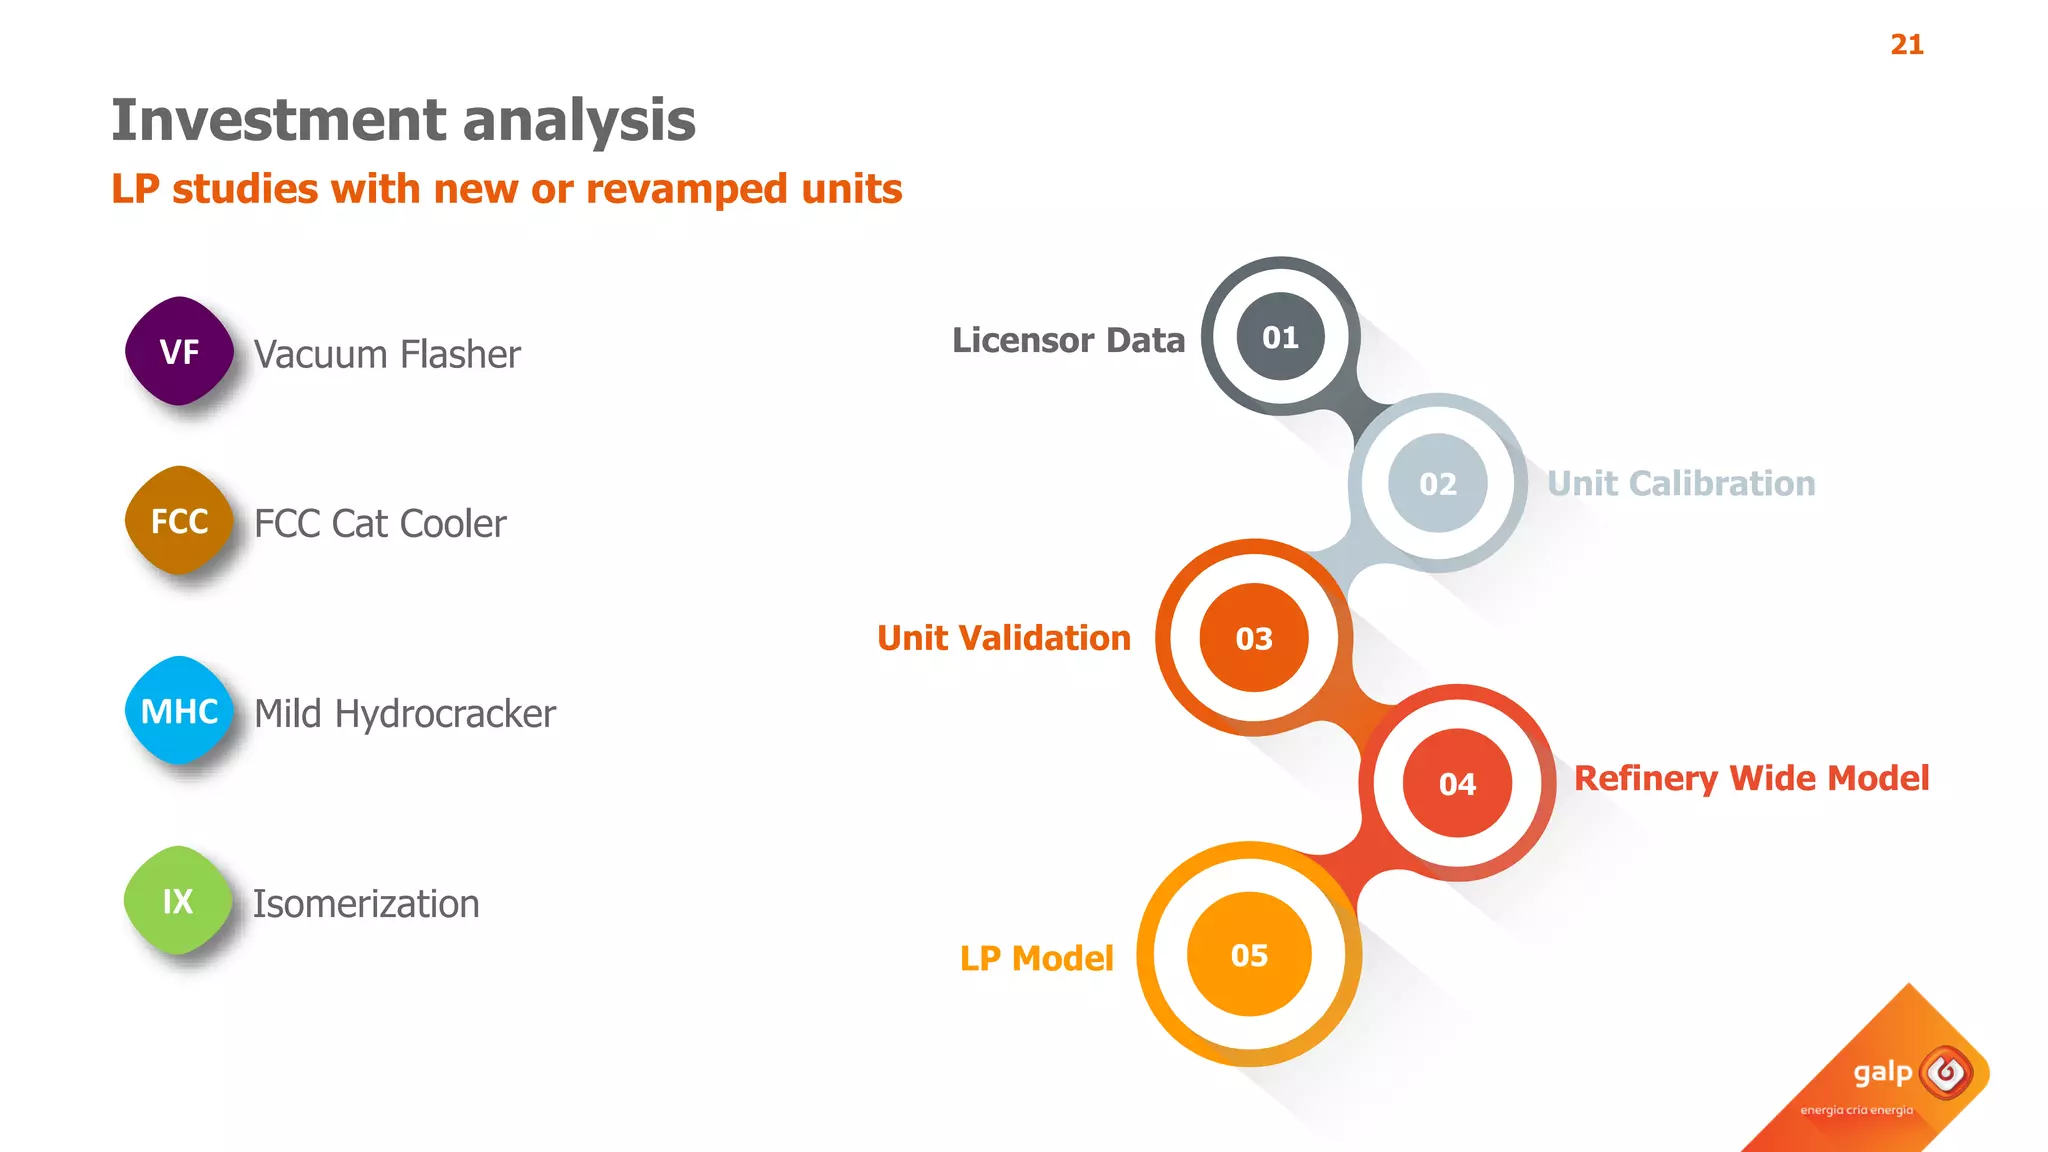
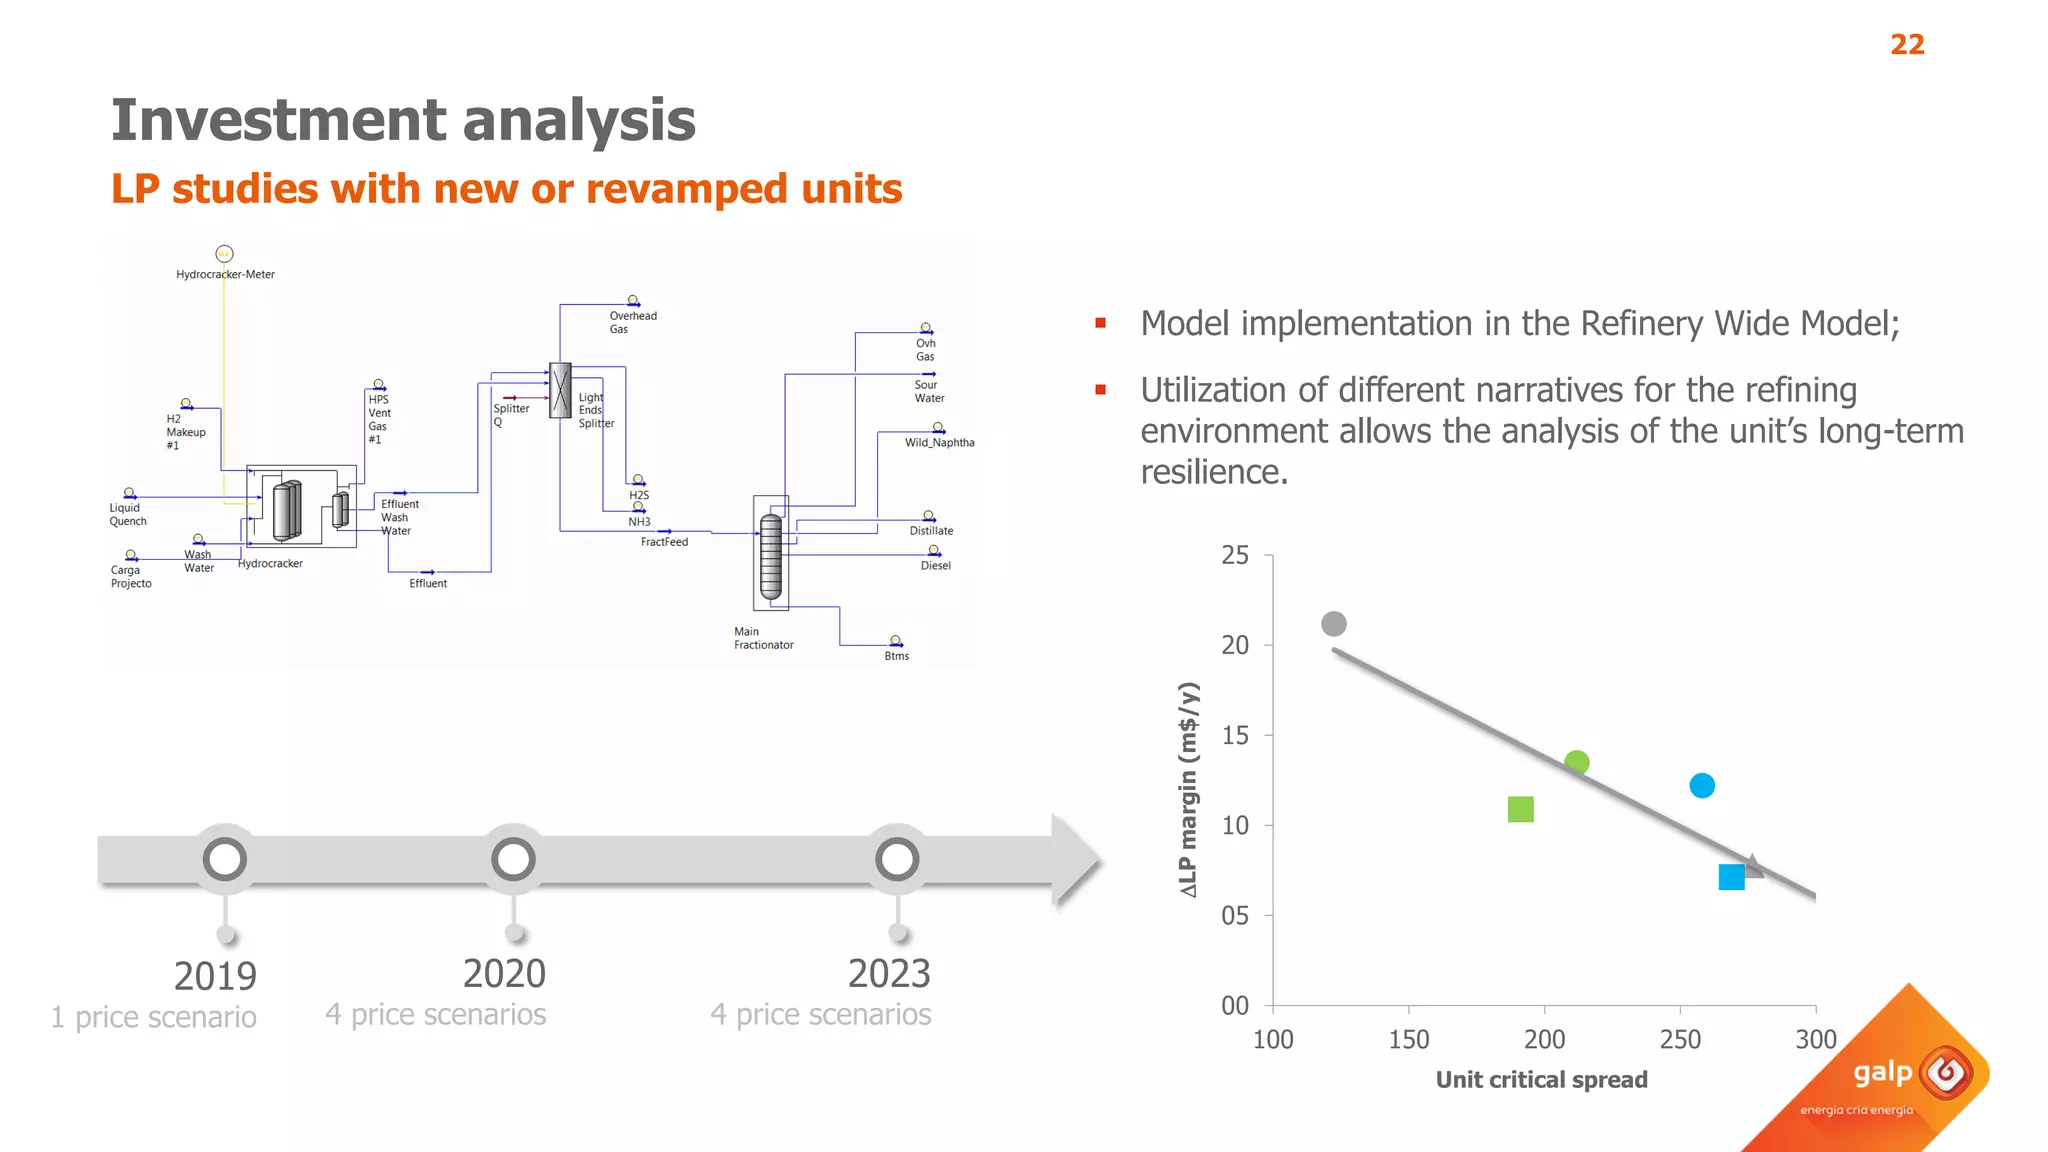
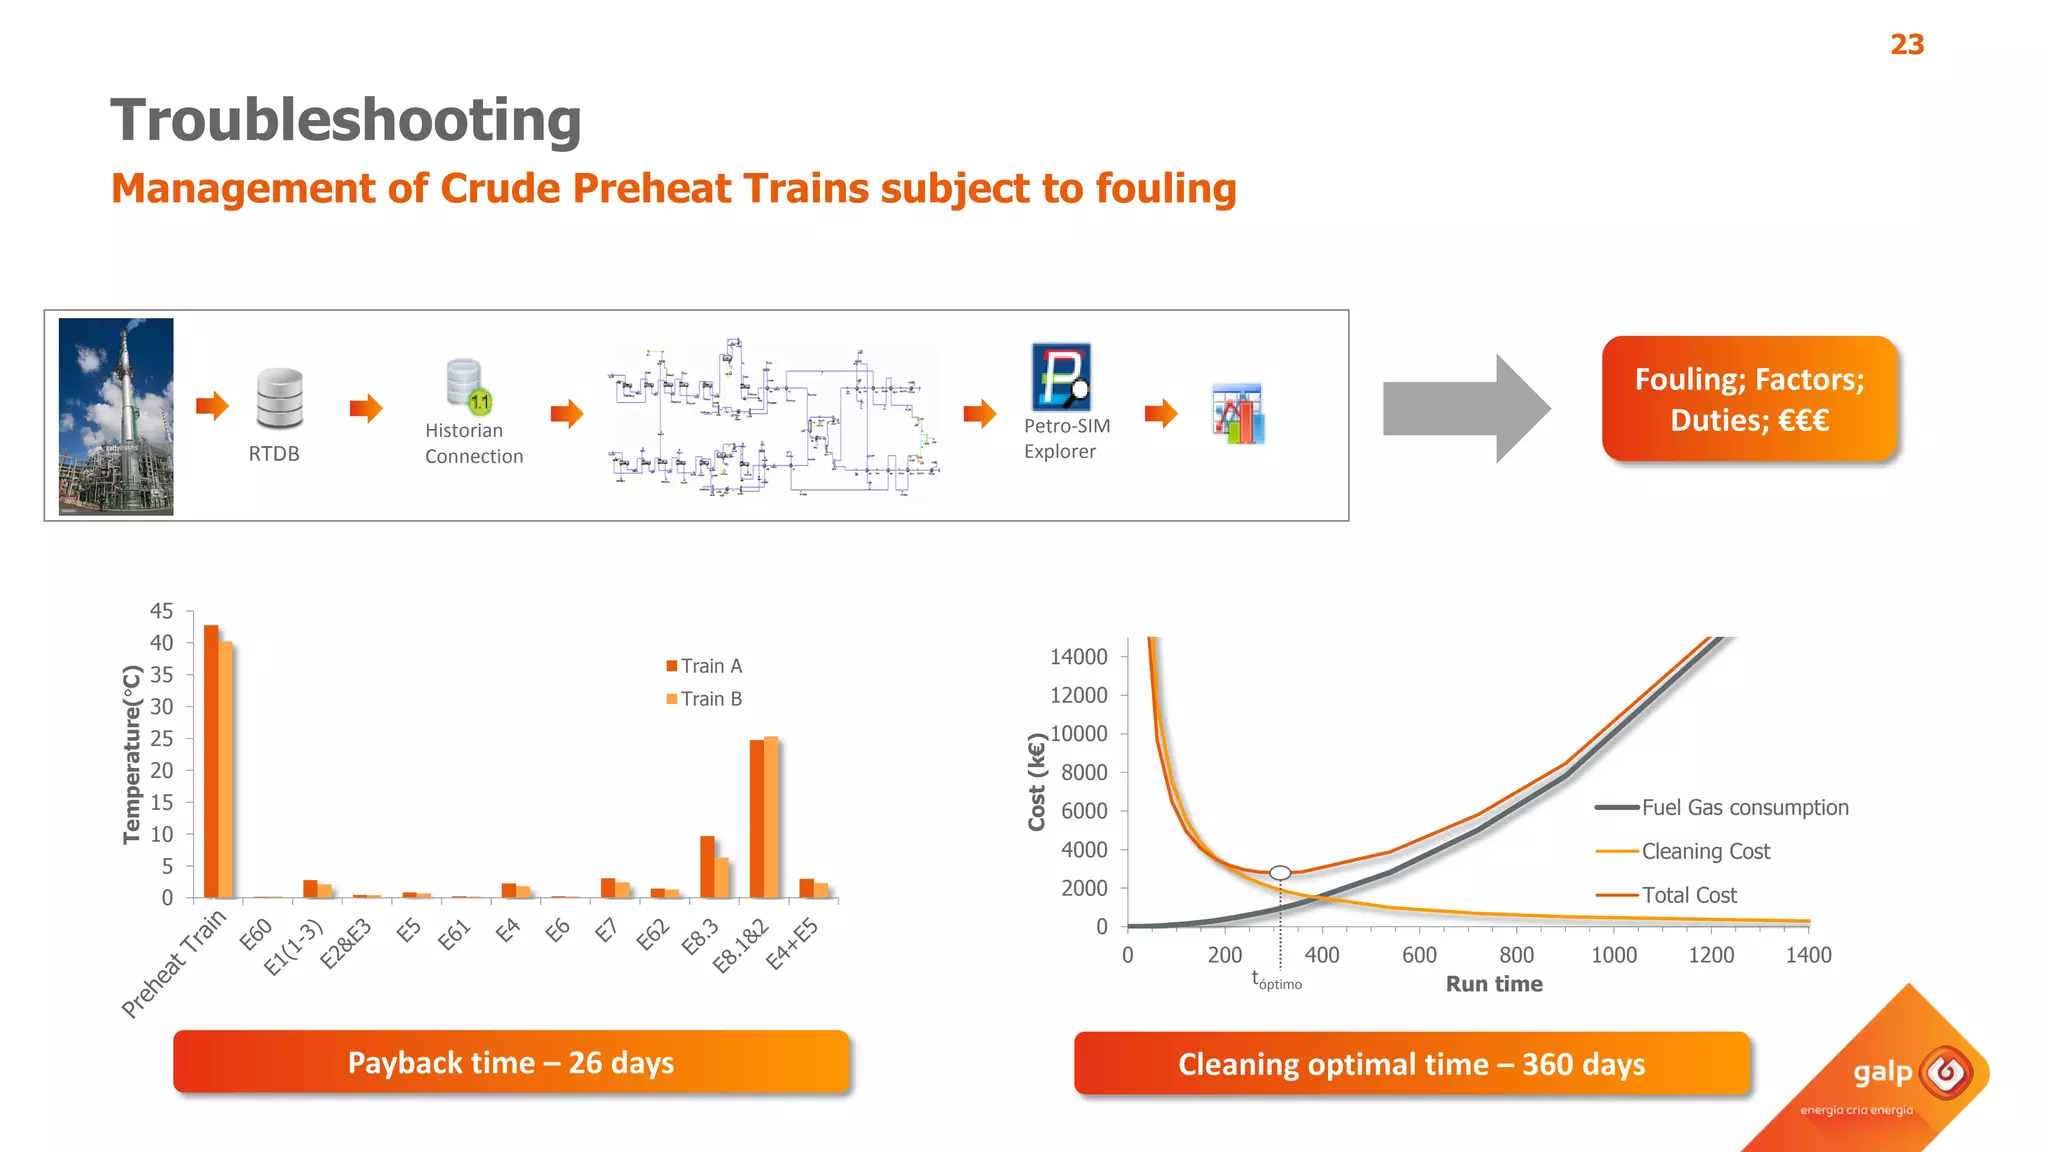


The document discusses Galp's use of a refinery-wide model to optimize operations. It summarizes: - Galp's refining capacity across multiple refineries in Portugal and Spain. - How the refinery-wide model is used for planning, scheduling, unit monitoring, and investment analysis to optimize crude selection and refining processes. - Examples of how the model predicts yields and properties to support scheduling crude slates and unit cut points and validates predictions against real unit performance.


![Article [Hydrocarbon Processing]- Refinery-wide Model in Aspen HYSYS](https://cdn.slidesharecdn.com/ss_thumbnails/3eb957a7-98b2-49d2-ad4d-e214e3656730-161122154824-thumbnail.jpg?width=640&height=640&fit=bounds)


![[DSC Europe 22] Engineers guide for shepherding models in to production - Mar...](https://cdn.slidesharecdn.com/ss_thumbnails/markodimitrijevic-engineersguideforshepherdingmodelsintoproduction2-221130080720-6e979b6f-thumbnail.jpg?width=640&height=640&fit=bounds)


![Coded Agents – with UiPath SDK + LangGraph [Virtual Hands-on Workshop]](https://cdn.slidesharecdn.com/ss_thumbnails/codedagentsdeck-251215155422-5497c599-thumbnail.jpg?width=640&height=640&fit=bounds)


