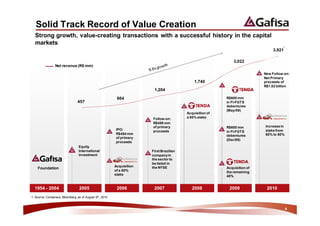
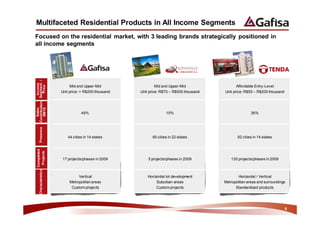
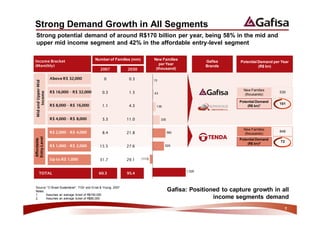
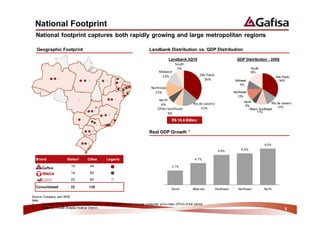
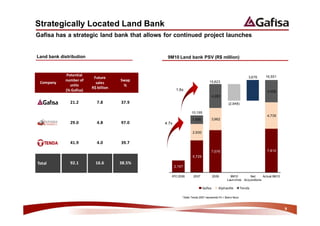
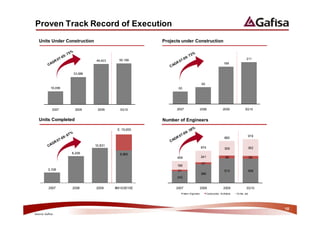
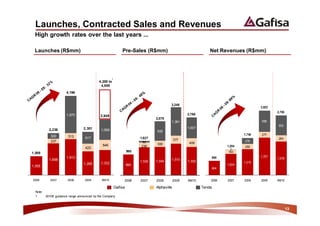
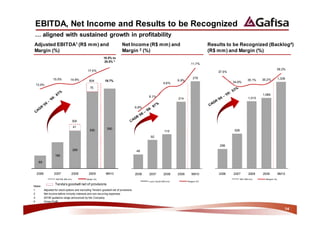
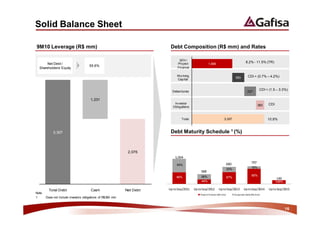
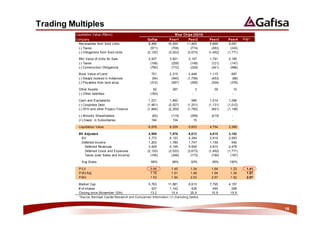
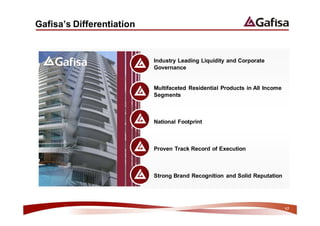
Corporate Presentation for December 2010.
1. The presentation provides an overview of Gafisa's competitive advantages including its diversified product offerings across all income segments, national footprint capturing major markets, strategically located landbank, strong brand recognition, and proven track record of execution.
2. Financial highlights discussed include sustained growth in launches, contracted sales, revenues, EBITDA, and net income in recent years aligned with profitability increases. The company also has a solid balance sheet and favorable debt maturity profile.
3. Trading multiples indicate Gafisa trades at a discount to peers based on its liquidation value after accounting for receivables, taxes, and obligations from sold units.
2. Disclaimer
We make forward-looking statements that are subject to risks and uncertainties. These Statements are
based on the beliefs and assumptions of our management, and on information currently available to us.
Forward-looking statements include statements regarding our intent, belief or current expectations or that
of our directors or executive officers.
Forward-looking statements also include information concerning our possible or assumed future results
of operations, as well as statements preceded by, followed by, or that include the words ''believes,'' ''may,''
''will,'' ''continues,'' ''expects,'‘ ''anticipates,'' ''intends,'' ''plans,'' ''estimates'' or similar expressions.
Forward-looking statements are not guarantees of performance. They involve risks, uncertainties and
assumptions because they relate to future events and therefore depend on circumstances that may or may
not occur. Our future results and shareholder values may differ materially from those expressed in or
suggested by these forward-looking statements. Many of the factors that will determine these results and
values are beyond our ability to control or predict.
2
3. Shareholder Structure, Corporate Governance and
Liquidity
True corporation listed on the NYSE and the most liquid Brazilian Real Estate company
GFSA3
Majority Independent Board of Directors;
100% Senior management with an average of over 20
years of experience and interests aligned with
shareholders through Stock Option Plan;
80% 100%
Permanent Fiscal Council, Audit, Compensation,
Finance and Governance committees
100% free float;
Avg. Daily Trading Volume (R$ mm) - Last 90 days1
100% tag along rights;
100% common shares (“Novo Mercado”);
Full compliance with Sarbanes-Oxley;
Only Brazilian real estate company listed on the
NYSE.
W' DZs Z
3
1. Source: Bloomberg as of November 12th, 2010
4. Solid Track Record of Value Creation
Strong growth, value-creating transactions with a successful history in the capital
markets
1
3,921
3,022
Net revenue (R$ mm)
New Follow-on:
Net Primary
1,740 proceeds of
R$1.02 billion
1,204
664 R$600 mm
457 in FI-FGTS
debentures
(May/09)
Acquisition of
Follow-on: a 60% stake
R$488 mm
of primary R$600 mm Increase in
IPO: proceeds stake from
in FI-FGTS
R$494 mm 60% to 80%
debentures
of primary
(Dec/09)
proceeds
Equity
International First Brazilian
investment company in
the sector to
be listed in
Acquisition the NYSE Acquisition of
Foundation
of a 60% the remaining
stake 40%
1954 - 2004 2005 2006 2007 2008 2009 2010
1. Source: Consensus Bloomberg as of August 6th, 2010
4
6. Multifaceted Residential Products in All Income Segments
Focused on the residential market, with 3 leading brands strategically positioned in
all income segments
Contribution Segment /
Income
Price
Mid and Upper-Mid Mid and Upper-Mid Affordable Entry-Level
Unit price: R$200 thousand Unit price: R$70 – R$500 thousand Unit price: R$50 – R$200 thousand
Sales
9M10
49% 15% 36%
Presence
44 cities in 14 states 60 cities in 22 states 92 cities in 14 states
Completed
Projects
17 projects/phases in 2009 5 projects/phases in 2009 130 projects/phases in 2009
Characteristics
Vertical Horizontal lot development Horizontal / Vertical
Metropolitan areas Suburban areas Metropolitan areas and surroundings
Custom projects Custom projects Standardized products
6
7. Strong Demand Growth in All Segments
Strong potential demand of around R$170 billion per year, being 58% in the mid and
upper mid income segment and 42% in the affordable entry-level segment
Income Bracket Number of Families (mm) New Families
Gafisa Potential Demand per Year
(Monthly) per Year
Brands (R$ bn)
2007 2030 (thousand)
Above R$ 32,000 0 0.3 13
Mid and Upper-Mid
New Families
R$ 16,000 - R$ 32,000
Income
0.3 1.3 43 530
(thousands)
Potential Demand
101
R$ 8,000 - R$ 16,000 1.1 4.3 139 (R$ bn)1
R$ 4,000 - R$ 8,000 3.3 11.0 335
New Families
R$ 2,000 - R$ 4,000 8.4 21.8 583 846
(thousands)
Entry-Level
Affordable
Potential Demand
72
(R$ bn)2
R$ 1,000 - R$ 2,000 15.5 27.6 526
Up to R$ 1,000 31.7 29.1 (113)
1,526
TOTAL 60.3 95.4 1,526
Source: “O Brasil Sustentável”, FGV and Ernst Young, 2007
Notes: Gafisa: Positioned to capture growth in all
1. Assumes an average ticket of R$190,000
2. Assumes an average ticket of R$85,000 income segments demand
7
8. National Footprint
National footprint captures both rapidly growing and large metropolitan regions
Geographic Footprint Landbank Distribution vs. GDP Distribution
Landbank 3Q10 GDP Distribution - 2006
^
South
D 16%
^ W
São Paulo
Midwest 34%
9%
E
Northeast
13%
E North
Z : Rio de Janeiro
5% 12%
K ^ Others Southeast
11%
R$ 16.6 Billion
Real GDP Growth 1
8.0%
6.6% 6.9%
Brand States2 Cities Legend 4.7%
14 44 3.1%
14 92
22 60
Consolidated 22 130
South Midw es t Southeas t Northeas t North
Source: Company and IBGE
Note:
1. Nominal GDP growth rate per year for 2003 – 2006 adjusted by the average consumer price index (IPCA) of the period
2. Does not Include Brasilia Federal District . 8
9. Strategically Located Land Bank
Gafisa has a strategic land bank that allows for continued project launches
Land bank distribution 9M10 Land bank PSV (R$ million)
W 16,551
3,676
^ 15,823
Z 1.6x
' 4,006
4,285
(2,948)
10,195
4,735
1,536 3,962
4.7x
2,930
7,576 7,810
5,729
d
2,167
IPO 2006 2007 2009 9M10 Net Actual 9M10
Launches Acquisitions
' d
*Note: Tenda 2007 represents Fit + Bairro Novo
9
10. Proven Track Record of Execution
Units Under Construction Projects under Construction
50,189 211
49,423
188
33,586
85
16,099 63
2007 2008 2009 3Q10 2007 2008 2009 3Q10
Units Completed Number of Engineers
E: 15,000
919
880
10,831
674 309 352
8,206 9,995
459 241 58 59
47
186
3,108 31 513 508
386
242
2007 2008 2009 9M10/2010E 2007 2008 2009 3Q10
Intern Enginners Construction Architects On the Job
10
^ '
11. Strong Brand Recognition and Solid Reputation
Gafisa benefits from its strong brand recognition and solid reputation through: (i) a
higher sales speed (VSO); (ii) commanding premium prices; and (iii) easier access to
asset swaps / partnerships
Leading Brands Strong Brands in Every Segment
Maior Construtora do Brasil: Largest Construction
1st
Company in Brazil – 2008 / 2009 (ITCnet)
► 55 years in the Real Estate industry
► Completed more than 985 developments and 11 million m2
► Awards: Valor Top Management and Top Manager of the Year
Top of Mind – 2008 (Diário do Grande ABC /
1st
IBOPE)
► One of the best known brands in the affordable entry-level
segment
► Completed more than 500 developments
1st Reference in Urban Development
► Completed more than 40 developments and 3.4 million m2
► Awards: Best Social Responsibility and 2009 Top Social –
Alphaville Foundation
Source: ITCnet, Revista Marketing, Valor Econômico
11
13. Launches, Contracted Sales and Revenues
High growth rates over the last years ...
Launches (R$mm) Pre-Sales (R$mm) Net Revenues (R$mm)
1
4,200 to
4,600
4,196
3,248
3,022
2,792
1,970 2,949 2,766
2,578
1,361 988
932
2,301 1,007
2,236 1,068 932
1,740 277
300 313 617 1,627 284
237 377 276
60 406
549 300
238 1,204 250
420
7
1,005 995 193
1,913 664 1,757
1,698 1,510 1,576
1,329 1,345 1,352 1,215
1,265 1,332 995 1,004
1,005
664
2006 2007 2008 2009 9M10 2006 2007 2008 2009 9M10 2006 2007 2008 2009 9M10
Gafisa Alphaville Tenda
Note:
1 2010E guidance range announced by the Company
13
14. EBITDA, Net Income and Results to be Recognized
… aligned with sustained growth in profitability
Adjusted EBITDA1 (R$ mm) and Net Income (R$ mm) and Results to be Recognized (Backlog4)
Margin (%) Margin 2 (%) (R$ mm) and Margin (%)
18.5% to
20.5% 3
330 11.7% 12%
17.5% 38.2%
37.5%
15.0% 279 1,309
14.9% 604 19.7% 280 9.9% 35.1% 35.2%
9.6% 34.6%
13.4% 10%
75
1,066
230 8.1% 1,015
214
8%
6.9%
180
300 6%
41 130
530 550
110 528
92
4%
80
298
259 46
180 2%
30
89
2006 2007 2008 2009 9M10 -20 2006 2007 2008 2009 9M10 0% 2006 2007 2008 2009 9M10
EBITDA (R$ mm) Margin (%) REF (R$ mm) Margem (%)
Lucro Líquido (R$ mm) Margem (%)
Tenda’s goodwill net of provisions
Notes:
1 Adjusted for stock options and excluding Tenda’s goodwill net of provisions
2 Net income before minority interests and non-recurring expenses
3 2010E guidance range announced by the Company
4 Gross Profit
14
15. Solid Balance Sheet
9M10 Leverage (R$ mm) Debt Composition (R$ mm) and Rates
SFH /
Net Debt / Project 1,846
8.2% - 11.5% (TR)
55.6% Finance
Shareholders’ Equity
Working CDI + (0.7% – 4.2%)
553
Capital
Debentures
CDI + (1.5 – 3.3%)
527
1,231
Investor CDI
380
Obligations
Total 3,307 10.8%
3,307 Debt Maturity Schedule 1 (%)
2,076
54%
15%
33%
56% 85%
46% 67%
44% 100%
Total Debt Cash Net Debt h ^ h ^ h ^ h ^ h ^
Note: W Z Z
1 Does not include investors obligations of R$380 mm
15
16. Trading Multiples
Liquidation Value (R$mn) Blue Chips (3Q10)
Company Gafisa Peer1 Peer2 Peer3 Peer4 Avg (1)
Receivables from Sold Units 8,466 10,455 11,463 5,669 5,081
(-) Taxes (571) (706) (774) (383) (343)
(-) Obligations from Sold Units (2,120) (3,022) (3,673) (1,462) (1,771)
Mkt Value of Units for Sale 2,937 3,821 2,197 1,791 2,180
(-) Taxes (198) (258) (148) (121) (147)
(-) Construction Obligations (790) (710) (329) (341) (986)
Book Value of Land 751 2,315 2,448 1,115 687
(-) Swaps booked in Advances (94) (540) (1,756) (453) (68)
(-) Payables from land acqs. (312) (557) (395) (304) (378)
Other Assets 92 287 3 39 10
(-) Other liabilities (183) - - - -
Cash and Equivalents 1,231 1,892 986 1,014 1,284
(-) Corporate Debt (1,461) (2,527) (1,201) (1,131) (1,012)
(-) SFH and other Project Finance (1,846) (2,259) (1,785) (461) (1,148)
(-) Minority Shareholders (62) (115) (399) (219) -
(+) Invest. in Subsidiaries 194 134 15 - -
Liquidation Value 6,035 8,209 6,653 4,754 3,389
BV Adjusted 4,959 7,876 6,012 4,015 3,102
BV 3,772 6,123 4,384 2,919 2,563
Deferred Incom e 1,203 1,780 1,747 1,159 540
Deferred Revenues 3,429 5,149 5,594 2,810 2,478
Deferred Costs and Expenses (2,120) (3,022) (3,673) (1,462) (1,771)
Taxes (over Sales and Incom e) (106) (348) (173) (190) (167)
Avg Stake 99% 98% 93% 95% 100%
P/LV 0.95 1.45 1.34 1.64 1.23 1.41
P/BVAdj 1.16 1.51 1.48 1.94 1.34 1.57
P/BV 1.53 1.94 2.03 2.67 1.62 2.07
Market Cap 5,763 11,881 8,913 7,795 4,157
# of shares 437 1,142 426 490 269
Closing price (November 12th) 13.2 10.4 20.9 15.9 15.5
*Source: Barclays Capital Res earch and Com panies ' Inform ation / (1) Excluding Gafis a
16
17. Gafisa’s Differentiation
Industry Leading Liquidity and Corporate
Governance
Multifaceted Residential Products in All Income
Segments
National Footprint
Proven Track Record of Execution
Strong Brand Recognition and Solid Reputation
17
19. Tenda: Differentiated Platform for the Affordable Entry-
Level Segment
Through Tenda, Gafisa has a differentiated and developed platform to capture growth
in the affordable entry-level segment
Sales Standardized Construction Process
Centrally located and well diversified
portfolio
Duo Tower
S
Garden Life
► Hybrid construction model with in-house
► Well-trained and dedicated sales force
and outsourced construction capabilities
helps clients with home purchasing and
financing decisions
► Standardized materials
► Sales force located in areas with constant
flow of people ► 4 project options in each production line
► High variety of products and branch
locations to best meet client needs ► Economies of Scale
19
20. Tenda: Blue-Print Mortgage (“Crédito Associativo”)
The use of Crédito Associativo reduces the Working Capital requirement
^
d
W W
W
^W
W^s
W
Typical Project Cash Flow for low-income project with land acquired for cash
With Crédito Associativo
Commercial Launch
End of construction
Land Acquisition
there is little WC requirement
Beginning of
Key Delivery
construction
and the company cash flow
% Cash exposure over PSV
already moves from negative
to positive during the
No. of months construction period;
With a traditional financing
scheme, we have to use
project finance to cover the
W W negative WC, until the
Assumes that the land represented 10% of the PSV and was paid for in 6 installments
Crédito Associativo is provided by Caixa Econômica Federal (CEF) to finance low-income projects/units.
delivery.
20
21. Z d
Traditional Construction
Months
1 2 3 4 5 6 7 8 9 10 11 12 13 14
Foundation
Traditional Brick blocks Construction Method;
Building and Finishing
Title Process Use of Ceramic and Concrete Blocs;
Collection
High demand for finishing repairs;
Construction Cycle lasts 10-12 months;
Aluminum Molds Construction
Months
1 2 3 4 5 6 7 8
Foundation
Building and Finis hing Construction based on Aluminum Molds
Title Proces s
Collection
High constructions efficiency avoiding excessive
wastes;
Concrete walls done on site;
Construction Cycle lasts 4-5 months;
Effectiveness of the production process
21
22. Aluminum Mold Construction Method
Tenda: Valle Verde Cotia, SP
INCC Evolution (%) – Last 10 months
% Oct-07 Oct-08 Oct-09 Oct-10
Consolidated INCC
Materials e Equipments
Labor
Labor costs always tend to surpass the other INCC items
22
23. Alphaville: Differentiated Business for Residential Land
Communities
Alphaville Concept Steady Growth
Leisure
Residential Area Launches (R$ mm)
Area
549
420
Residential
Area 312
237
111
2006 2007 2008 2009 9M10
Alphaville
Commercial Area Commercial
Club Residential
Area
Multi-family
Area Pre-Sales (R$ mm) and VSO (%)
Areas 49%
59%
Sustainable Business Model
59% 406
60% 377
► Partnership contracts via land swaps 300
n.a.
► Construction only after pre-sales 238
► High sales velocity 140
► Alphaville Foundation enables sustainable integration with
the surrounding communities
2006 2007 2008 2009 9M10
23
25. Housing FinanceSystem (SFH) – FundingSources
Allocation Distribution Borrowers
Funding
Sources of of
Resources Resources
CEF Investments
Companies
in Infrastructure
Registered 8% of their Income FGTS (MCMV)
Workers TR + 3%
Companies
SFH
TR+
Private
Individuals
Compulsory
Housing Credit
TR + 6.17% Companies
Market
Private
Savings 30%
Central Bank Individuals
Accounts Compulsory Deposits
TR+6.17% 20%(TR+6.2%).10%(Selic)
Companies
Resources for
Lending Private
Individuals
25
26. Brazilian Savings Loan System (SPBE)
Growth in Brazilian Savings LTM Monthly Disbursements by the SBPE
Z
Z
s z z
s z z
Brazilian savings are growing steadily, ensuring available credit for the coming years
^ ' ^ / Z z Housing Credit
Sources guaranteed
while new sources are
under development
Sources: Brazilian Central Bank and Banco Santander
26
27. Growing Credit Availability
In recent years, the credit supply for real estate financing has increased substantially
with lower interest rates and longer tenors
Interest Rates vs. Housing Financing
A favorable growth trend for credit availability began in
35% 160 2005, when the annual Selic was close to 20%;
30% 140
120
25% In 2008 the Central Bank increased the Selic from
100
20%
80 11.25% to 13.75% without any impact on home financing;
15%
60
10%
40 According to the Central Bank, the market is expecting
5% 20
a Selic of 10.75% by the end of 2010.
0% 0
Dec- Sep- Jul- Apr- Feb- Nov- Sep- Apr- Nov- Jun- Dec- Jul-
02 03 04 05 06 06 07 08 08 09 09 10
Selic (%a.a.) Real Estate Financing (R$ billion)
Real Estate Financing – Amount Funded (R$ bn) Housing Financing vs. GDP1
85 101%
83%
30
50
40
16
25 10
15 55 18%
10 7 34 13%
6 6 30 3%
3 4 9 18
3 6
2004 2005 2006 2007 2008 2009 2010E Denmark UK Chile Mexico Braz il
SBPE FGTS
Source: Central Bank, IBGE and ABECIP
Brazil: high growth potential for home financing
1. Data from 2006. For Brazil, consider data from 2009
27
28. Real Price Variation for New Units - MRSP
3 Bedrooms
Real Variation (2005-10): 22%
22,38% 121,86% In 5 years, real prices have shown a 26% raise in the
metropolitan area of São Paulo, mainly from small units;
10,43%
Base 100 0,70%
-5,79%
-1,91%
-3,95% This raise happened specially on the last 12 months, taking
benefit from the quick post-crisis recovery;
Despite the raise since 2005, this raise is still in line with the
average real income raise.
2004 2005 2006 2007 2008 2009 Jan- 2010
Jun/10
Average Price SP Real Average PricesYoY
Preços YOY
1 Bed 2 Bed 3 Bed
Variation (YoY) Income 80%
2005 -1,93% 60%
40%
2006 -12,83%
20%
2007 7,70%
0%
2008 4,63% -20%
2009 2,50% -40%
Jan-Jul/10 28,07% -60%
jan/06 jul/06 jan/07 jul/07 jan /08 jul/08 jan /09 jul/09 jan/10
Cum ulate 26,4%
Fonte: MCM Consultores – Região Metropolitana de São Paulo
28
29. Government Programs – MCMV I
Government programs were created to reduce the significant housing deficit in the lower
income segments
Highlights Simulation of Potential Impact on Market Size
► Financing for one million houses with up to Average Unit Price:
Before “Minha Casa, Minha
R$23,000 in subsidies to families with income of R$80k Vida” Program
up to 10x the monthly minimum wage (R$4,650)
Subsidy 0 16,000
► R$34 billion in subsidies (Federal Government, Mortgage 80,000 64,000
FGTS, BNDES)
Cost (TR+) 7% 5%
► Financing of homes with a price range of
Monthly installments 665 394
R$80,000 to R$130,000
Minimum monthly income 2,661 1,969
► Interest Rates ranging from TR+5% – TR+8%
Equivalent of minimum wages 6.4 4.2
► Homebuilders can finance 100% of the property
value Market Size
(millions of homes) 13.4 23.4
► No down payment and no installments during the
construction period (for families with income up to
3x the minimum wage) Additional market of approx. 10 million houses
Source: Market Reports
29
30. Government Programs – MCMV II
Government renewed MCMV program, giving more visibility to the Real Estate sector:
Highlights Income distribution
► MCMV II income distribution followed the same
distribution of the contracted units from MCMV I:
► Financing for two million houses up to 2014;
► R$72 billion in subsidies;
# of units: 1 million 2 million
► Continued growth for the next 4 years already
committed;
► General details to come up to the beginning of
2011;
► It confirms the government commitment to
provide financing for entry level homebuyers.
DDs / DDs / D DDs //
Dt Dt Dt
Source: CS, UBS, CEF, Market reports
30
31. Efficiency Gains under “MCMV” Program
Tenda contracted 22,914 units through September and has close to 8,000 units under
CEF analysis
d h DDs /
D t
Dt
Dt
dKd
h K
W
W d DDs dKd
Y
Y
Y
Y
dKd
h ^
d
W h DDs
Y
Y
Y
dKd
31
32. CEF Real Estate Financing
Caixa Econômica Federal has reached historical records of real estate financing, and
is responsible for 73% of the market contracts
Housing Financing Contracts (R$ bn) CEF vs. Market – Financing of New Units (‘000 units)
606
897
143
759
503 515 47 48
425 443 312
267 276
326
251 223
23 92 167
132 47 409
13 15 118
9
5 6 29 38
55 177 176 187
145
88 94 39
17
2003 2004 2005 2006 2007 2008 2009 Up to Sep
10 2003 2004 2005 2006 2007 2008 2009 Sep/2010
Financing (R$ bn) Financing Am ount ('000)
Caixa - MCMV Market Total
MCMV Contracts Units (‘000) Inventory of Received Proposals (‘000 units)
5,602
Projects
3,966 1.048
3,219
188 186
814
1,868
17 149 656 140 266
42 110 495
96 33 114 193
364
1 149
60 10
96 57 78
130 33 596
27 8 95 481
22 394
8 53 52 75
20 191
8 12 30 24 25
26
Y Y Y Y Y : Jun-09 Sep-09 Dec-09 Apr-10 Sep-10
0 a 3 MW 3 a 6 MW 6 a 10 MW
0 a 3 SM 3 a 6 SM 6 a 10 SM
32
Source: Caixa Econômica Federal
35. Ratings and Balance Sheet
LIABILITIES AND SHAREHOLDERS' EQUITY
R$ 000' 3Q10 3Q09 2Q10
ASSETS 3Q10 3Q09 2Q10
Cur re nt As s e ts Cur r e nt Liabilitie s
Cash and c ash equivalents 570.718 948.350 1.136.765 Loans and financ ing 789.331 570.307 825.382
Restricted cash in guarantee to Debentures 214.561 80.781 123.608
loans and res ctricted credits 660.425 151.337 669.619 Obligations for purchase of
Receiv ables f rom clients 2.727.930 1.718.110 2.470.944 land and advanc es from clients 460.470 488.935 466.078
Properties for s ale 1.447.266 1.376.236 1.446.760 Materials and s erv ice suppliers 292.444 194.302 244.545
Other ac counts receivable 155.795 93.722 141.740 Tax es and contributions 234.394 132.216 154.983
Deferred selling expenses 38.028 7.205 20.592 profit s haring 69.594 61.206 73.057
Deferred taxes - 13.099 - Provis ion for contingencies 8.001 10.512 6.312
Prepaid expens es 16.423 13.522 15.283 Dividends 52.287 26.106 52.287
5.616.585 4.321.581 5.901.703 Deferred taxes - 52.375 -
Long-te r m As se ts Other 171.417 181.312 217.569
Receiv ables f rom clients 2.411.275 1.662.300 2.075.161 2.292.499 1.798.052 2.163.821
Properties for s ale 388.649 386.196 407.792 Long-te r m Liabilitie s
Deferred taxes 367.788 250.846 311.693 Loans and financ ings 371.843 636.639 352.181
Other 177.182 52.140 131.035 Debentures 1.551.407 1.244.000 1.748.000
land 177.412 147.168 176.084
3.344.894 2.351.482 2.925.681
Deferred taxes 483.373 322.870 484.453
Investments 194.207 195.088 194.871 Provis ion for contingencies 51.185 59.509 52.670
Property, plant and equipment 63.825 53.698 59.659 Other 568.945 362.843 521.211
Intangible ass ets 15.480 9.690 16.280 Deferred income on acquis ition 6.757 12.499 8.045
273.512 258.476 270.810 0
Unearned inc ome f rom partial s ale of investment 11.594 0
3.210.922 2.797.122 3.342.644
Total As s e ts 9.234.991 6.931.539 9.098.194
Minor ity Shar e holde r s 51.565 552.889 46.316
Corporate Rating Shar e holde r s ' Equity
FITCH Moody’s SP
National Scale Capital 2.729.187 1.233.897 2.712.899
Treasury shares (1.731) (18.050) (1.731)
Rating A- A1 A
Capital reserves 251.489 190.585 290.507
Perspective Stable Stable Stable Revenue reserves 422.373 218.827 381.651
los ses 278.687 158.217 162.087
Last update September/2010 September/2010 October/2010 3.680.005
0 1.783.476
0 3.545.413
0
9.234.991
Liabilitie s and Shar e holde r s ' Equity 6.931.539 9.098.194
35
36. Why Cash Burn should change to positive in 2011?
Cash burn continue high mainly due to Tenda’s units launched and sold mainly in 2007 and 2008 that
are being built using it’s own capital, instead of the mechanism of Blue-Print mortgages (Crédito
Associativo);
Going forward, Tenda is gradually increasing the use of Associative Credit over current sales (that
already reached 62% in the 3Q10), contributing to reduce the Working Capital needs;
From now until June/11, Tenda will transfer approximately 7,000 units that did not contracted Blue-Print
mortgage, meaning that the invested money will return to Company’s cash.
Tenda is delivering units that did not
contracted Blue-Print mortgage in
the past.
Tenda’s unit sales by type of finance Tenda’s Transferred of Concluded Units
to CEF - Pipeline
9,505 11,576 15,871 9,733 3,039
2,922
2,236 2,075
757
D Y 3Q10 4Q10E 1Q11E 2Q11E
W D d W Bank Mortgage
36
38. d ' W
D
Launch Start Construction
h
D D D D D D D
D
Sales 30% 60% 70% 80% 87% 94% 100%
% Costs - 2,5% 15% 35% 65% 85% 100%
Revenues - 1,5% 10,5% 28% 57% 80% 100%
Collections
(cumulative) 1% 4% 9% 11% 18% 25% 85% 100%
38