Download to read offline


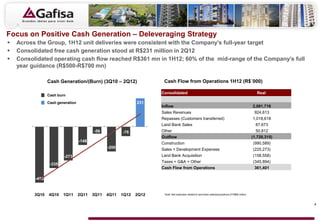
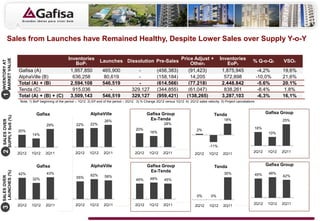
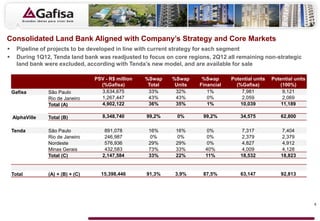
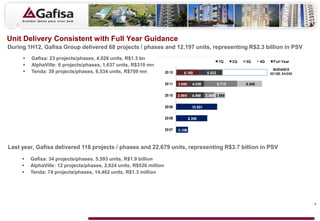


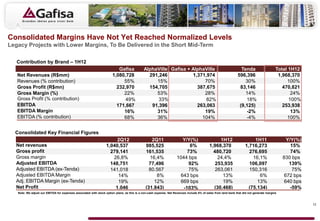
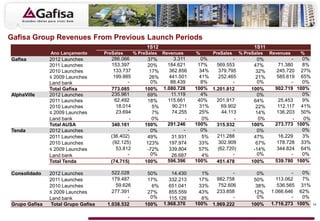
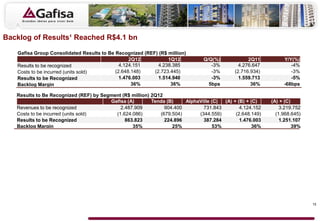
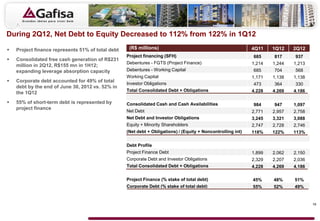
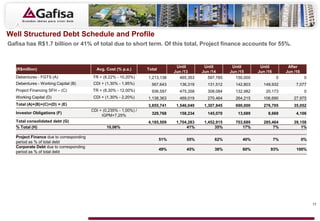

The document provides an overview of a company's 2Q12 and 1H12 results. It discusses financial performance including revenues, gross profit, EBITDA margins, and contributions by brand. Key highlights include consolidated revenues reaching $1.97 billion for 1H12, gross profit of $470.8 million for 1H12 representing a 24% margin, and EBITDA of $253.9 million for 1H12 representing a 13% margin. Legacy projects with lower margins are expected to be delivered in the short to mid-term, impacting overall margins.


