This document summarizes Cyrela's business and the Brazilian real estate market:
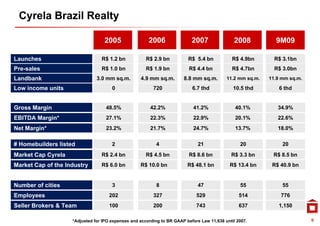
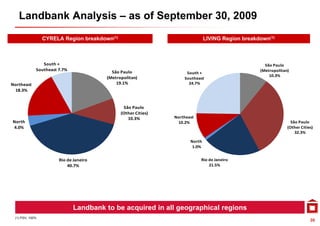
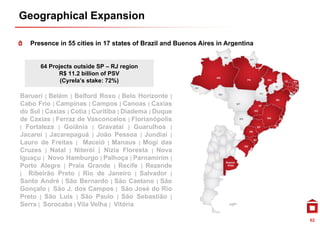
1) Cyrela is the largest homebuilder in Brazil with almost 50 years of experience and a nationwide presence across income segments.
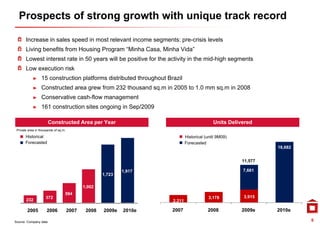
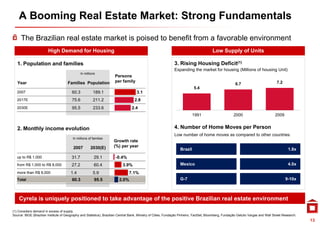
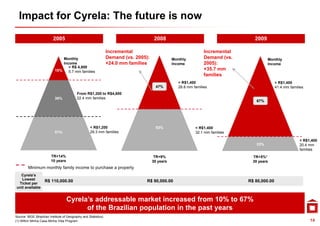
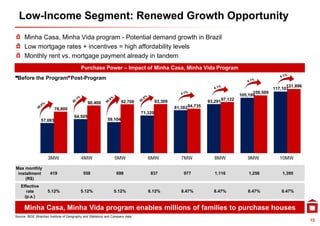
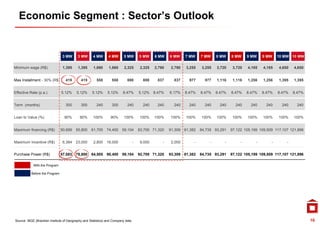
2) The Brazilian real estate sector is poised for strong growth driven by demographics, rising incomes, and a large housing deficit despite a recent slowdown.
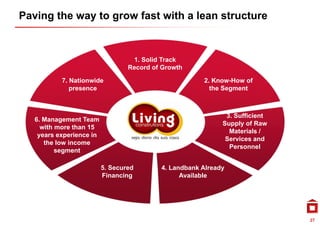
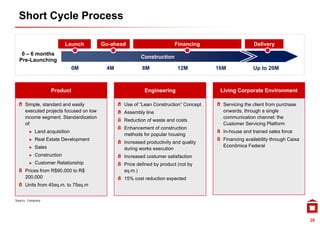
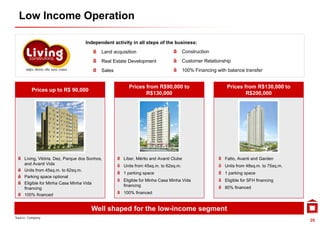
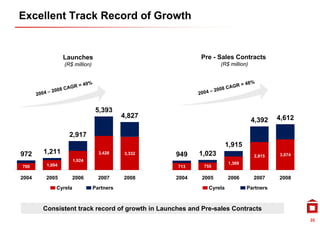
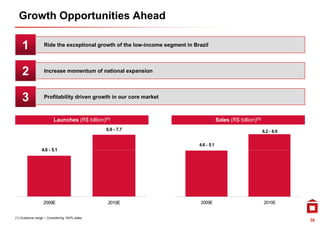
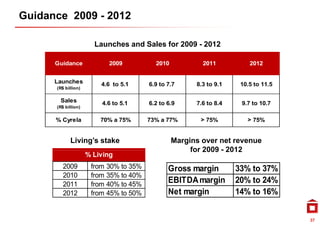
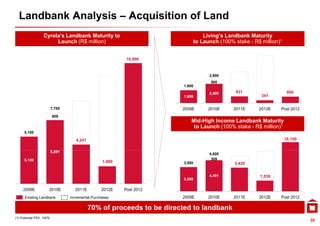
3) Cyrela is well positioned to capture growth opportunities given its scale, execution capacity, nationwide footprint, and track record of innovation and expansion into new segments and regions.