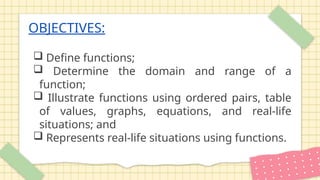
OBJECTIVES:
Define functions;
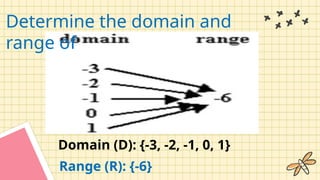
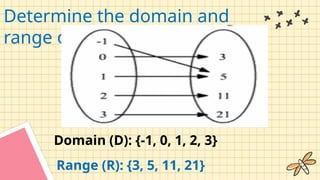
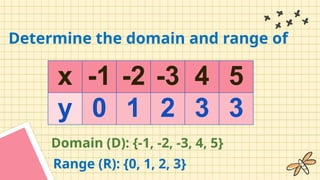
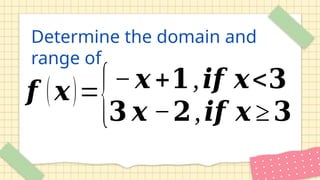
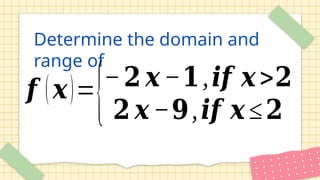
Determine the domain and range of a
function;
Illustrate functions using ordered pairs, table
of values, graphs, equations, and real-life
situations; and
Represents real-life situations using functions.
17.
Definition of a
Function
Itis a relation define as a set of
ordered pairs (x, y) where no two or
more distinct ordered pairs have the
same first element (x).
18.
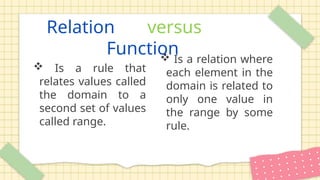
Relation versus
Function
Isa rule that
relates values called
the domain to a
second set of values
called range.
Is a relation where
each element in the
domain is related to
only one value in
the range by some
rule.
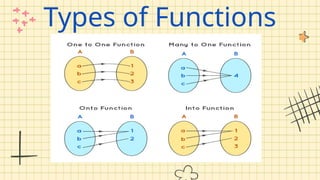
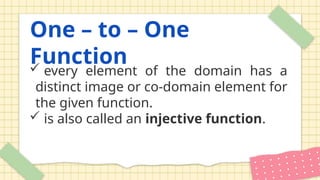
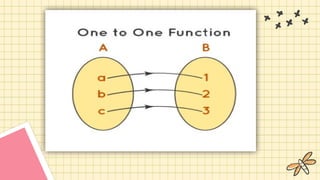
One – to– One
Function
every element of the domain has a
distinct image or co-domain element for
the given function.
is also called an injective function.
22.
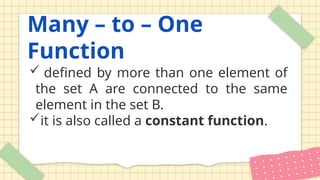
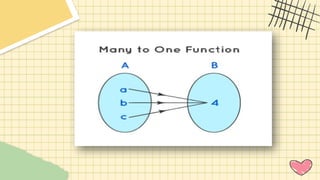
Many – to– One
Function
defined by more than one element of
the set A are connected to the same
element in the set B.
it is also called a constant function.
24.
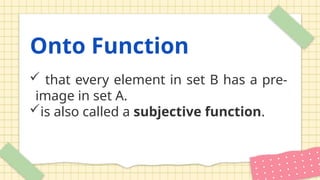
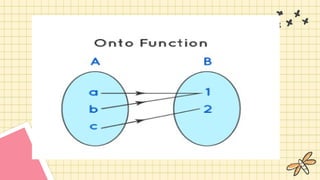
Onto Function
thatevery element in set B has a pre-
image in set A.
is also called a subjective function.
26.
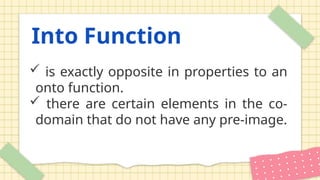
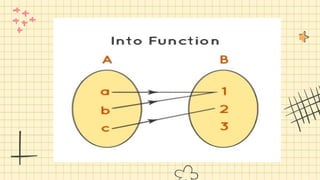
Into Function
isexactly opposite in properties to an
onto function.
there are certain elements in the co-
domain that do not have any pre-image.
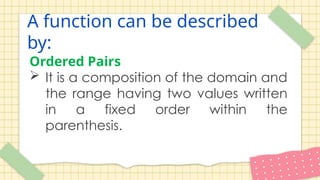
A function canbe described
by:
Ordered Pairs
It is a composition of the domain and
the range having two values written
in a fixed order within the
parenthesis.
31.
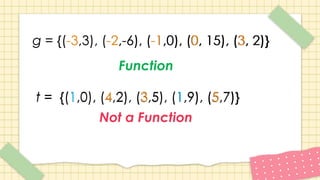
g = {(-3,3),(-2,-6), (-1,0), (0, 15), (3, 2)}
t = {(1,0), (4,2), (3,5), (1,9), (5,7)}
g = {(-3,3), (-2,-6), (-1,0), (0, 15), (3, 2)}
t = {(1,0), (4,2), (3,5), (1,9), (5,7)}
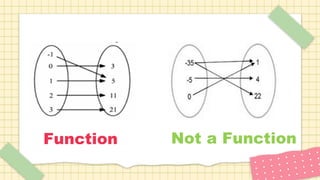
Function
Not a Function
32.
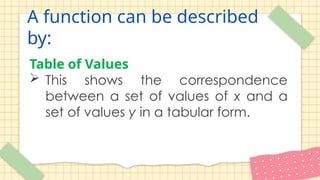
A function canbe described
by:
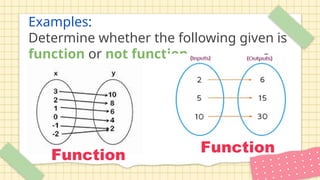
Table of Values
This shows the correspondence
between a set of values of x and a
set of values y in a tabular form.
33.
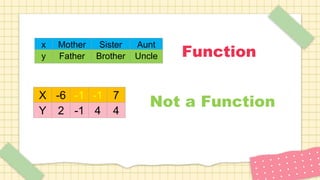
x Mother SisterAunt
y Father Brother Uncle
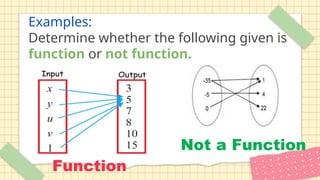
X -6 -1 -1 7
Y 2 -1 4 4
Function
X -6 -1 -1 7
Y 2 -1 4 4
Not a Function
34.
A function canbe described
by:
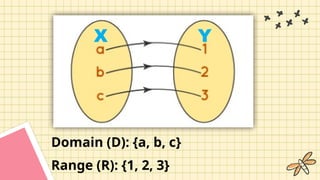
Mapping Diagram
It is like a flow chart for functions, showing
the input (x) and output (y) values. A
mapping diagram consists of two parallel
columns and arrows that are drawn from
domain and range, to represent the relation
between two elements.
A function canbe described
by:
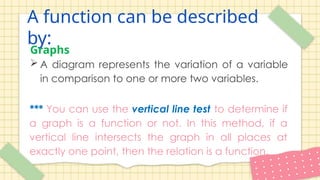
Graphs
A diagram represents the variation of a variable
in comparison to one or more two variables.
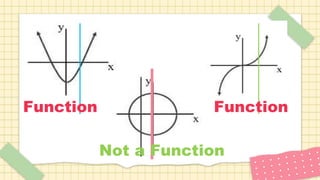
*** You can use the vertical line test to determine if
a graph is a function or not. In this method, if a
vertical line intersects the graph in all places at
exactly one point, then the relation is a function.
A function canbe described
by:
Functions in Real – Life
In the real world, functions are mathematical
representations of many input-output
situations.
39.
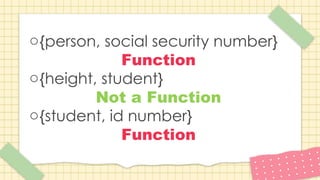
o{person, social securitynumber}
Function
o{height, student}
Not a Function
o{student, id number}
Function
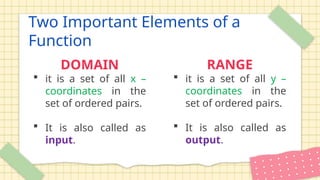
Two Important Elementsof a
Function
DOMAIN
it is a set of all x –
coordinates in the
set of ordered pairs.
It is also called as
input.
RANGE
it is a set of all y –
coordinates in the
set of ordered pairs.
It is also called as
output.
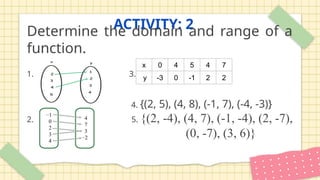
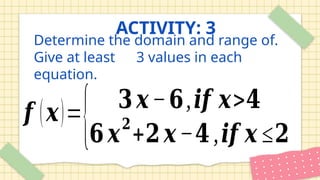
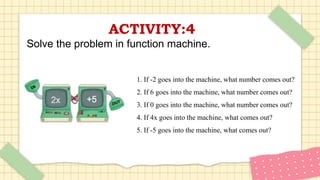
ACTIVITY:4
Solve the problemin function machine.
1. If -2 goes into the machine, what number comes out?
2. If 6 goes into the machine, what number comes out?
3. If 0 goes into the machine, what number comes out?
4. If 4x goes into the machine, what comes out?
5. If -5 goes into the machine, what comes out?
Factoring Polynomials
●Factoring isthe process of finding the
factors of a number or polynomial. It
is the simplest way to solve equations
of a higher degree. Although you
should already be proficient in
factoring, here are the methods you
should be familiar with, in case you
need to review.
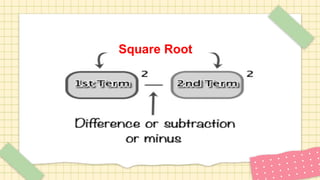
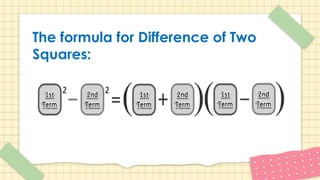
The difference ofthe two squares is the
most common. This form is very easy to
identify. Whenever you have a binomial
term and they have subtraction as the
middle sign, you are guaranteed to have
the case of difference of two squares.
Difference of Two Squares (DTS)
Perfect Square Trinomials
(PST)
Aperfect square trinomial is the square
of a binomial. It follows a pattern when
it is factored so that the first and last
terms are perfect squares of monomials
and the middle term is twice their
product.
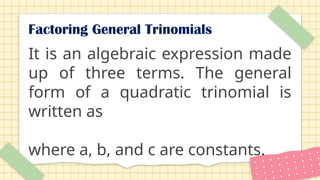
Factoring General Trinomials
Itis an algebraic expression made
up of three terms. The general
form of a quadratic trinomial is
written as
where a, b, and c are constants.