Download as PDF, PPTX


![Fluentd
▷ fluent-agent-lite_exporter
○ Tagamoris fluent-agent-lite [1]
○ https://github.com/matsumana/fluent-agent-lite_exporter
○ [1] https://github.com/tagomoris/fluent-agent-lite
▷ fluent-plugin-prometheus
○ fluentd → monitor_agent → fluent-plugin-prometheus
○ http://prometheus:9090/metrics → `fluent-plugin-prometheus` → fluentd
○ https://github.com/fluent/fluent-plugin-prometheus
▷ fluentd_exporter
○ Release,
○ https://github.com/wyukawa/fluentd_exporter
▷ fluentd_exporter
○ http://fluentd:9224/metrics → `fluentd_exporter` (by V3ckt0r) → prometheus
○ https://github.com/wyukawa/fluentd_exporter
27](https://image.slidesharecdn.com/fullstackmonitoringwithprometheus-180210035113/75/Full-Stack-Monitoring-with-Prometheus-and-Grafana-27-2048.jpg)


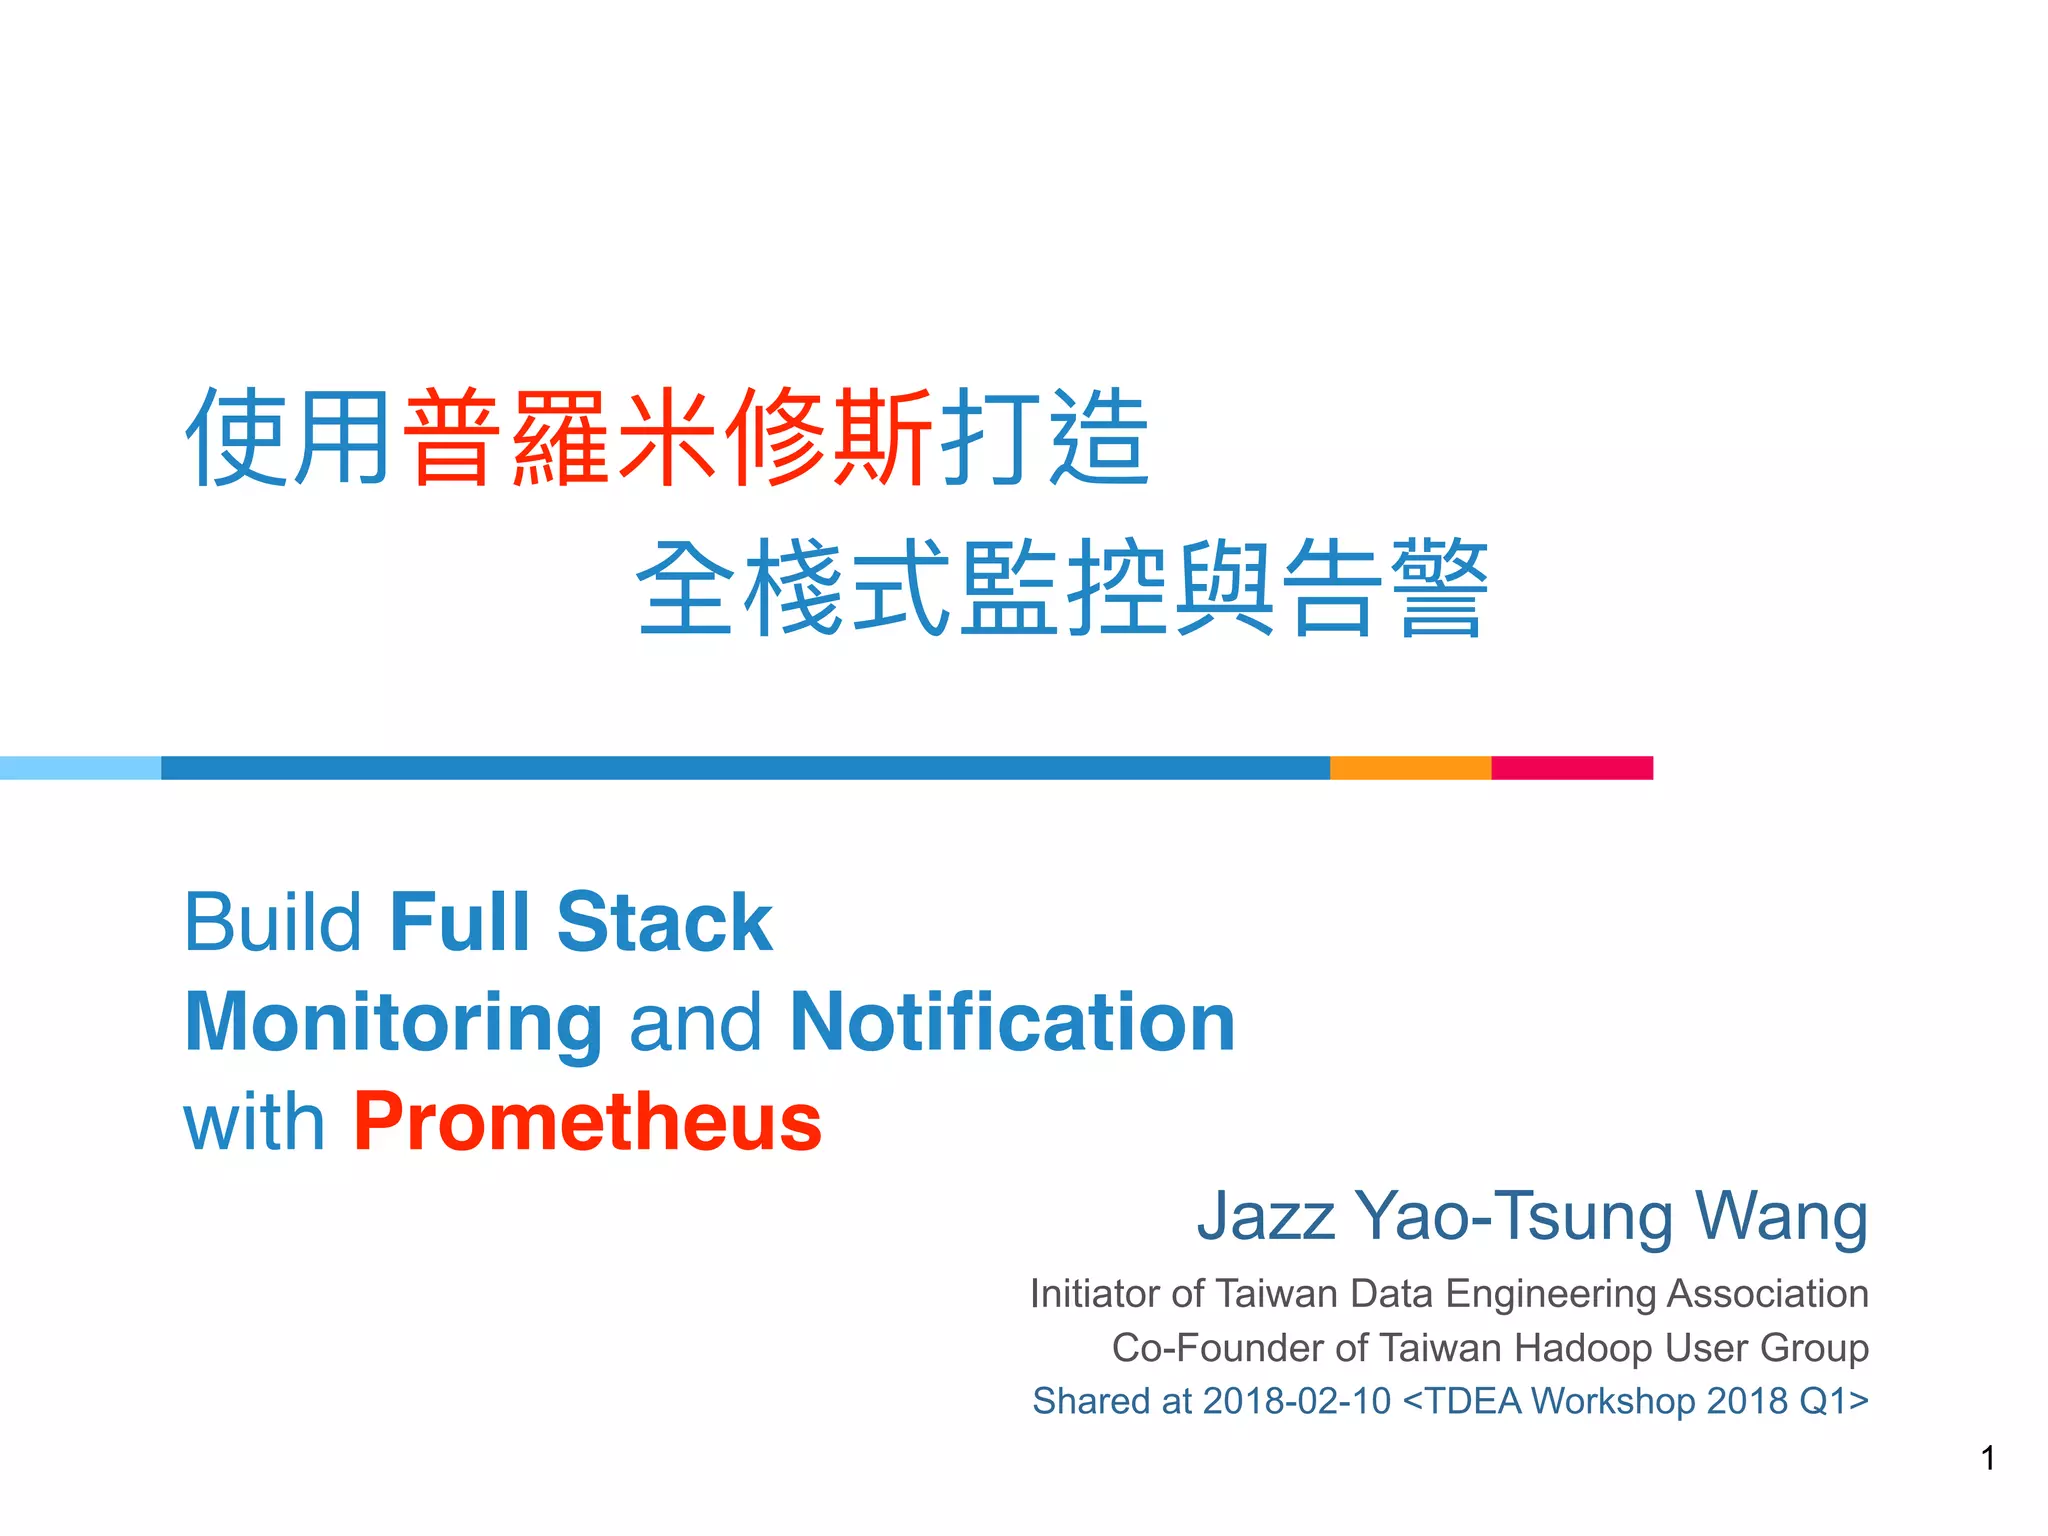
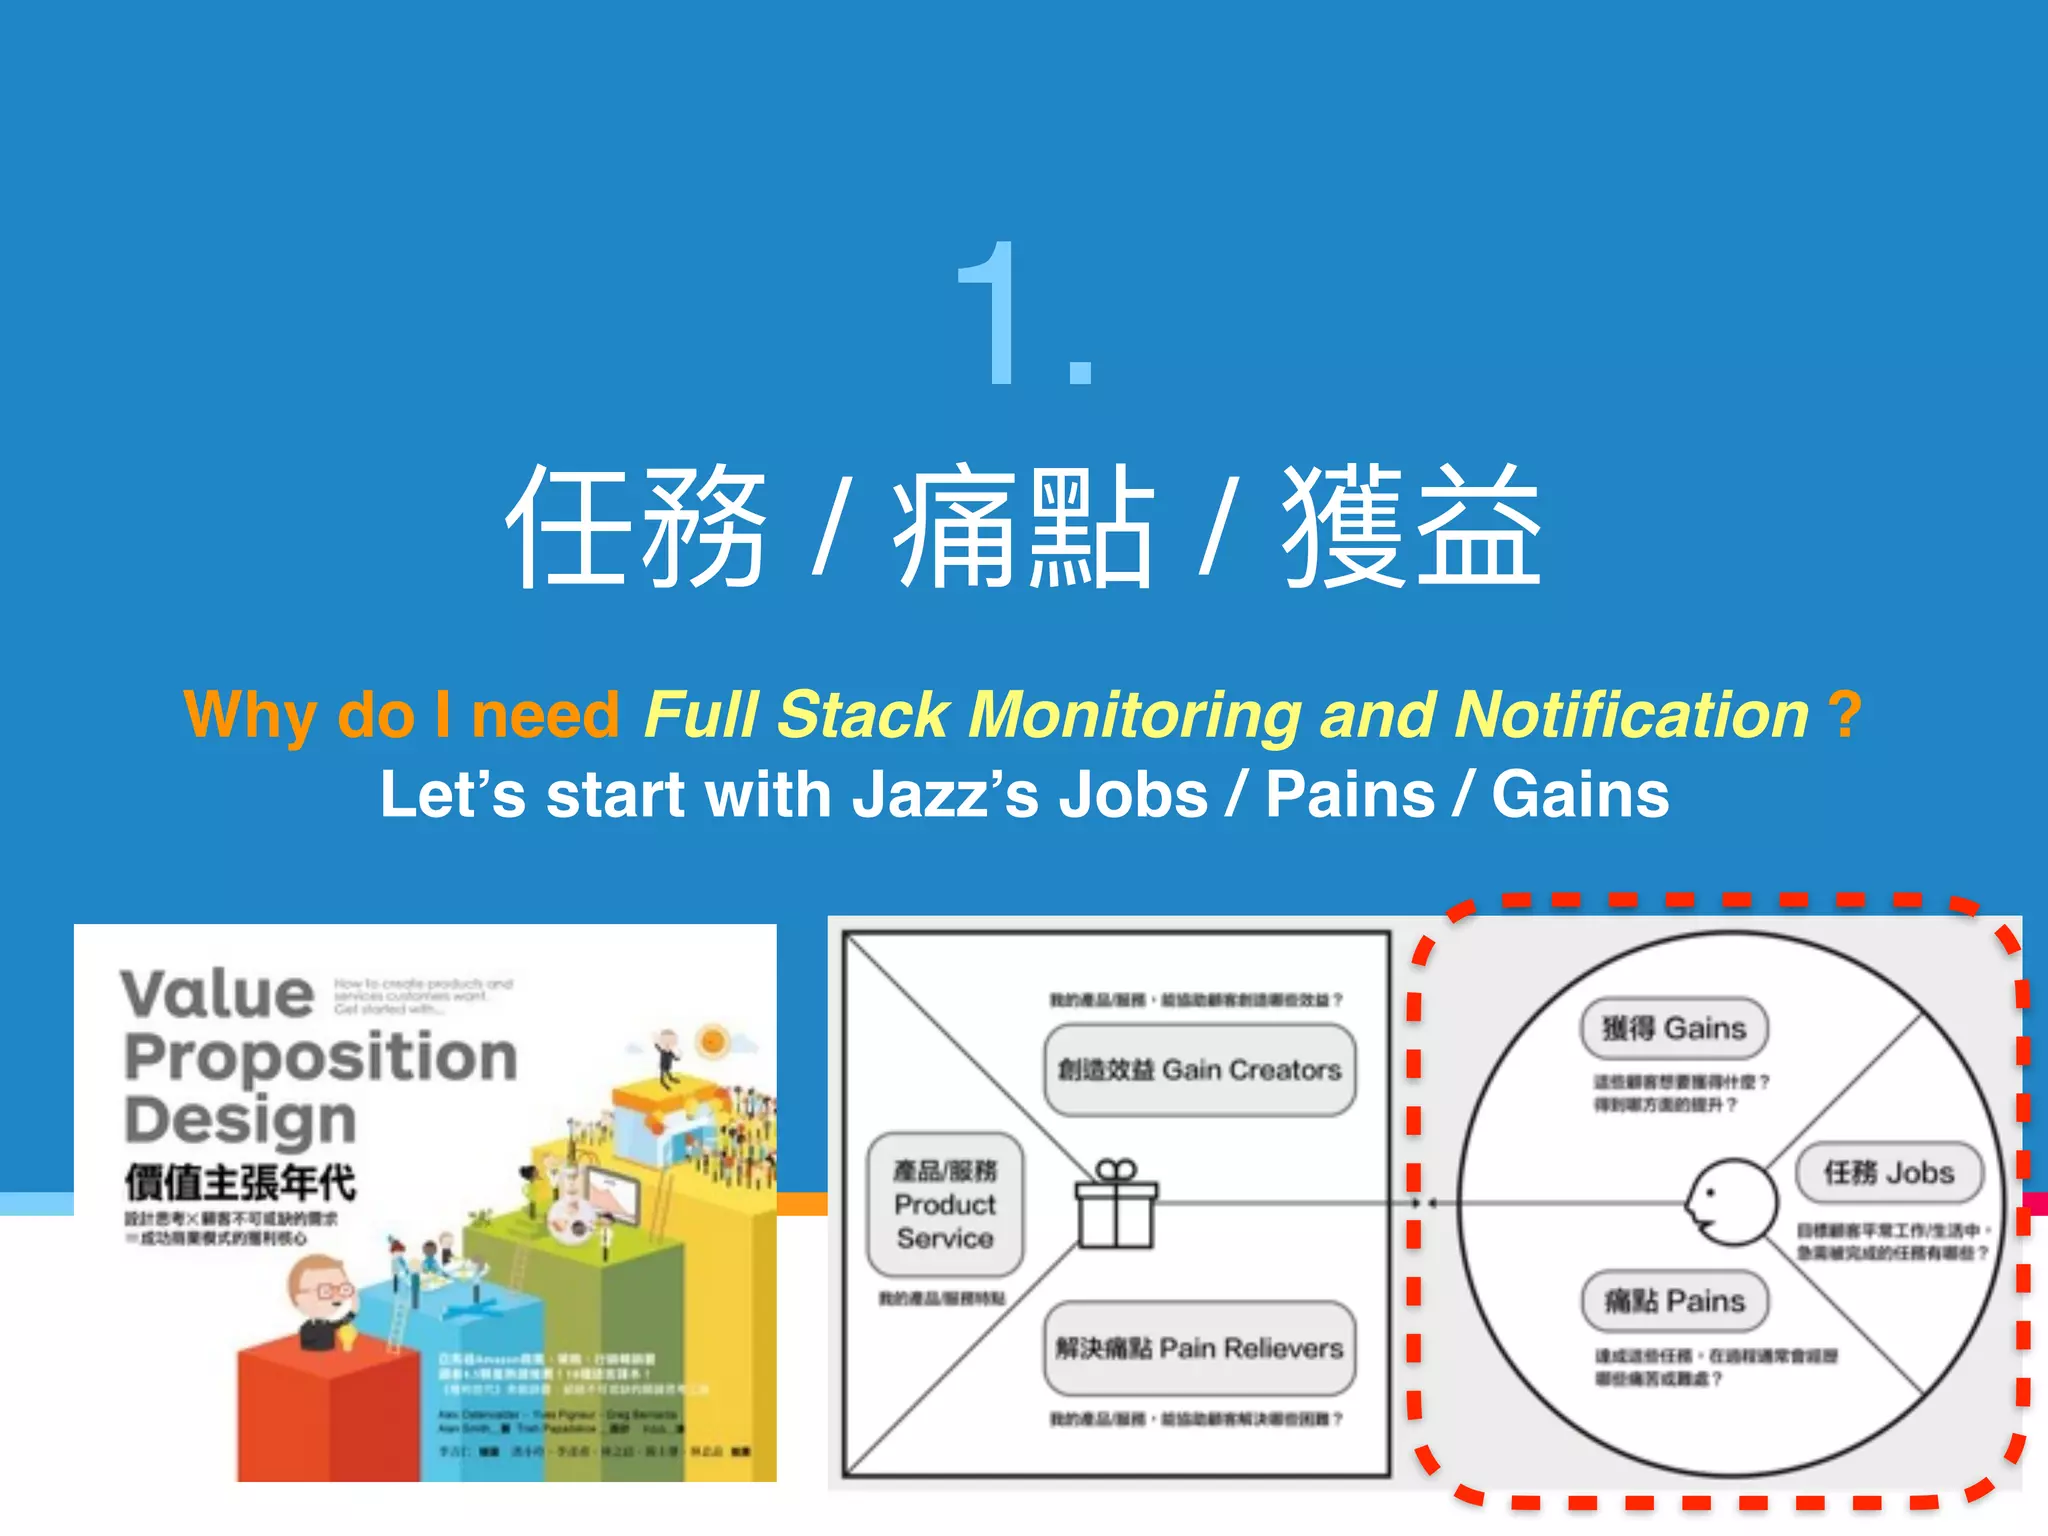
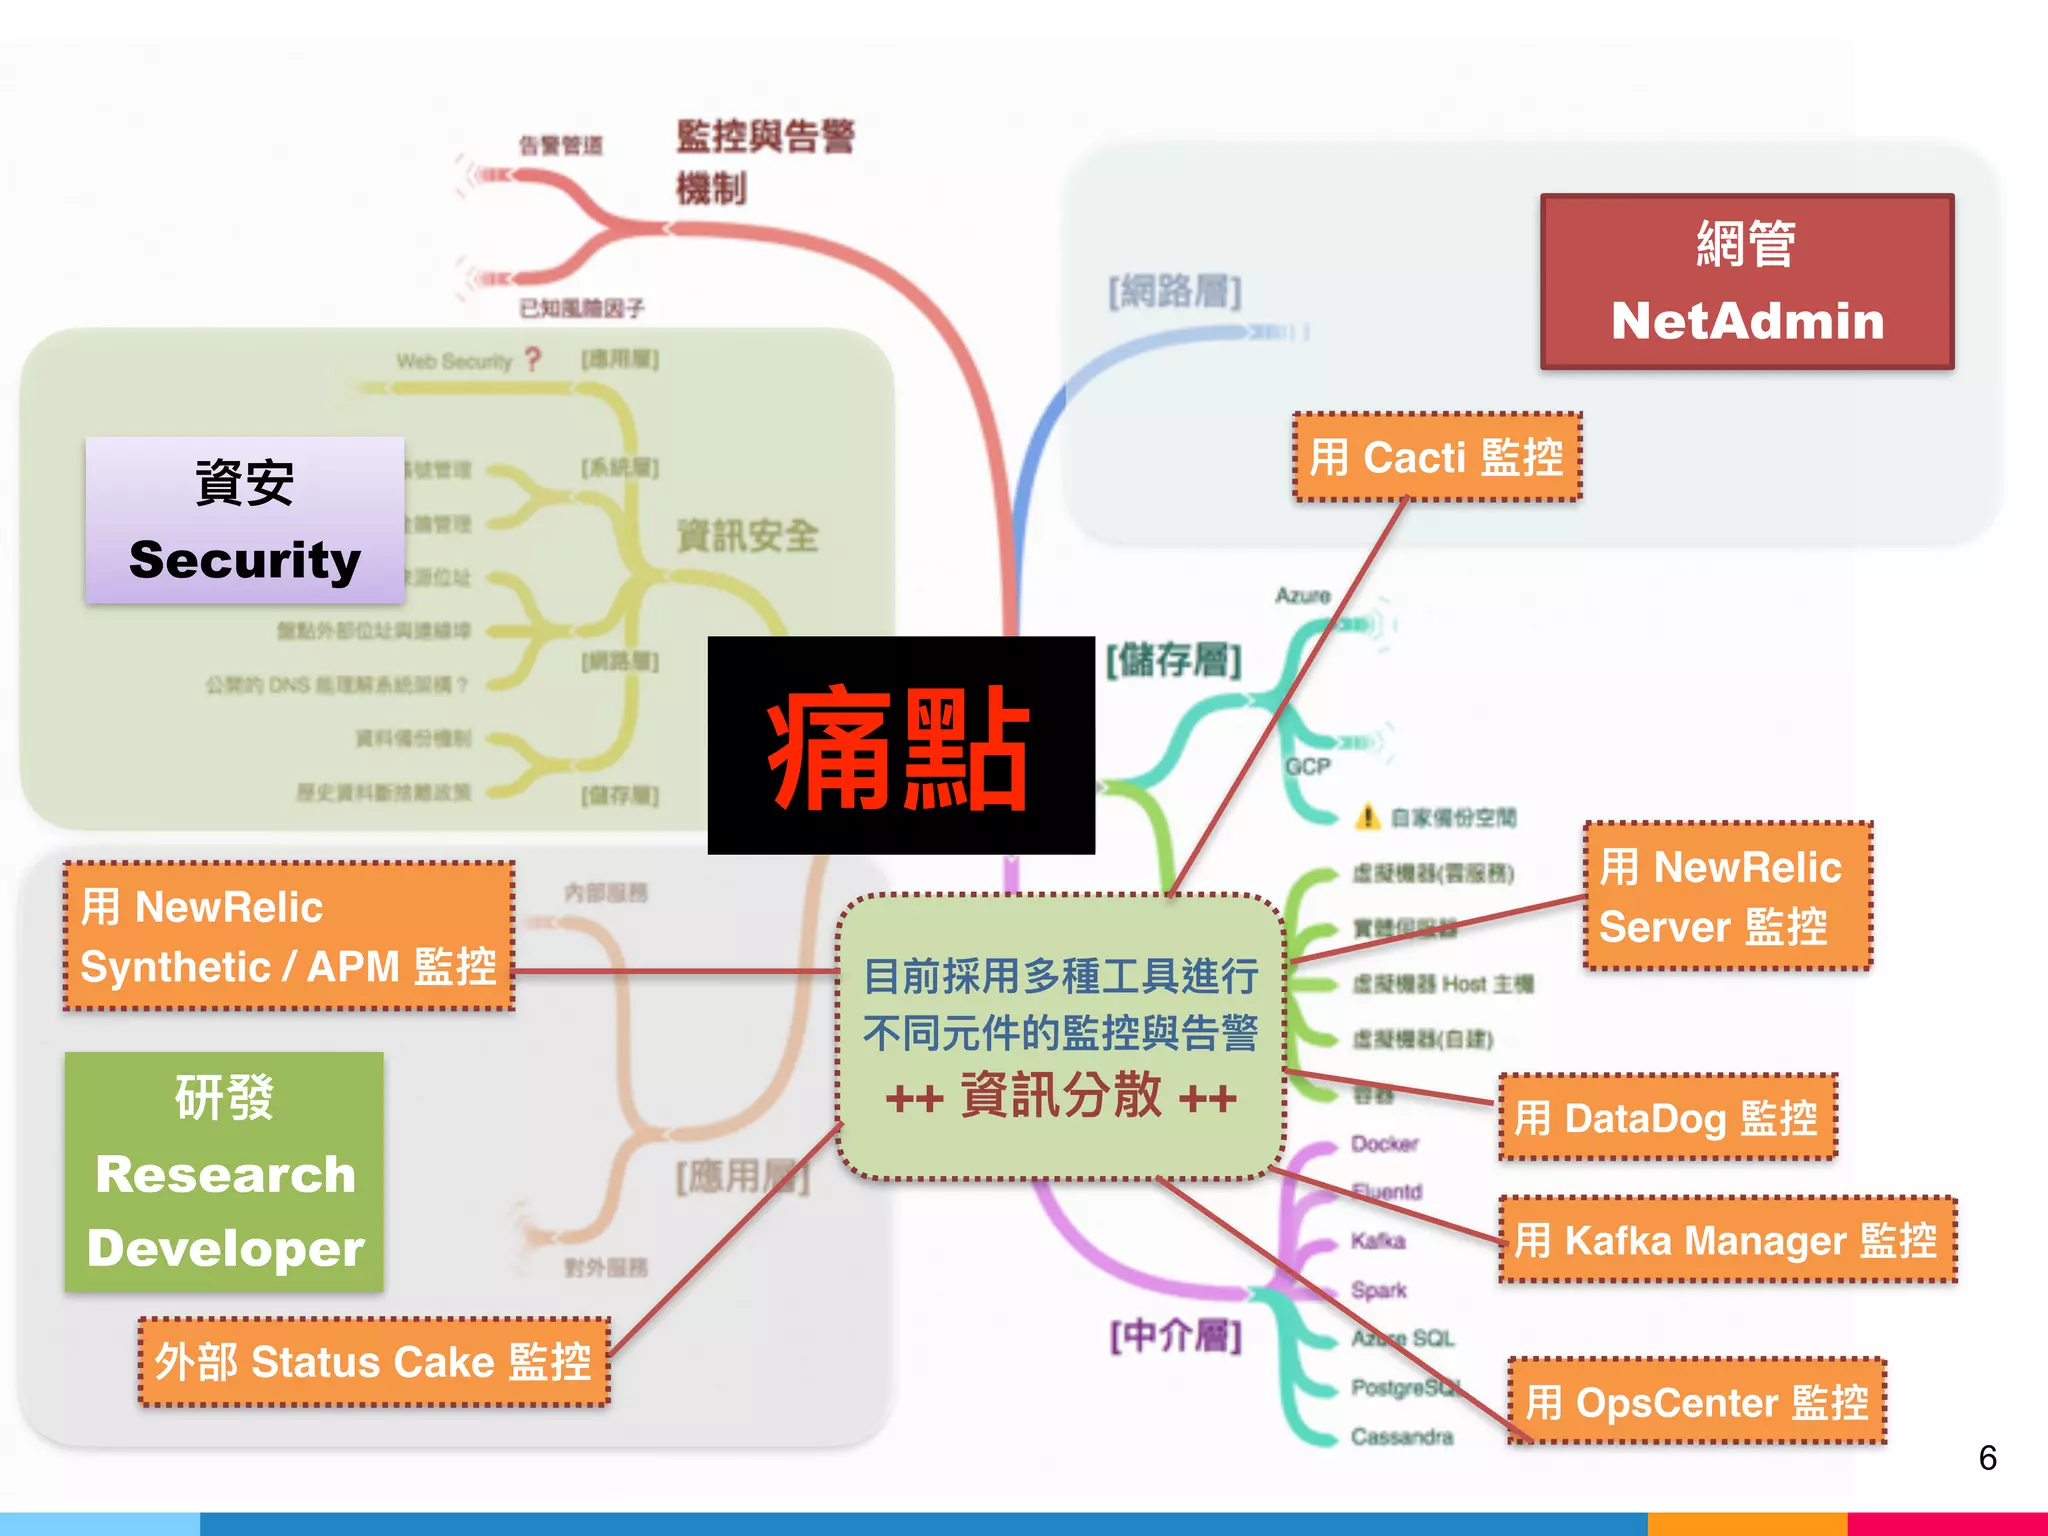
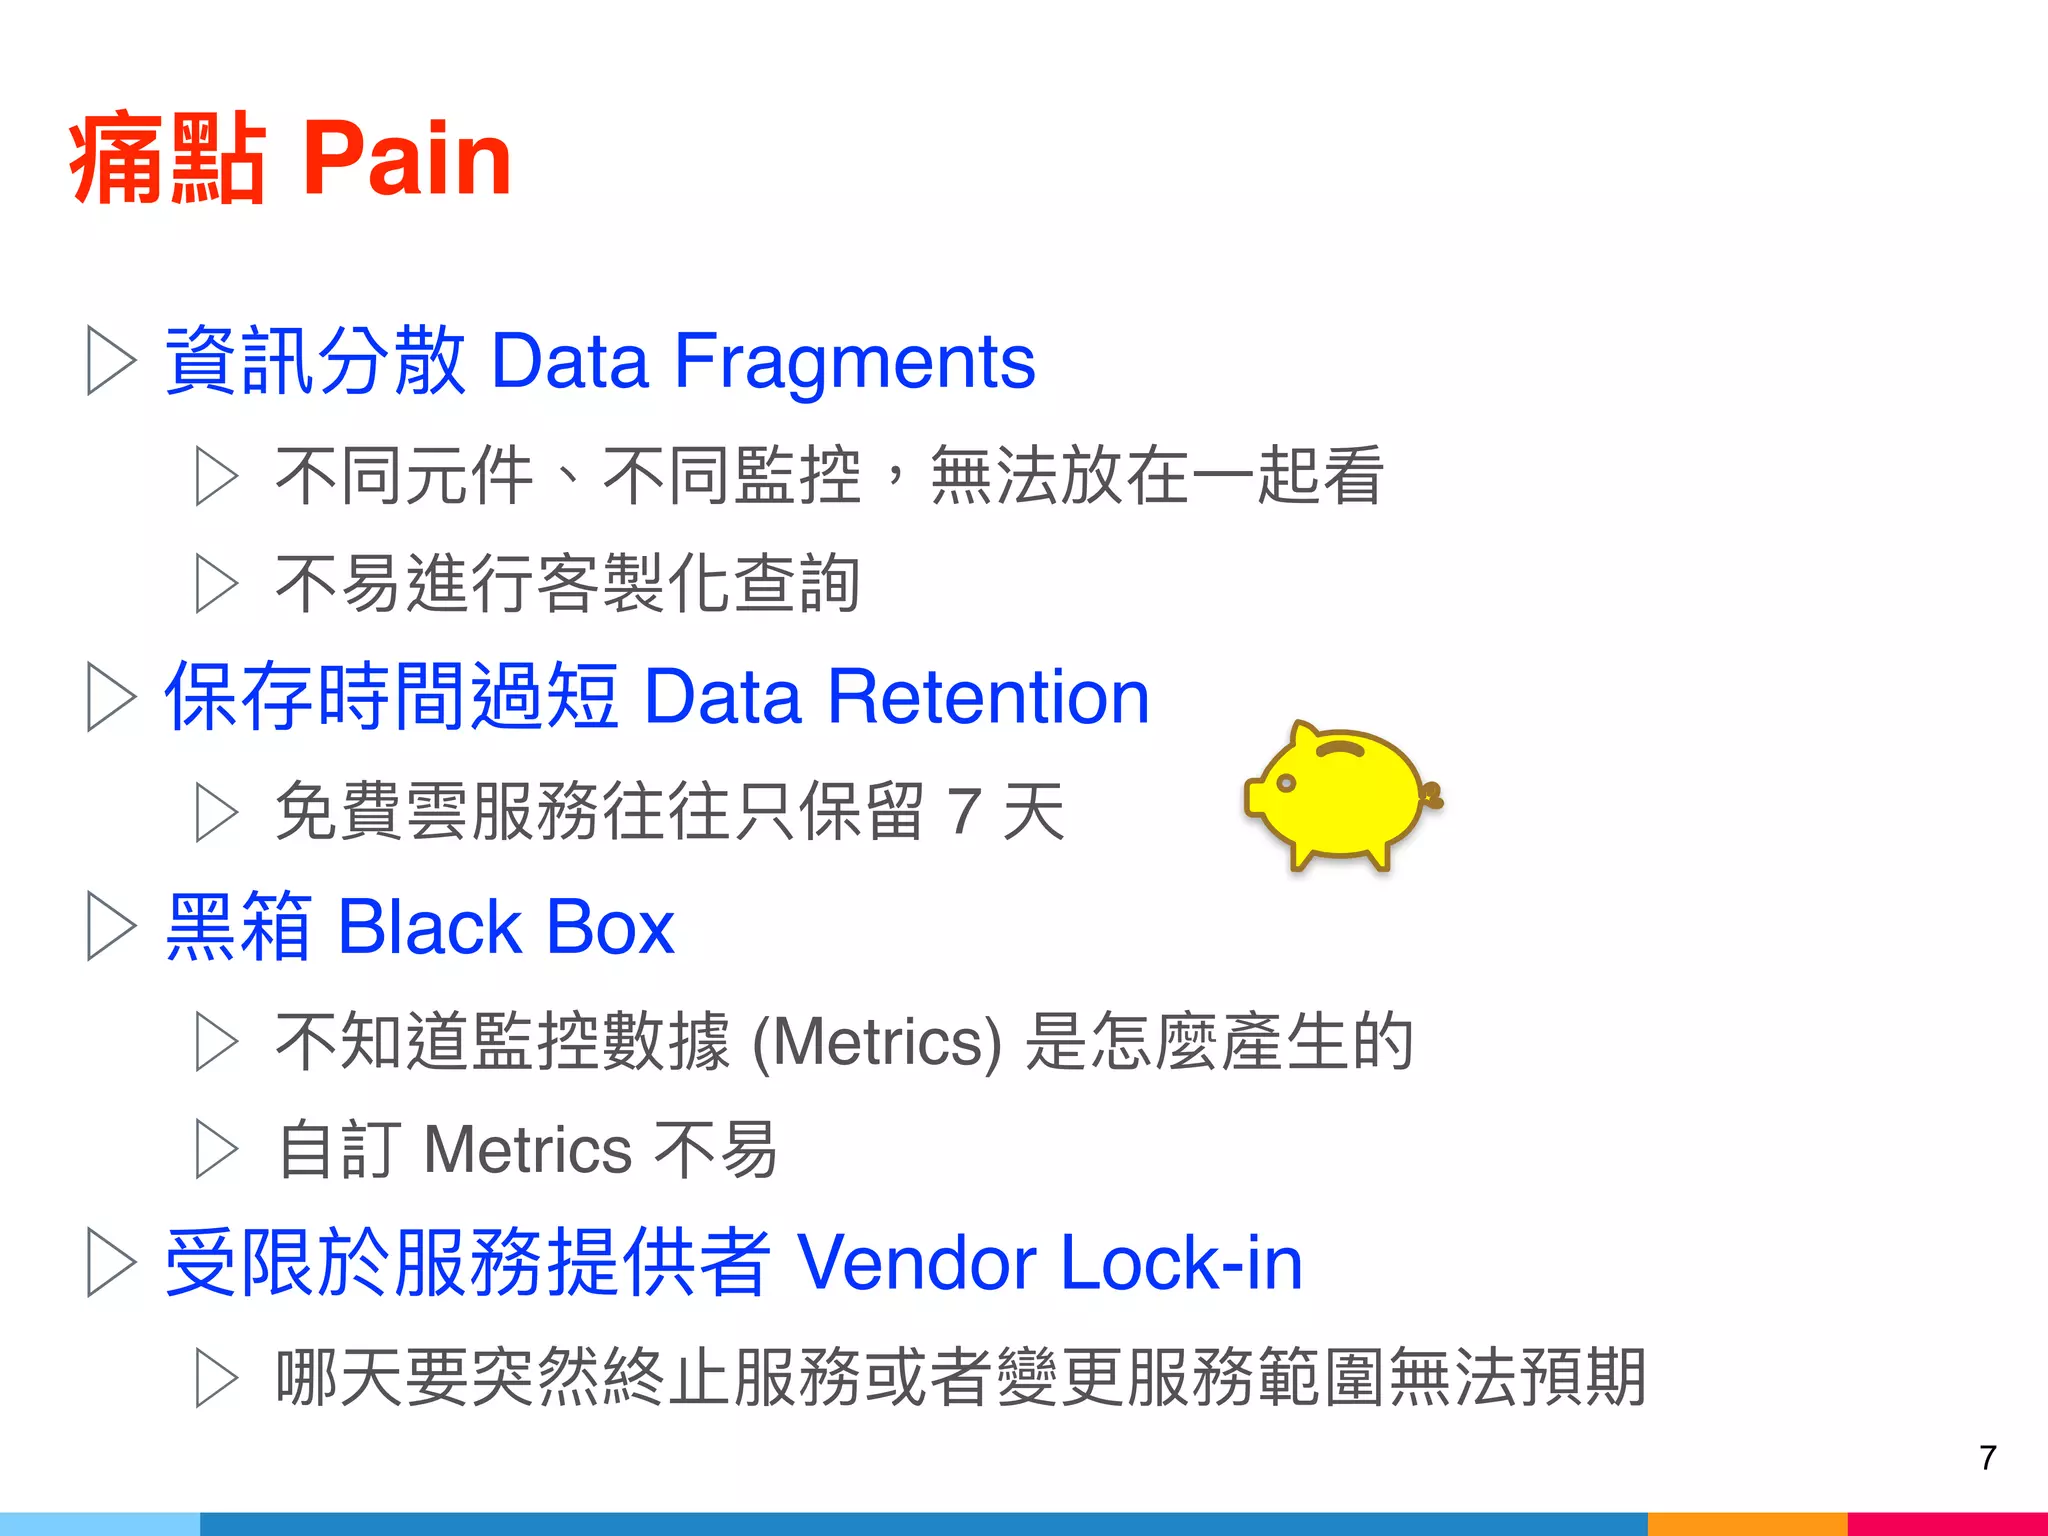
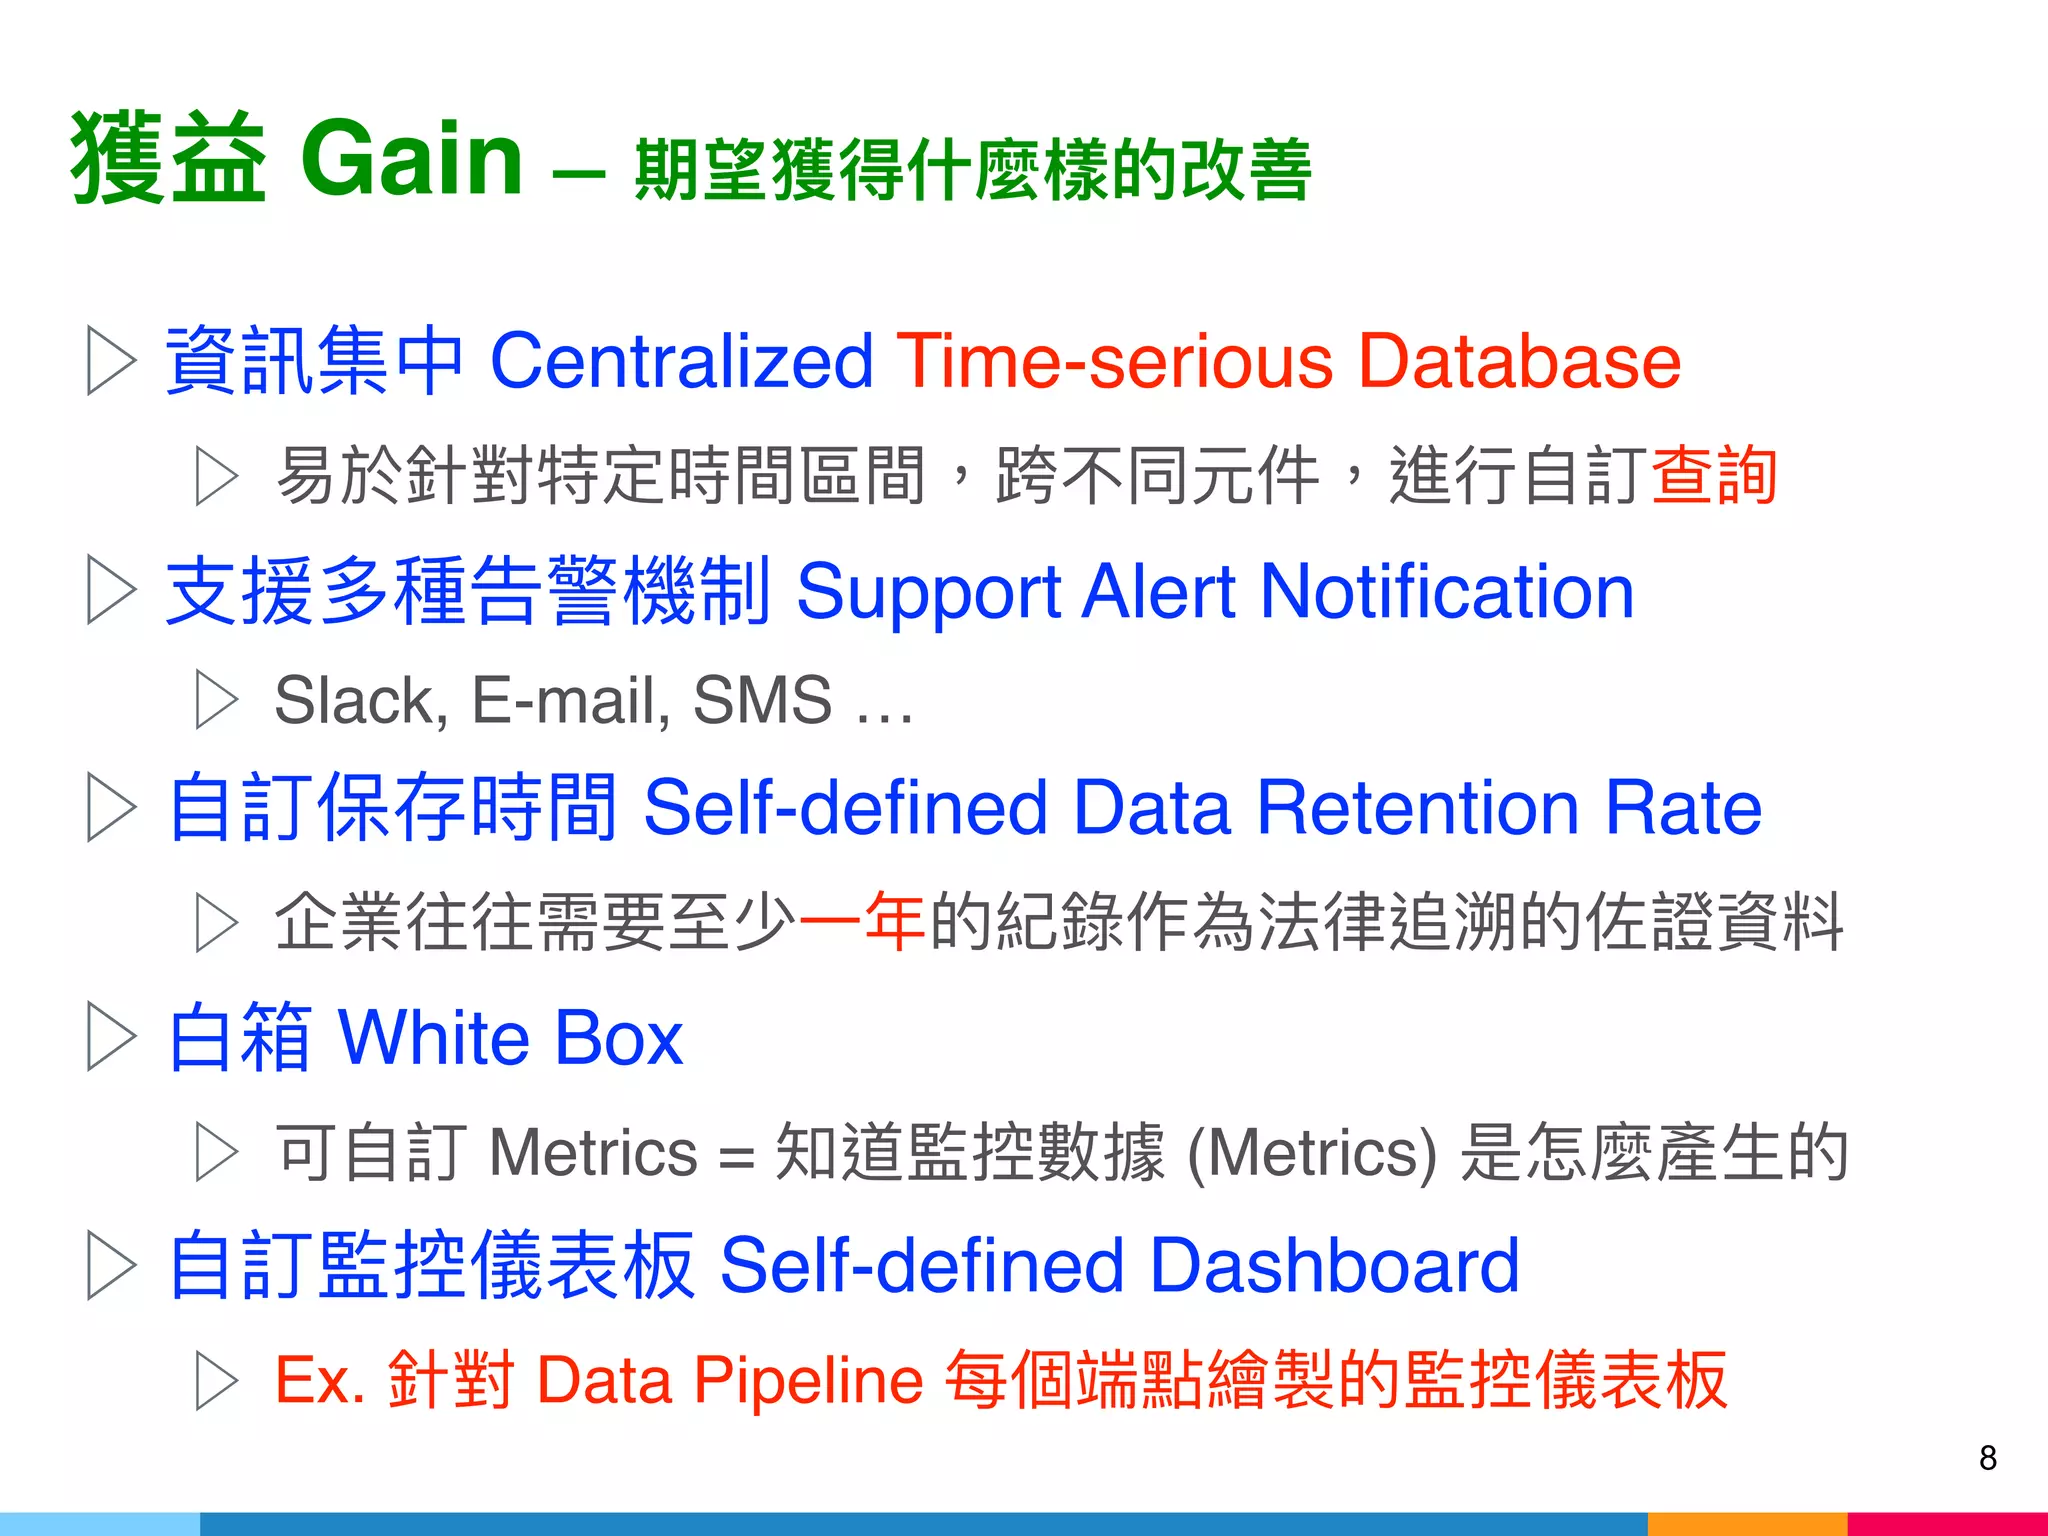
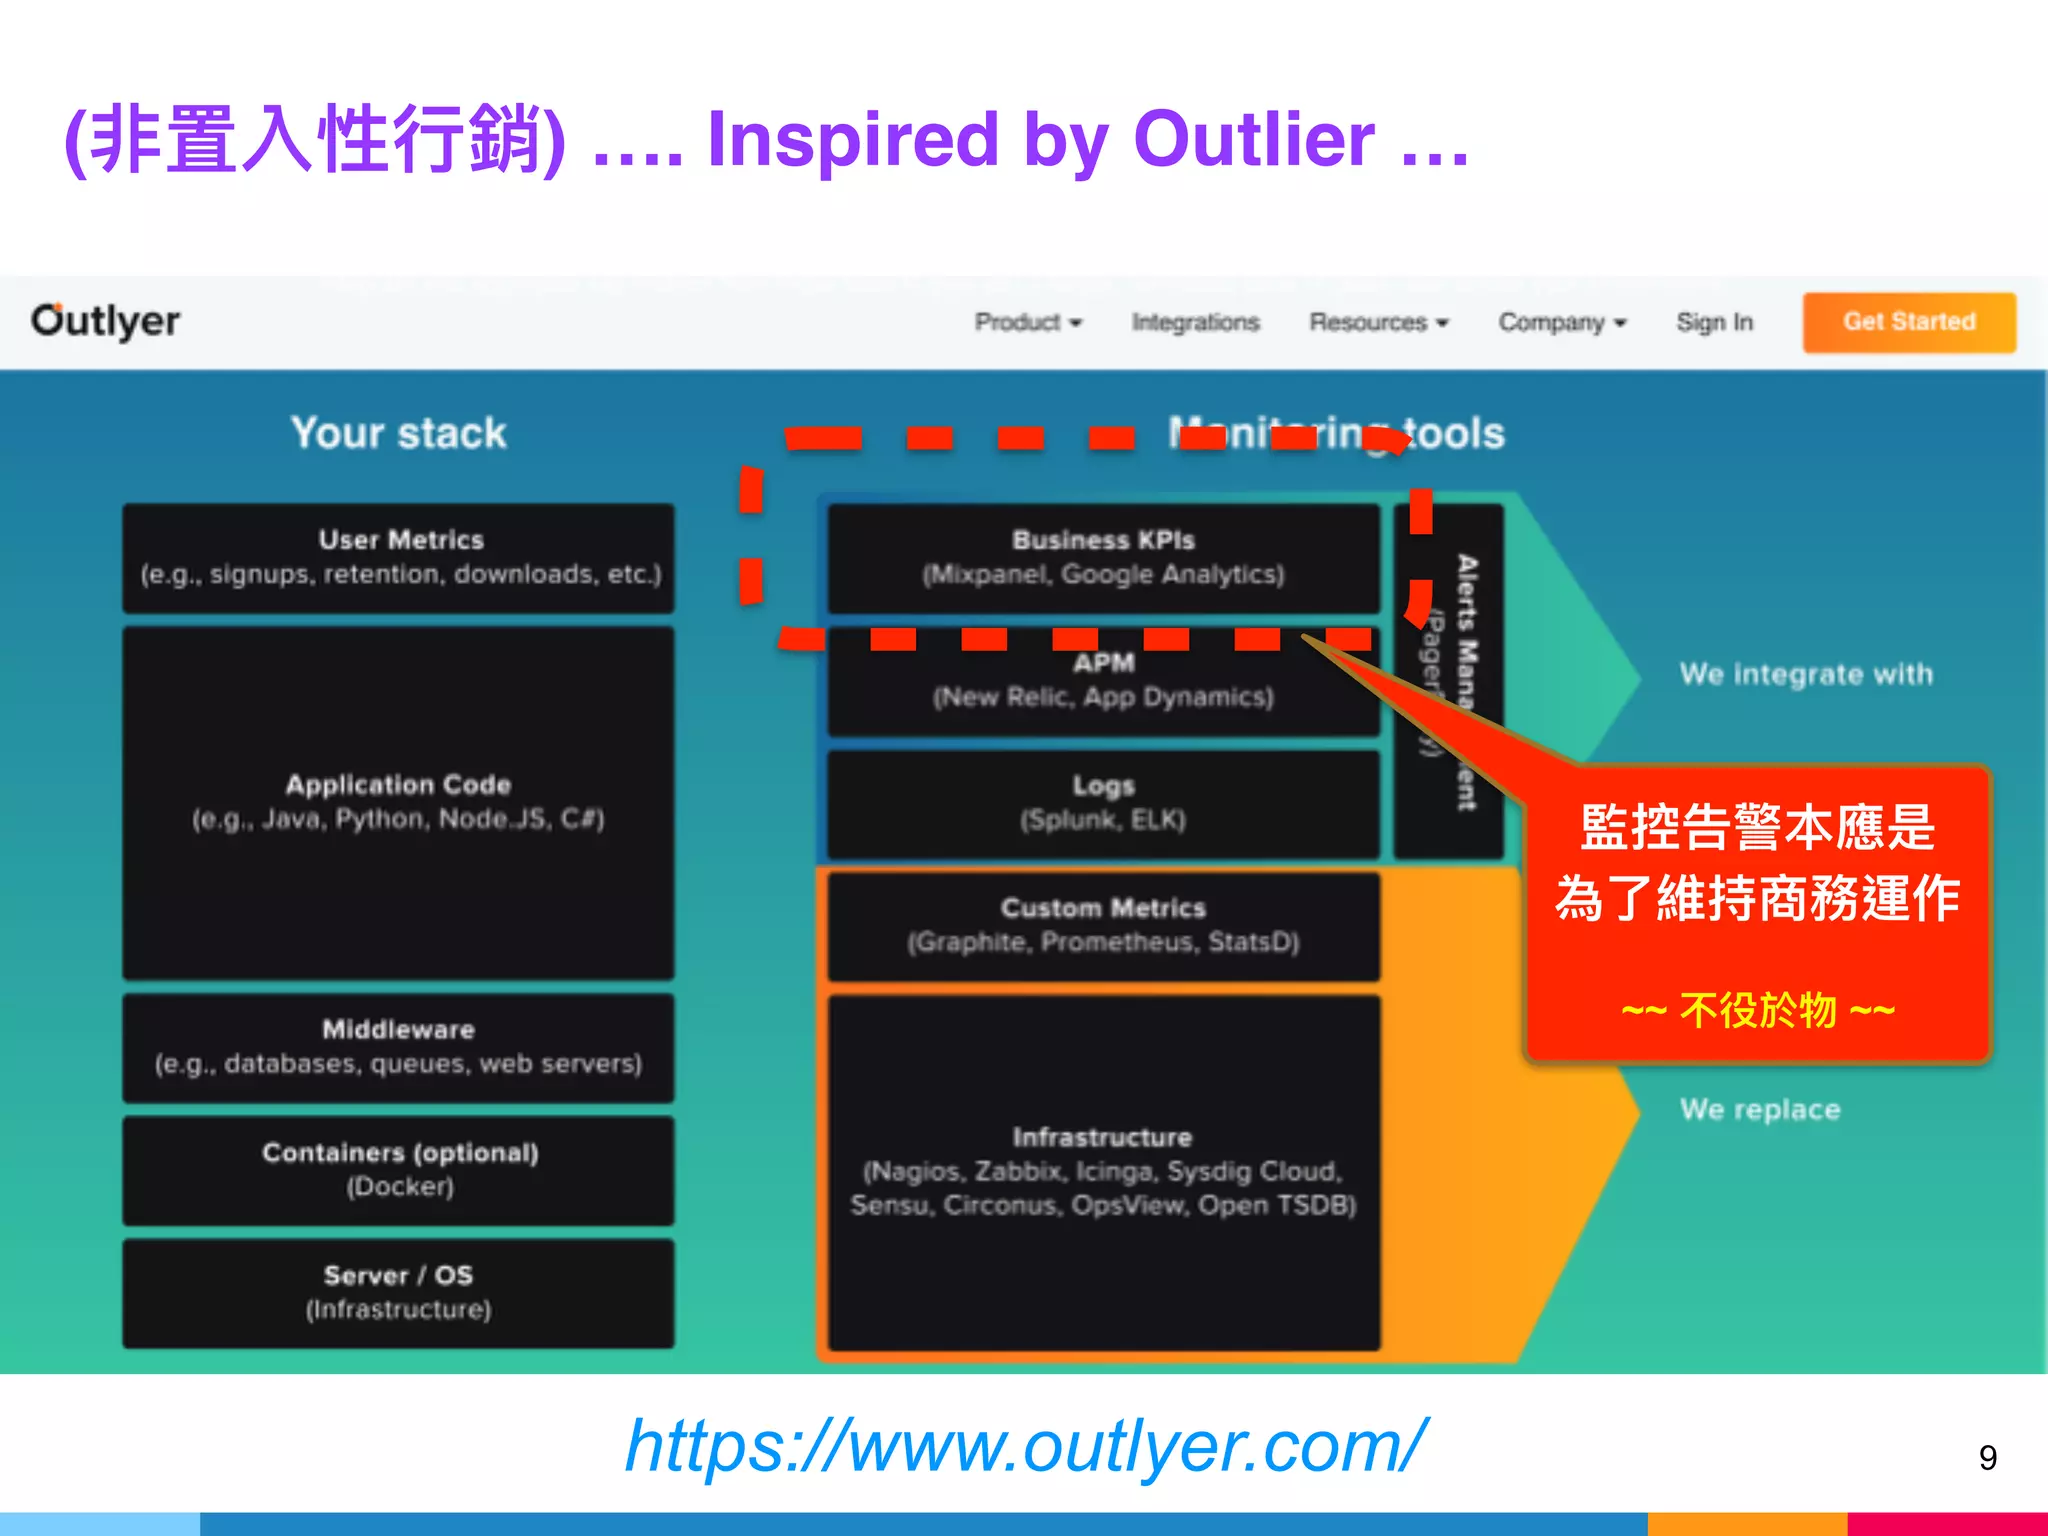
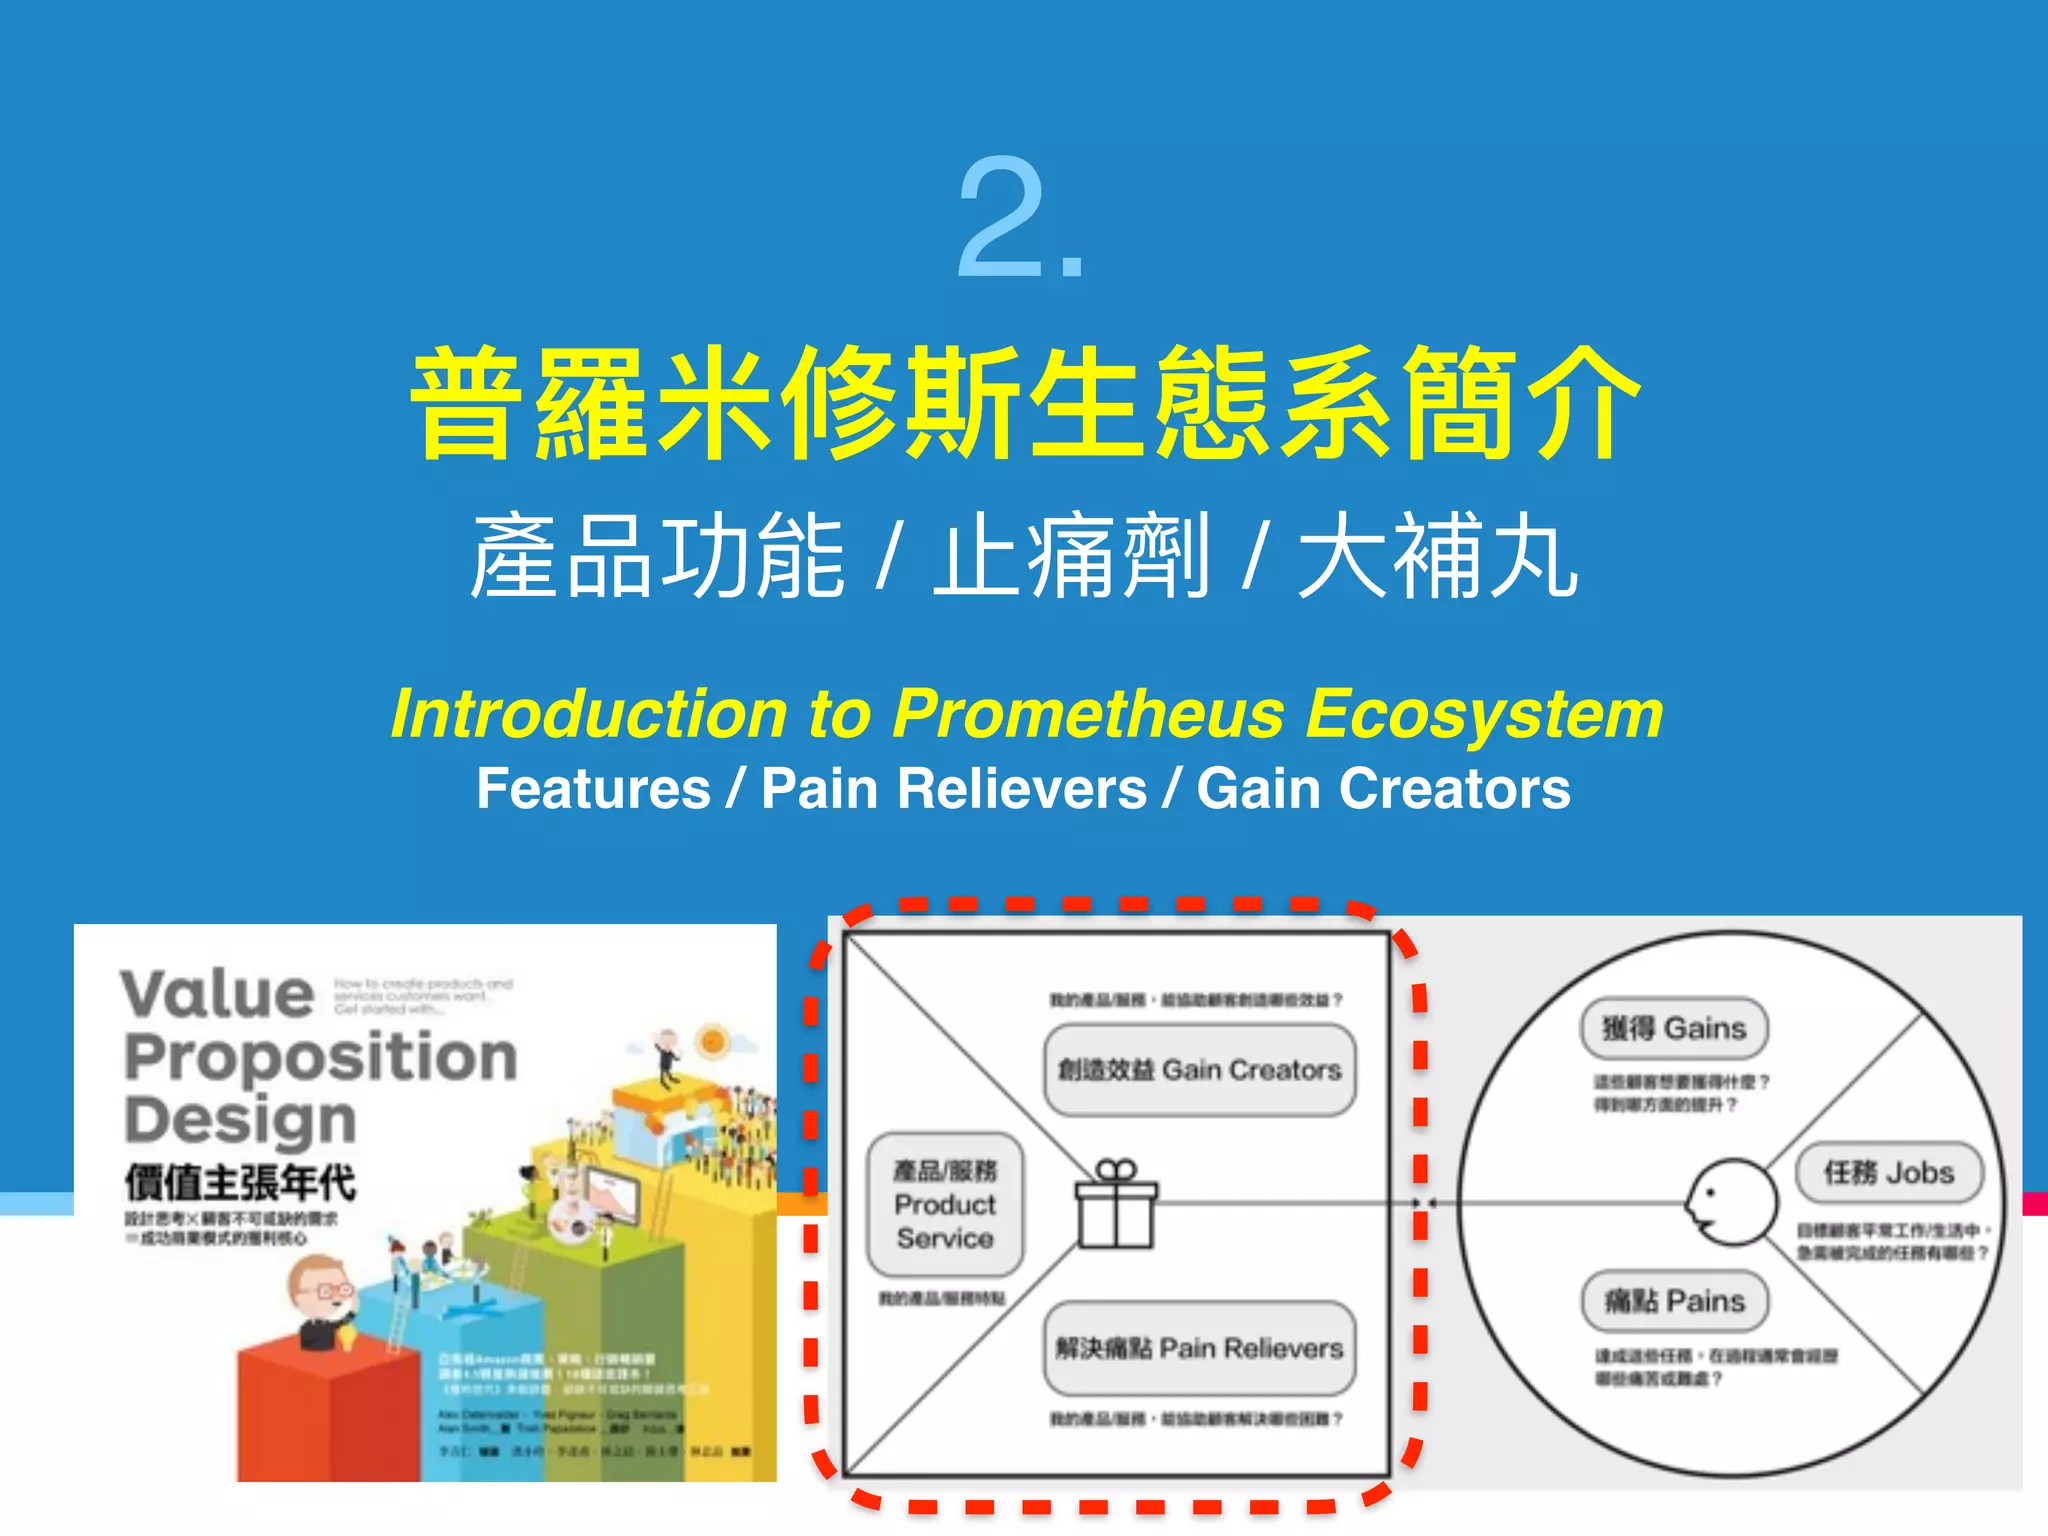
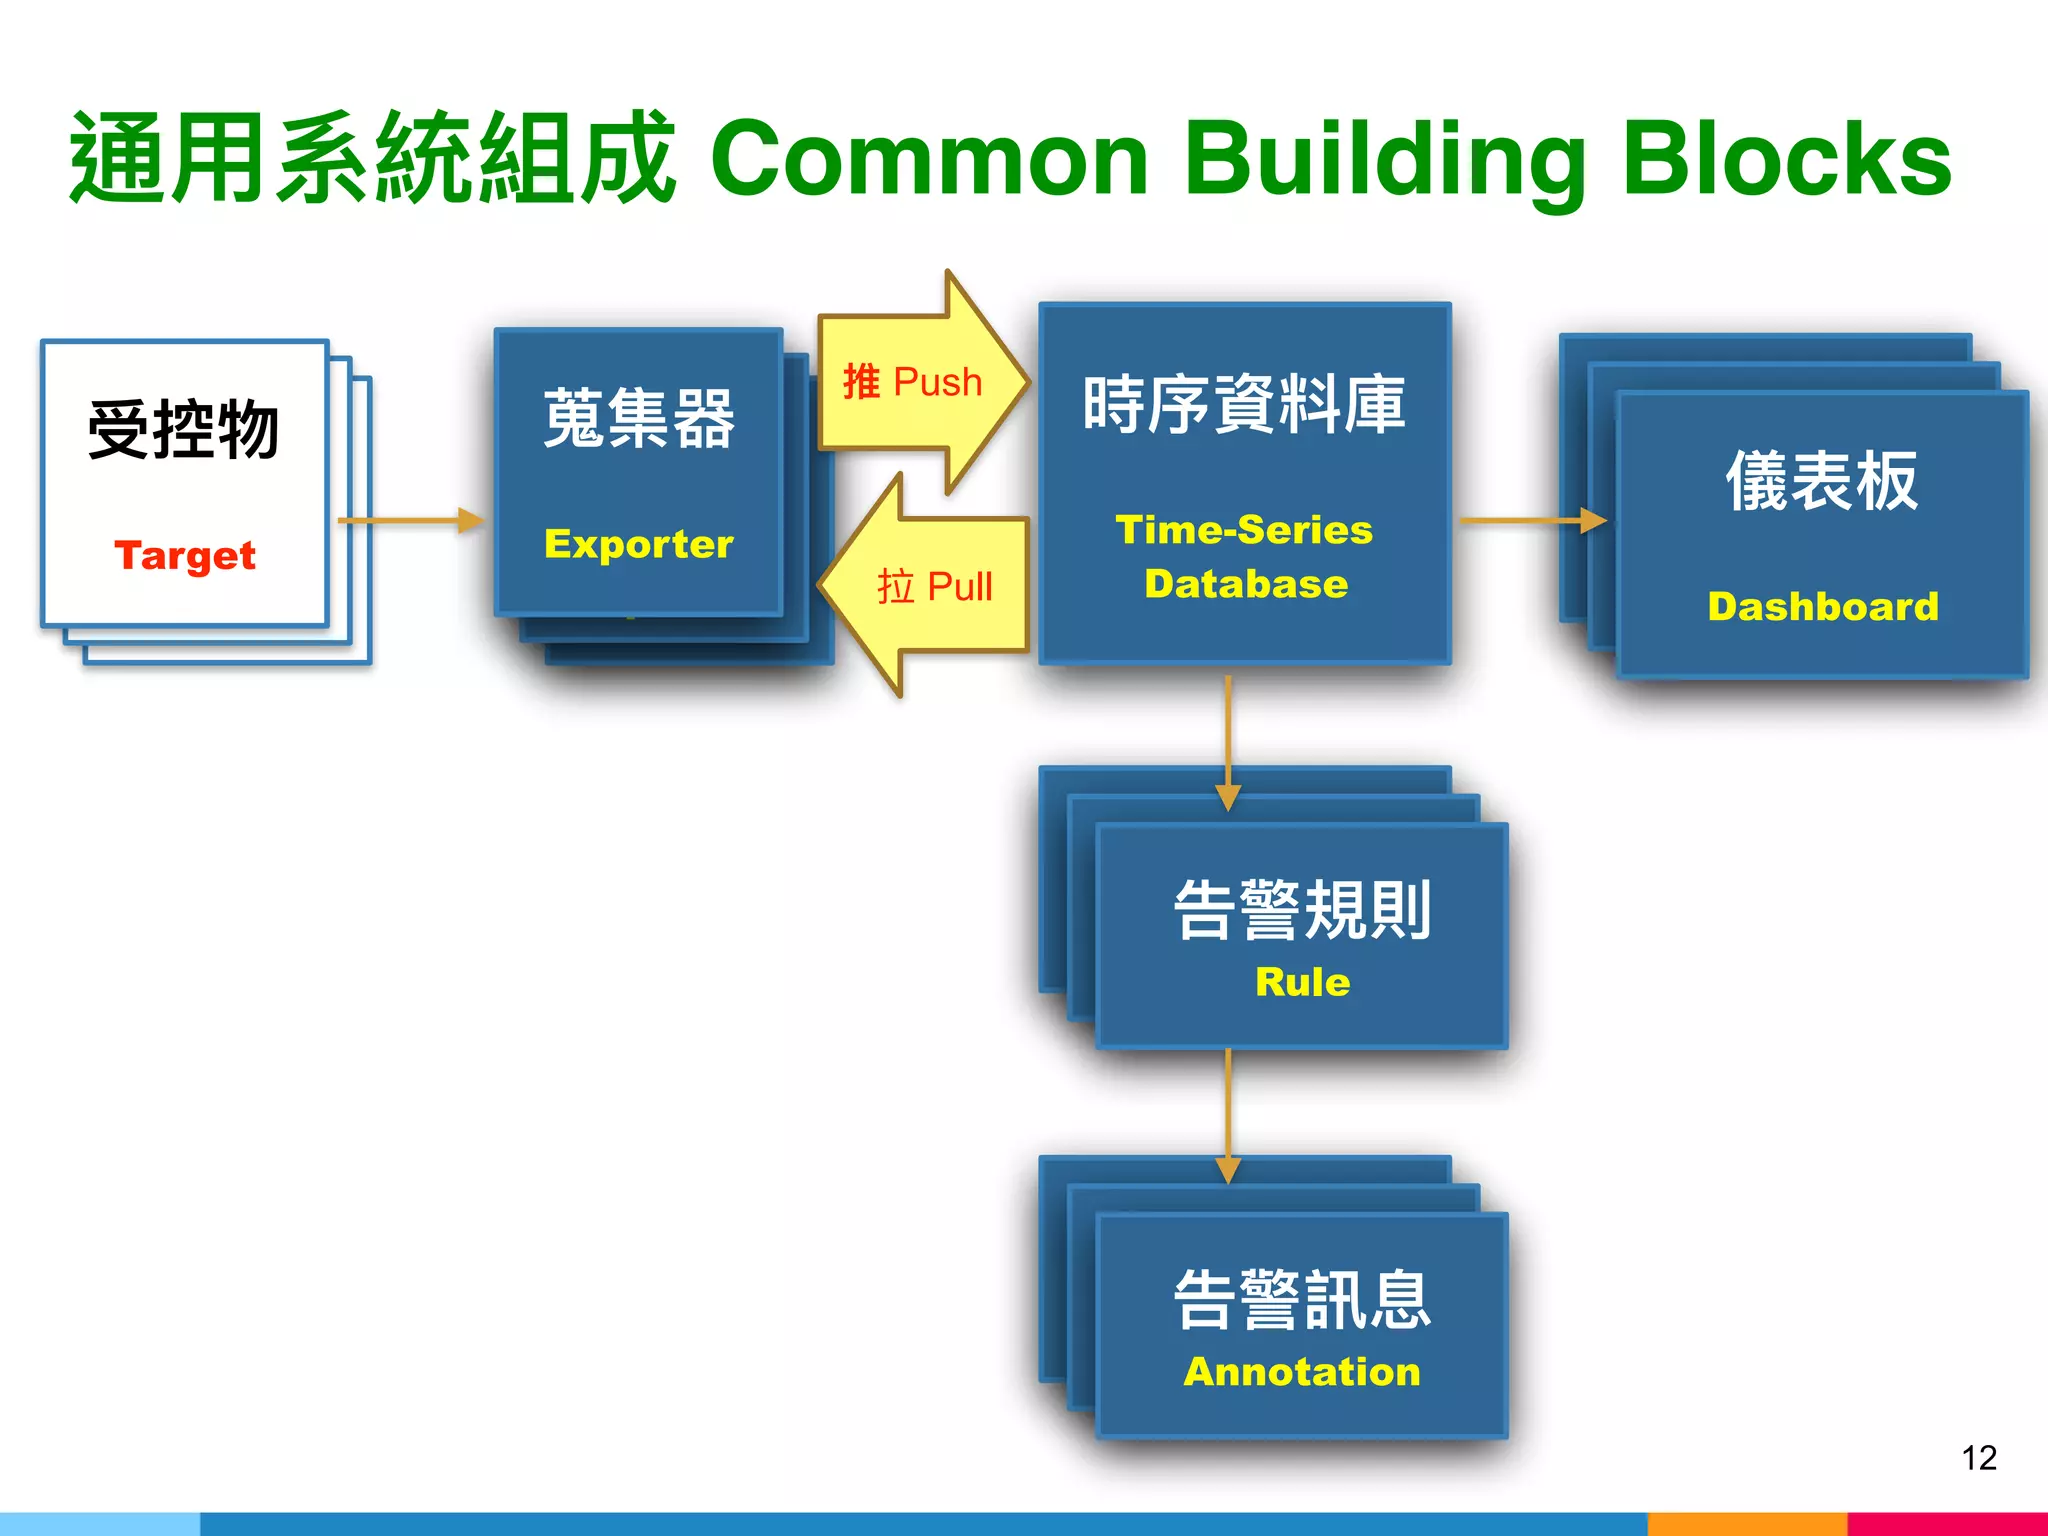
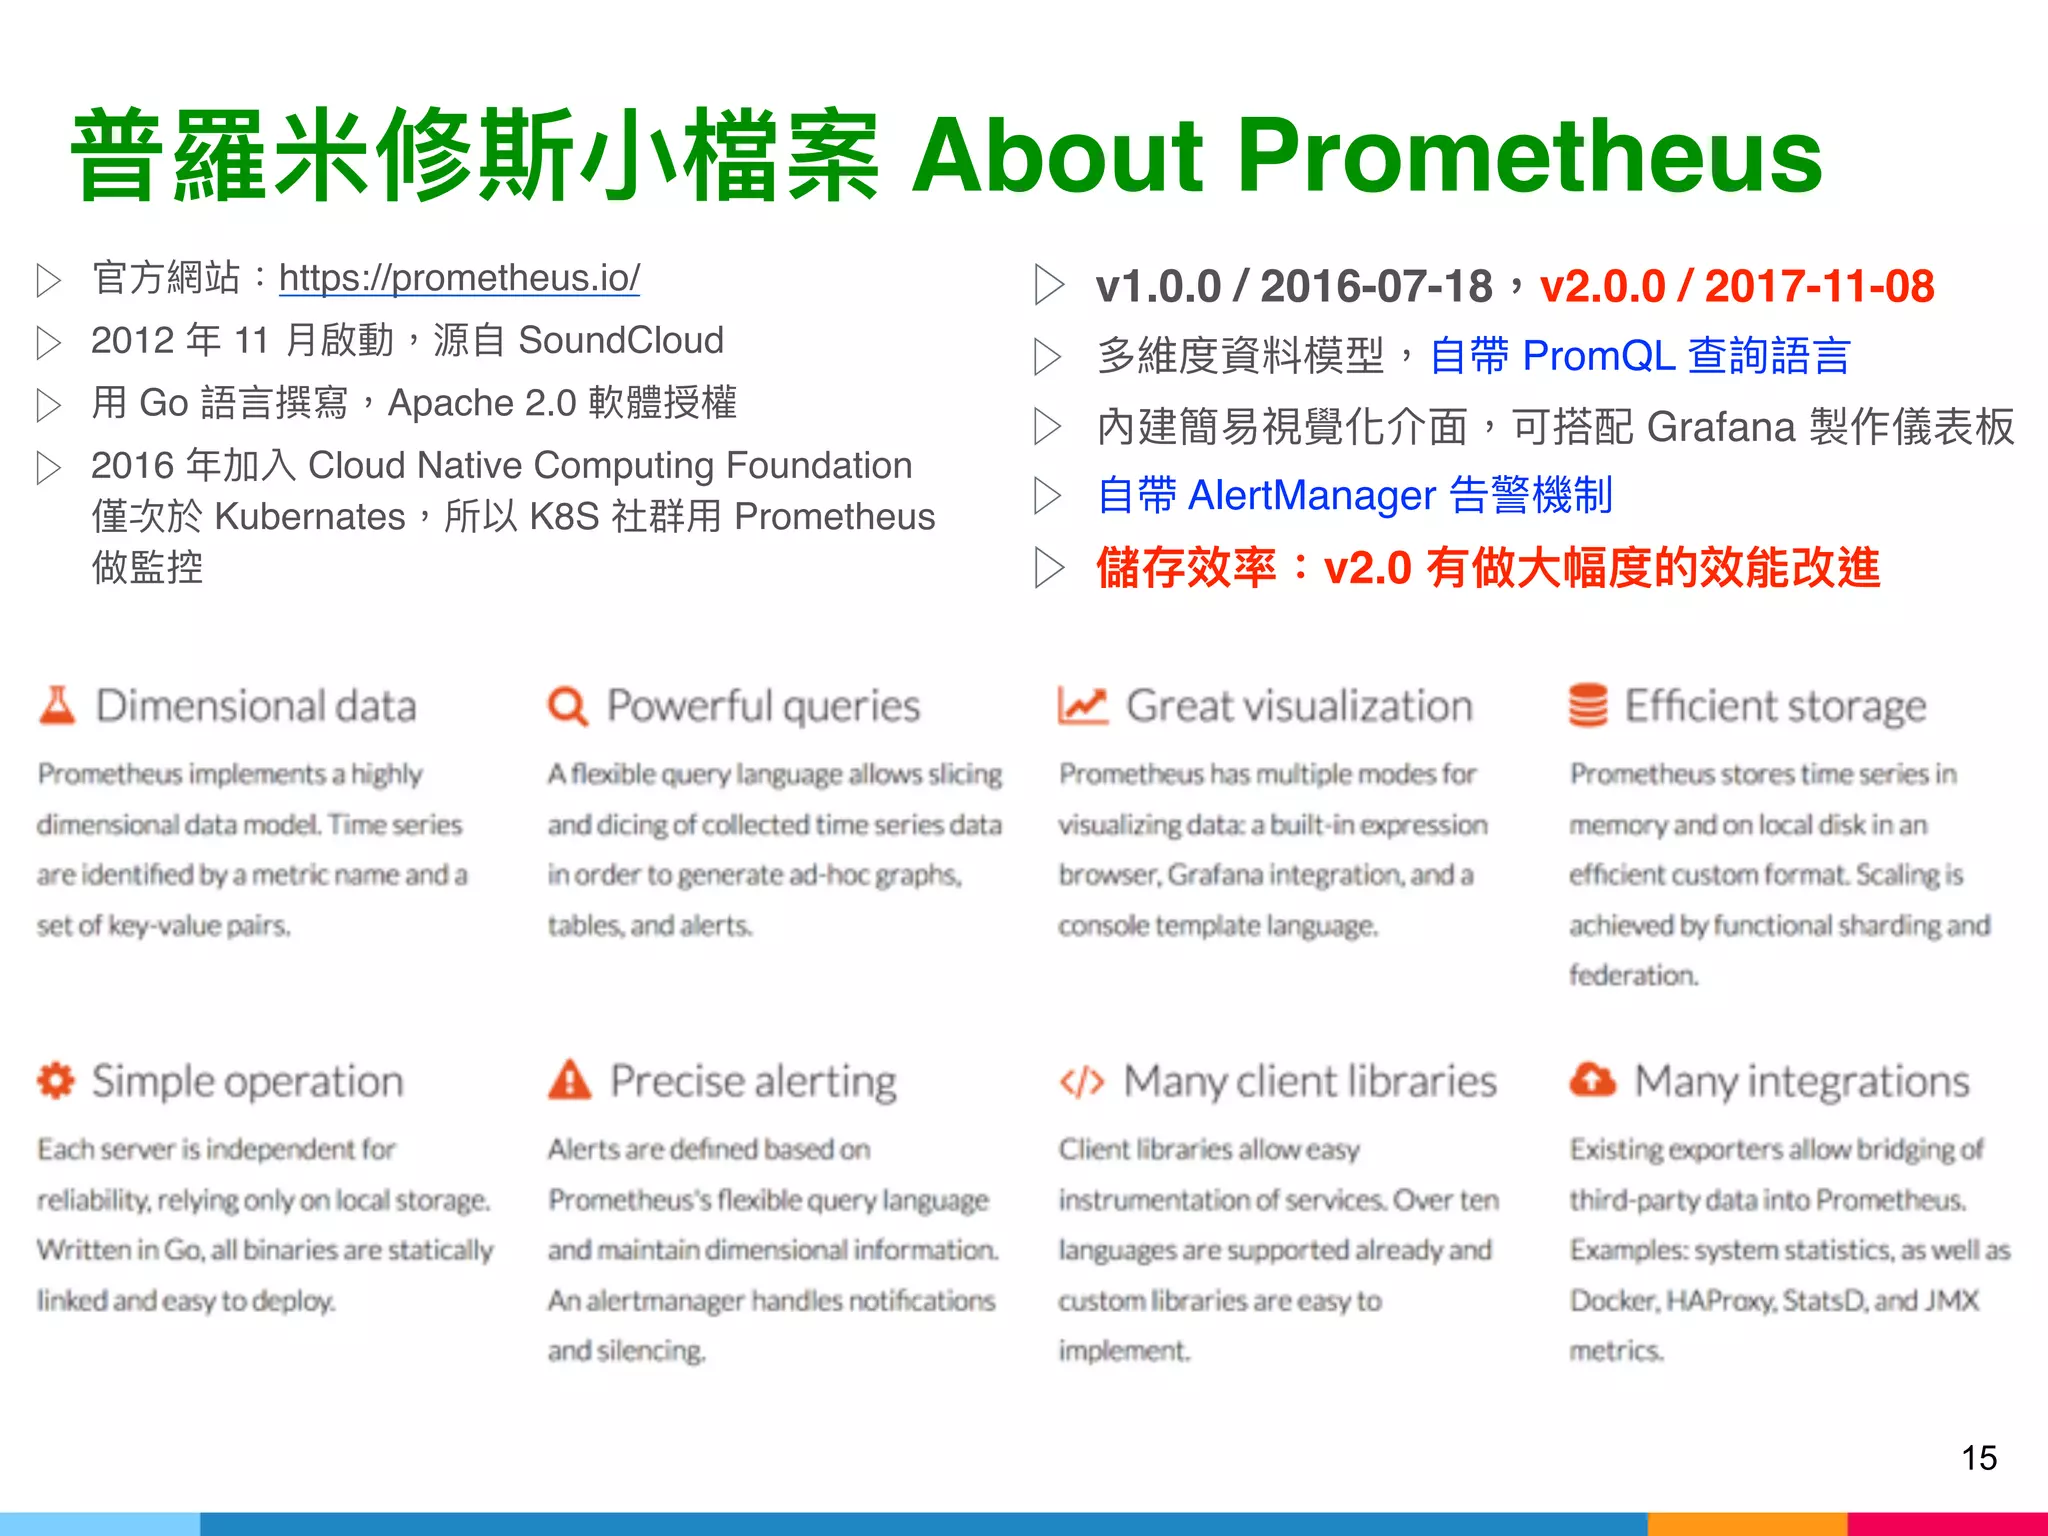
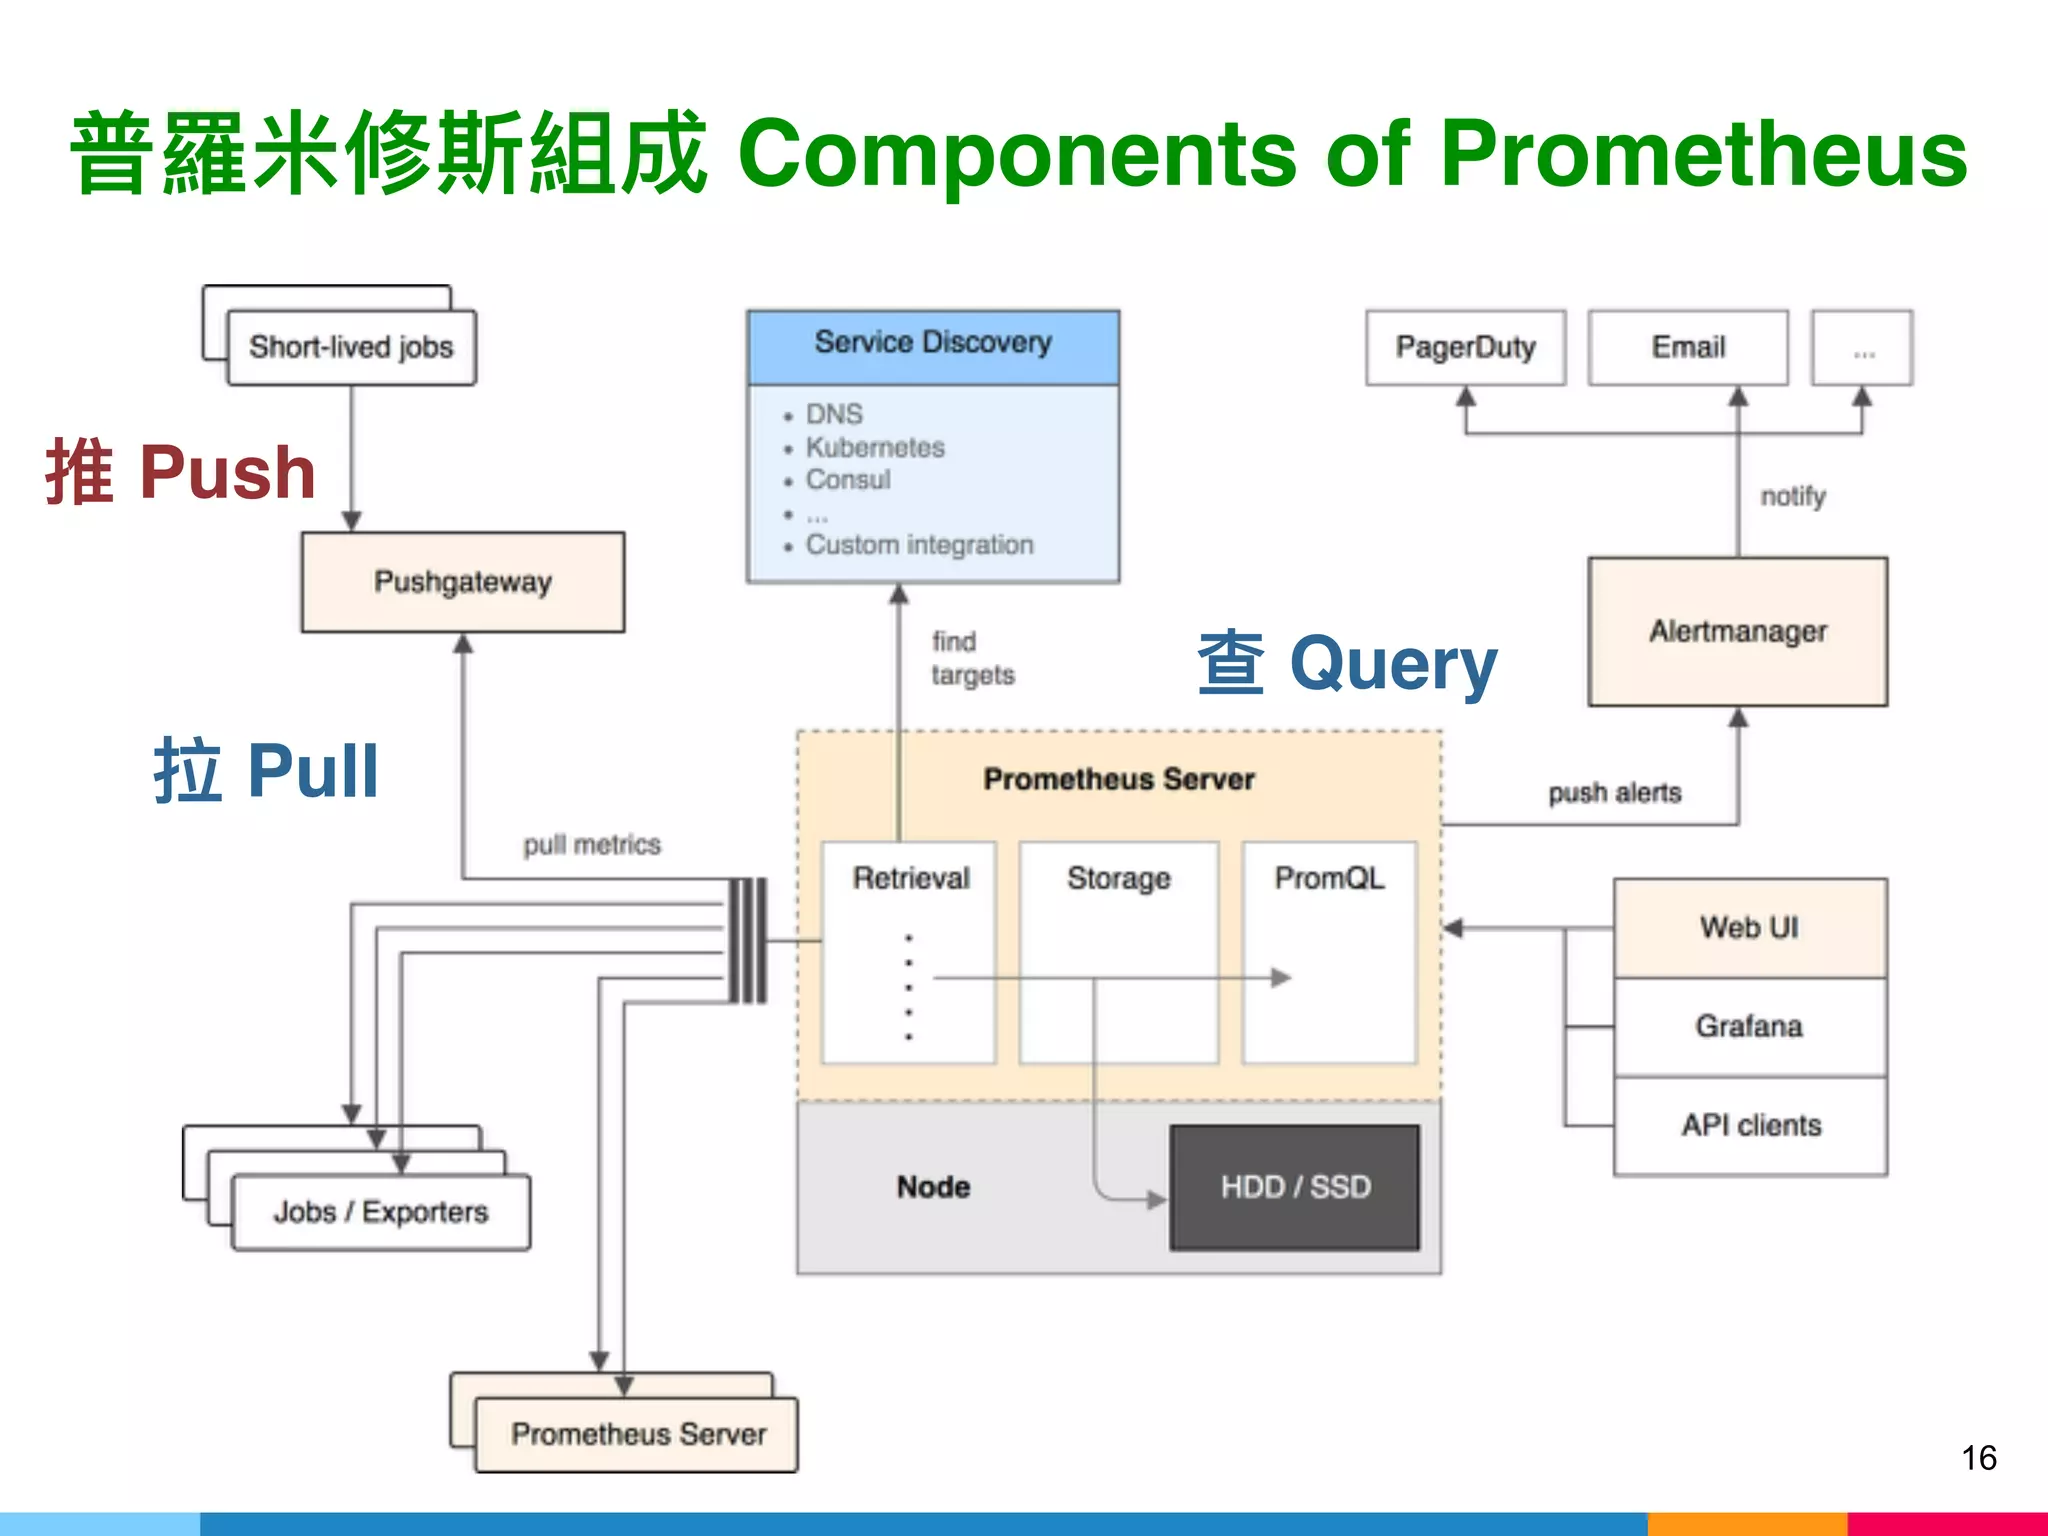
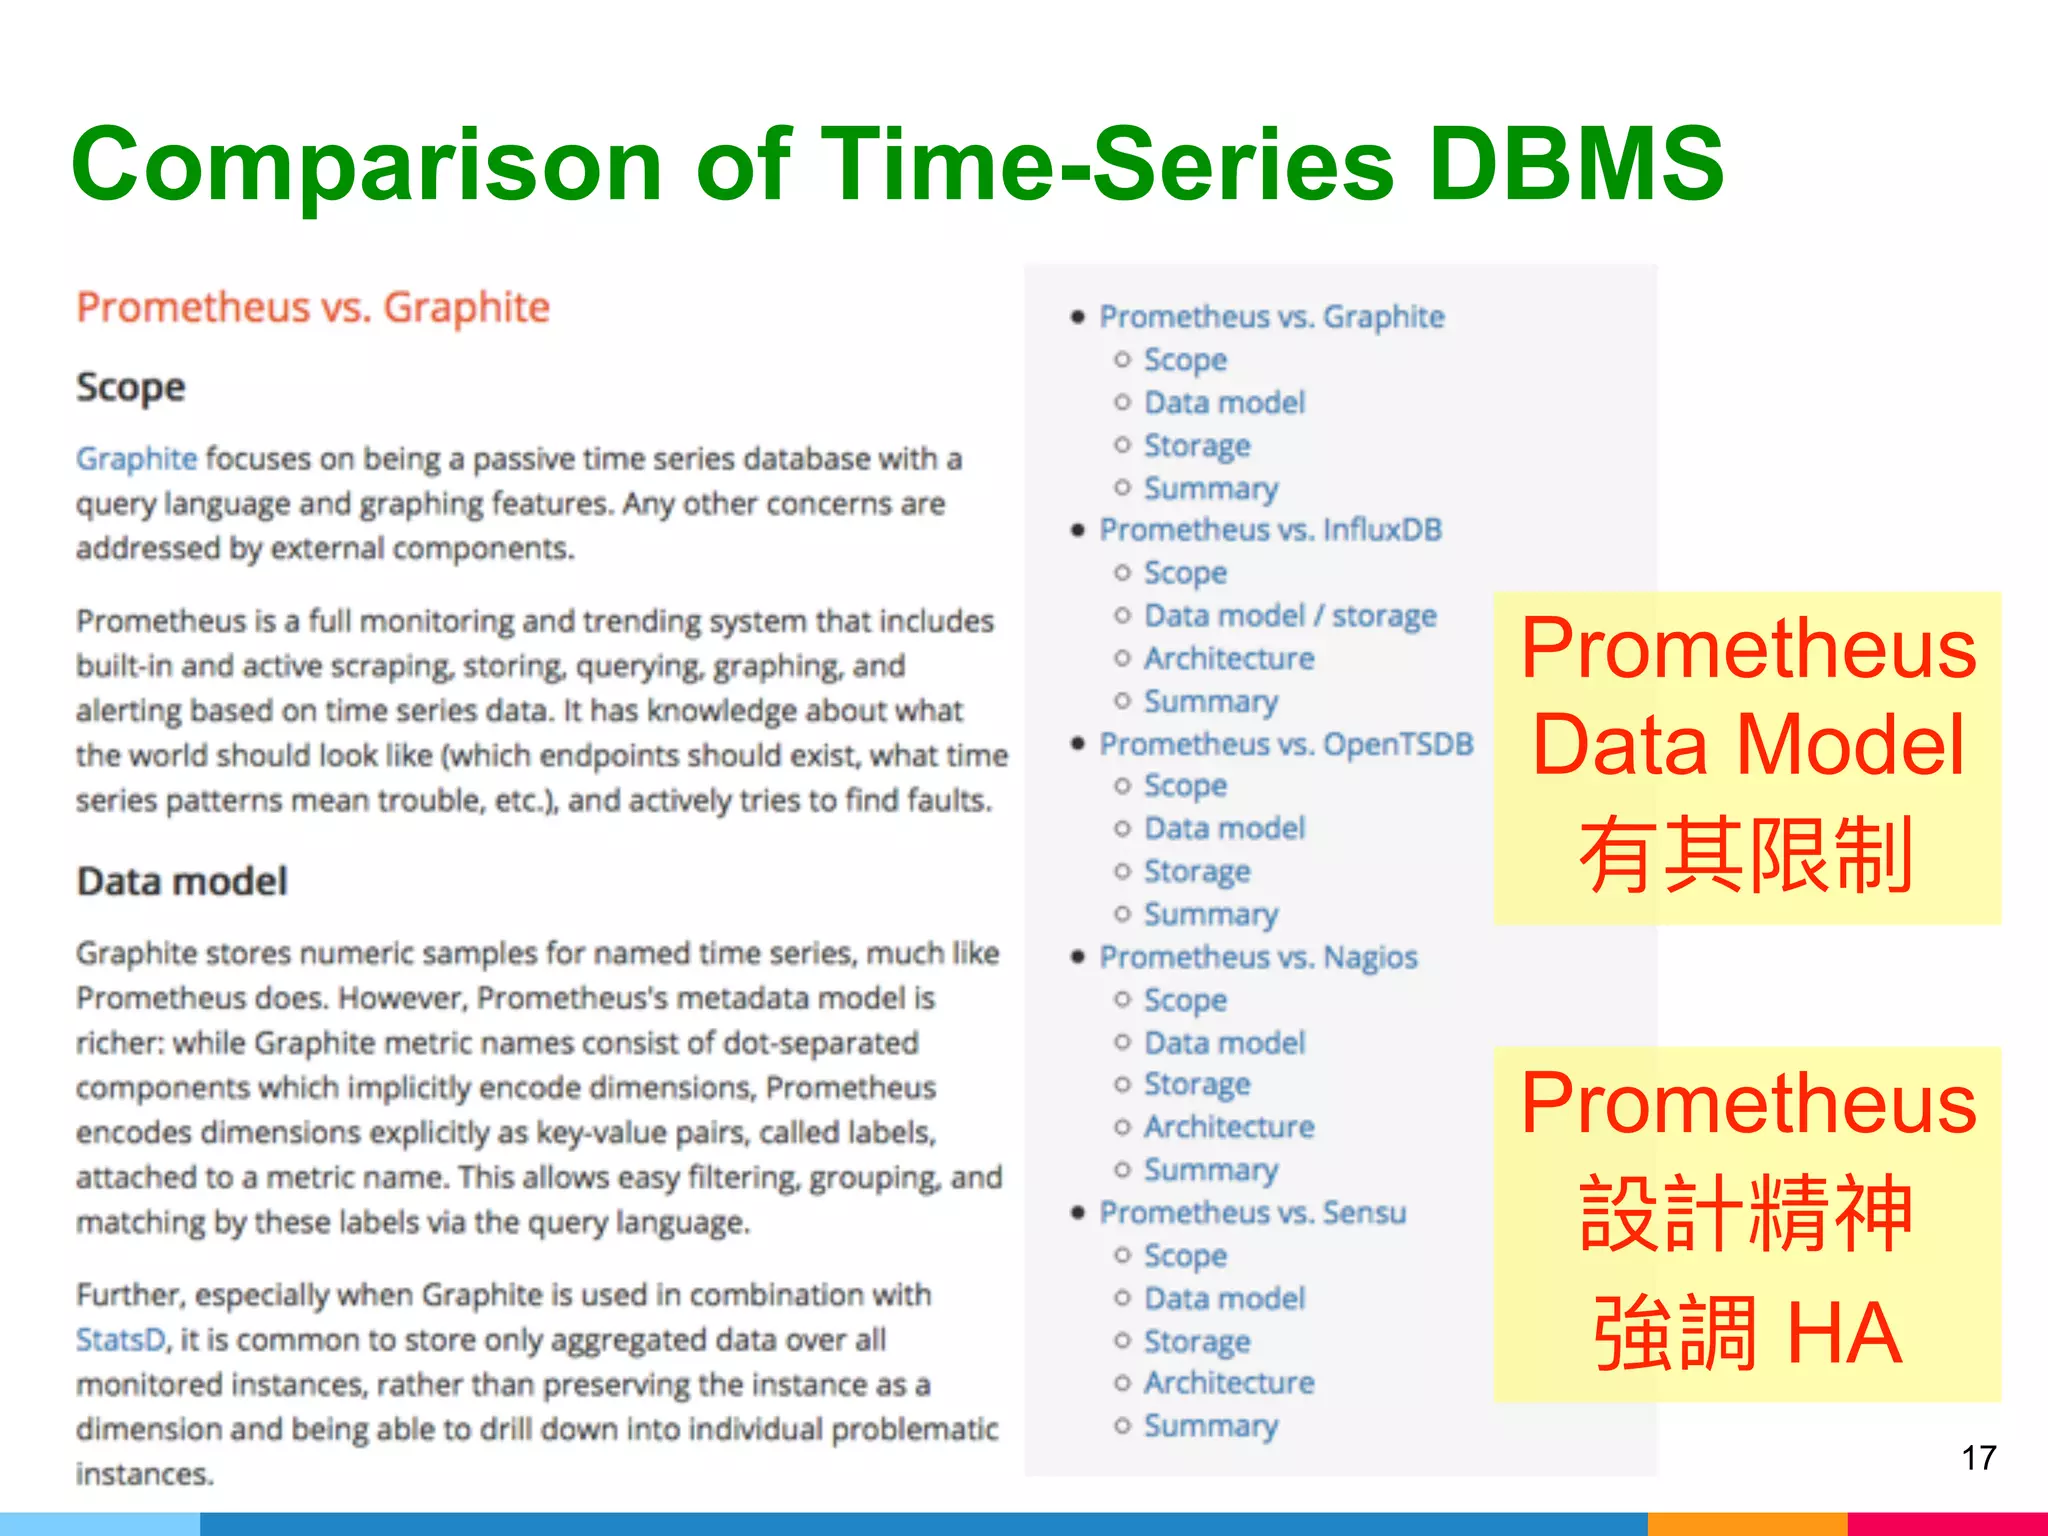
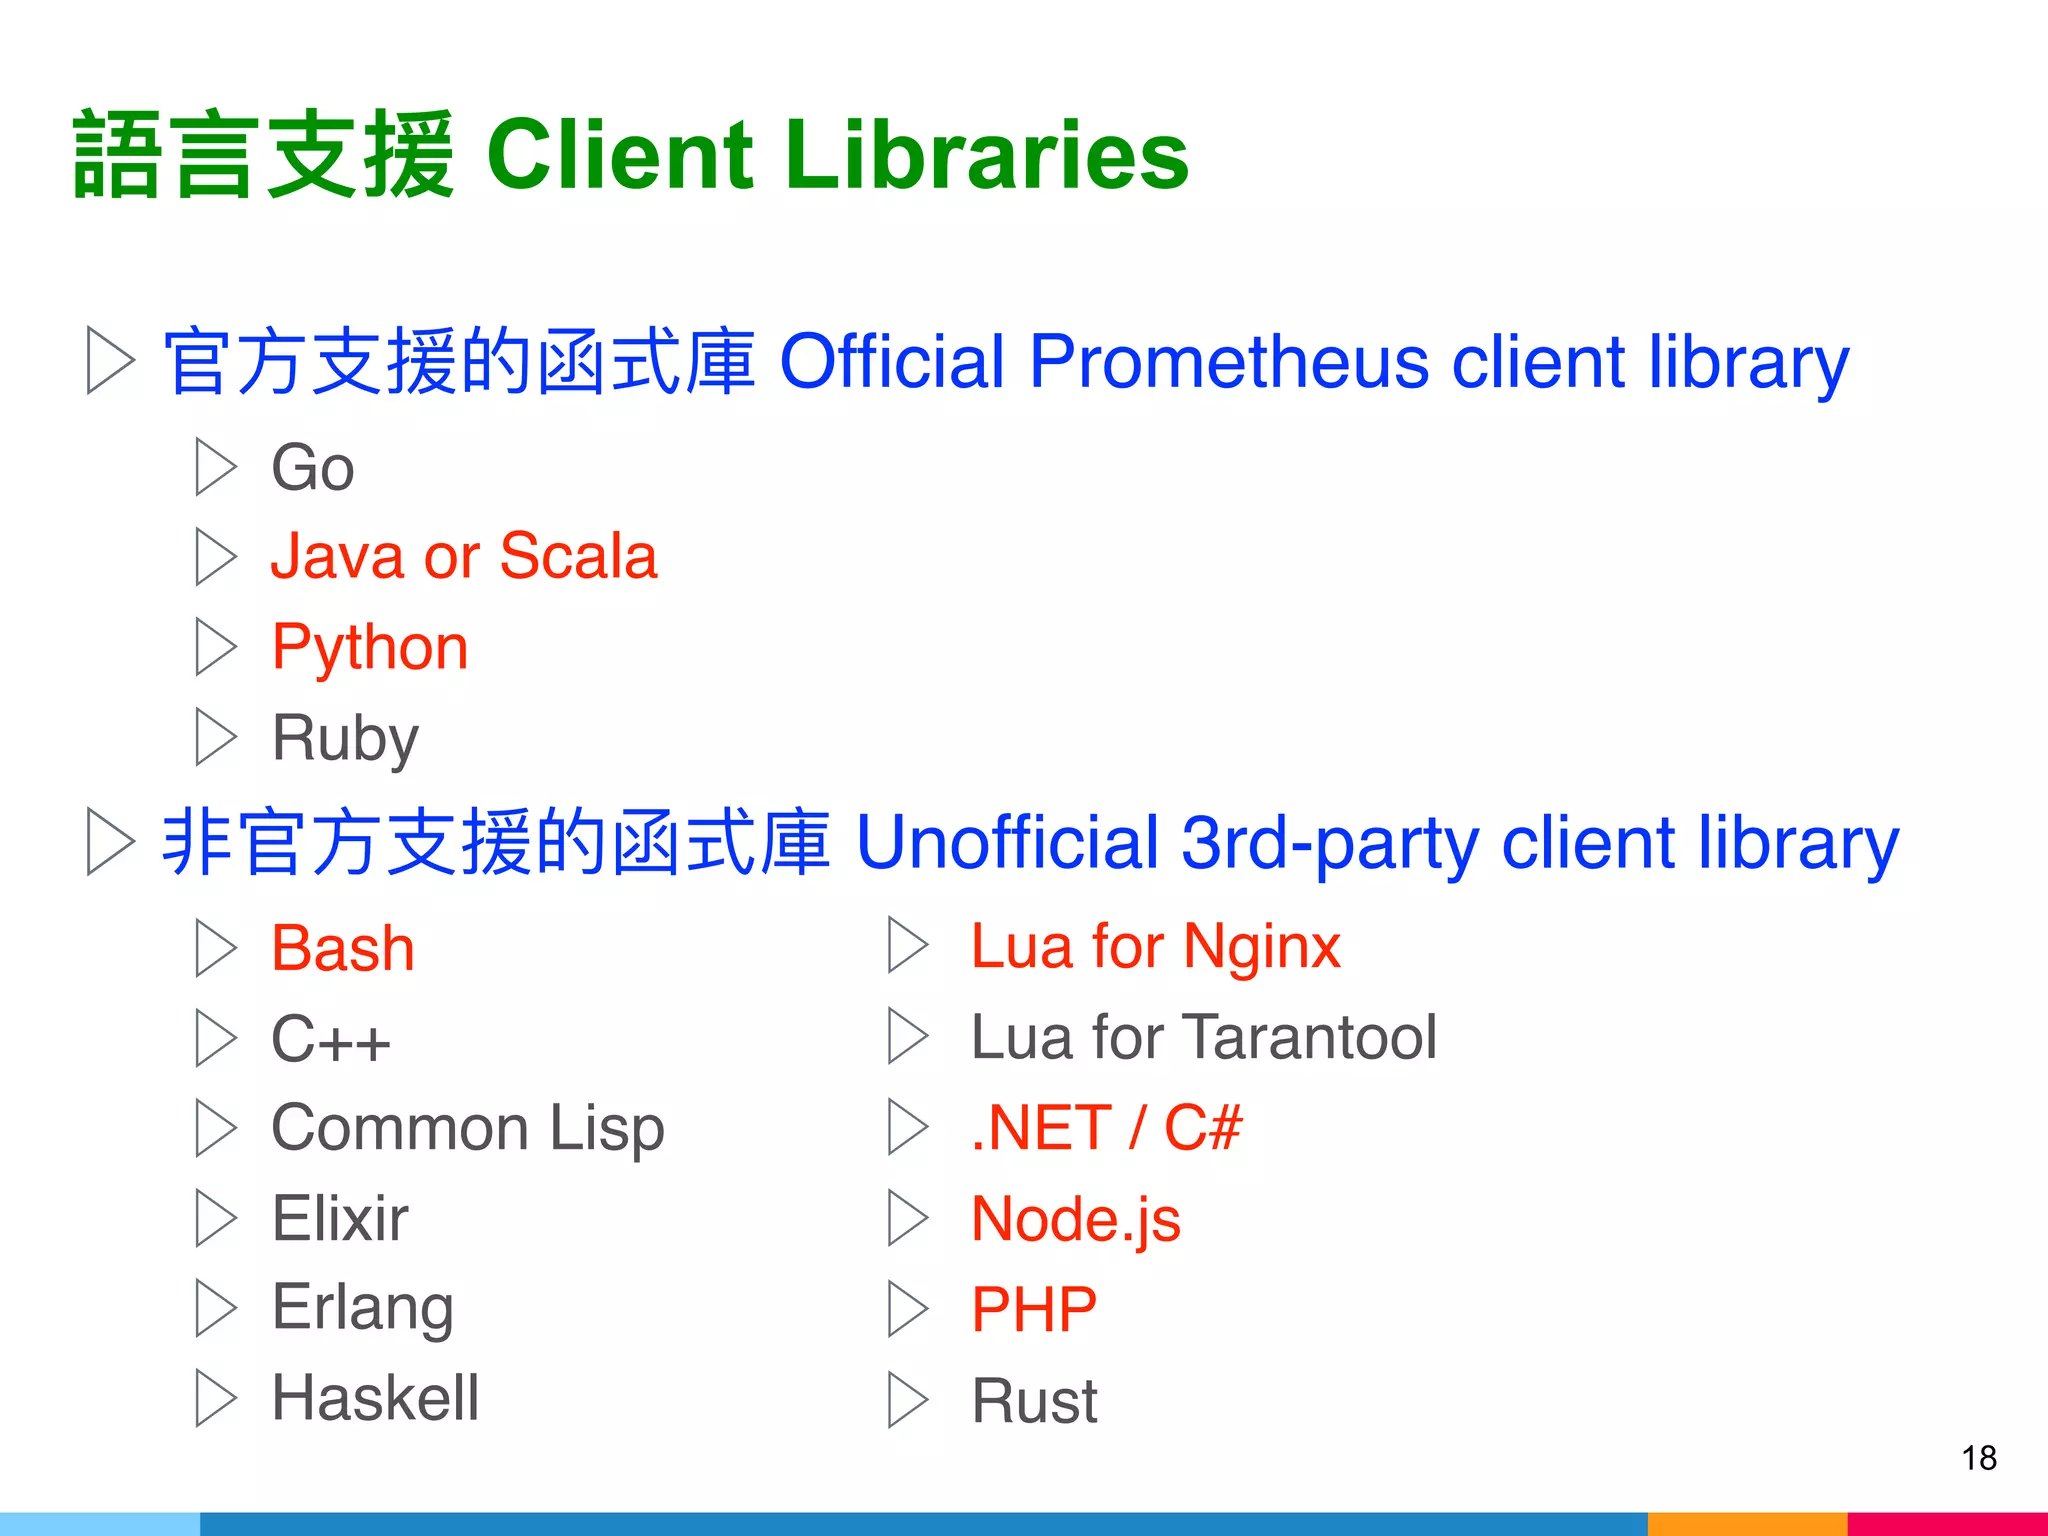
The document presents a workshop by Jazz Yao-Tsung Wang on building full stack monitoring and notification systems using Prometheus. It outlines the benefits and pain points of full stack monitoring, introduces the Prometheus ecosystem, and details various components and exporters for different layers of data management. The presentation includes a discussion on lessons learned and resources for deploying and utilizing Prometheus effectively.


