Download to read offline
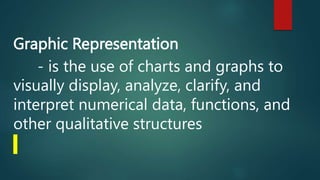

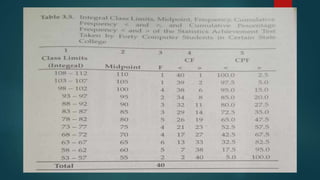
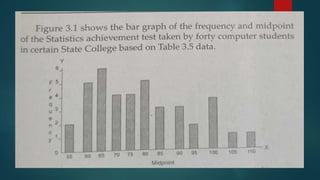
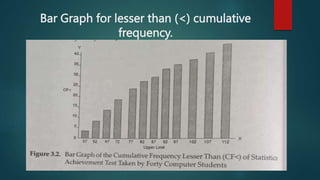
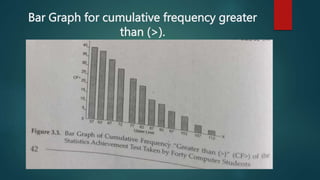

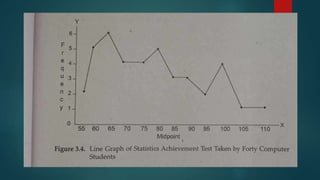

Chapter 3 discusses frequency distribution and its graphical representation, emphasizing the use of charts and graphs to analyze numerical data. It explains bar graphs, which represent frequencies with vertical rectangles, and line graphs that connect plotted midpoints of frequencies. Additionally, it distinguishes between 'less than' and 'greater than' cumulative frequency representations.


