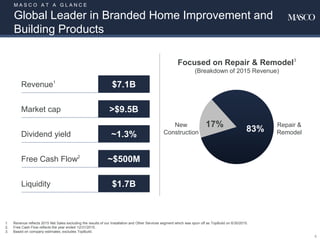
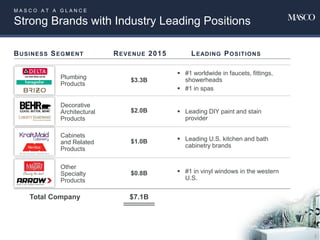
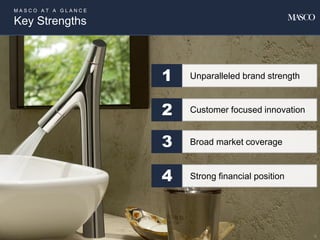
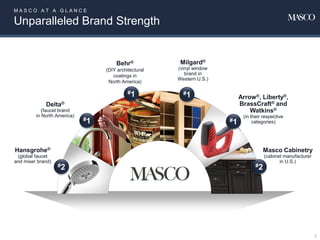
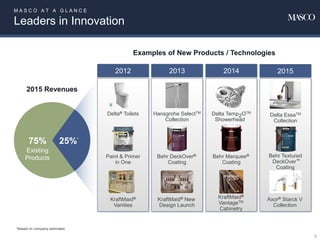
Raymond James
37th Annual Institutional
Investors Conference
John Sznewajs
Chief Financial Officer
March 7, 2016
Safe Harbor Statement
Statements contained in this presentation that reflect our views about our future performance and constitute
“forward-looking statements” under the Private Securities Litigation Reform Act of 1995. Forward-looking
statements can be identified by words such as “believe,” “anticipate,” “appear,” “may,” “will,” “should,” “intend,”
“plan,” “estimate,” “expect,” “assume,” “seek,” “forecast,” and similar references to future periods. Our views
about future performance involve risks and uncertainties that are difficult to predict and, accordingly, our
actual results may differ materially from the results discussed in our forward-looking statements. We caution
you against relying on any of these forward-looking statements.
Our future performance may be affected by the levels of home improvement activity and new home
construction, our ability to maintain our strong brands and to develop and introduce new and improved
products, our ability to maintain our competitive position in our industries, our reliance on key customers, our
ability to achieve the anticipated benefits of our strategic initiatives, our ability to sustain the performance of
our cabinetry businesses, the cost and availability of raw materials, our dependence on third party suppliers,
and risks associated with international operations and global strategies. These and other factors are
discussed in detail in Item 1A, “Risk Factors” in our most recent Annual Report on Form 10-K, as well as in
our Quarterly Reports on Form 10-Q and in other filings we make with the Securities and Exchange
Commission. The forward-looking statements in this press release speak only as of the date of this press
release. Factors or events that could cause our actual results to differ may emerge from time to time, and it is
not possible for us to predict all of them. Unless required by law, we undertake no obligation to update publicly
any forward-looking statements as a result of new information, future events or otherwise.
2
Agenda
3
The Company
The Transformation
The Outlook
Revenue1
$7.1B
Market cap >$9.5B
Dividend yield ~1.3%
Free Cash Flow2
~$500M
Focused on Repair & Remodel3
(Breakdown of 2015 Revenue)
New
Construction
Repair &
Remodel83%
17%
4
Liquidity $1.7B
M A S C O A T A G L A N C E
Global Leader in Branded Home Improvement and
Building Products
1. Revenue reflects 2015 Net Sales excluding the results of our Installation and Other Services segment which was spun off as TopBuild on 6/30/2015.
2. Free Cash Flow reflects the year ended 12/31/2015.
3. Based on company estimates; excludes TopBuild.
M A S C O A T A G L A N C E
Strong Brands with Industry Leading Positions
5
BUSINESS SEGMENT
Cabinets
and Related
Products
Plumbing
Products
Decorative
Architectural
Products
$1.0B
$3.3B
$2.0B
REVENUE 2015
$7.1BTotal Company
Other
Specialty
Products
$0.8B
LEADING POSITIONS
 Leading U.S. kitchen and bath
cabinetry brands
 #1 worldwide in faucets, fittings,
showerheads
 #1 in spas
 Leading DIY paint and stain
provider
 #1 in vinyl windows in the western
U.S.
M A S C O A T A G L A N C E
Key Strengths
6
1 Unparalleled brand strength
2 Customer focused innovation
3 Broad market coverage
4 Strong financial position
M A S C O A T A G L A N C E
Unparalleled Brand Strength
7
Masco Cabinetry
(cabinet manufacturer
in U.S.)
Delta®
(faucet brand
in North America)
Behr®
(DIY architectural
coatings in
North America)
Milgard®
(vinyl window
brand in
Western U.S.)
Hansgrohe®
(global faucet
and mixer brand)
Arrow®, Liberty®,
BrassCraft® and
Watkins®
(in their respective
categories)
#2
#1
#1 #1
#1
#2
M A S C O A T A G L A N C E
Leaders in Innovation
8
25%*
Examples of New Products / Technologies
Existing
Products
201420132012
75%
Hansgrohe SelectTM
Collection
KraftMaid® New
Design Launch
2015 Revenues
Delta® Toilets
Paint & Primer
in One
KraftMaid®
Vanities
Behr DeckOver®
Coating
KraftMaid®
VantageTM
Cabinetry
Behr Marquee®
Coating
Delta Temp2OTM
Showerhead
2015
Delta EssaTM
Collection
Behr Textured
DeckOver™
Coating
Axor® Starck V
Collection
*Based on company estimates
M A S C O A T A G L A N C E
Broad Coverage Across Attractive Segments, Price
Points and Channels
9
Segments Price Points Channels
New
construction
17%
Repair /
remodel
83%
International
21%
N. America
79%
• Low ticket value
~$20
• High ticket
luxury ~$20K
• Direct-to-Builder
• Big box retail
• Wholesale /
dealer trade
M A S C O A T A G L A N C E
Strong Balance Sheet with Significant Financial Flexibility
10
Strong Liquidity
(as of 12/31/2015)
● Plan to reduce debt $300M–$500M in the next
several quarters
Debt to EBITDA*
2015
Year End
Future
Target
Balance Sheet Liquidity
Cash and cash investments $1.5B
Short-term bank deposits $0.2B
Total $1.7B
~3X
~2.5X
*Restated to exclude spinoff of TopBuild. See Appendix for GAAP reconciliation.
Agenda
11
The Company
The Transformation
The Outlook
Organization
Operational Excellence
Portfolio and Capital
Allocation
T H E “ N E W ” M A S C O
Transformational Initiatives
 Formed a new management team
 Instituted a center led business model
 Restructured HQ
 Made key business unit management
changes
 Completed spin off of TopBuild
 Authorized share buy back of 50
million shares
 Increased dividend
 Reduced costs and increased efficiencies
 Standardized planning processes
 Prioritized capability building
 Drove cost improvement culture
12
T H E “ N E W ” M A S C O
Created a Less Cyclical Business
13
N.
America
19%81% Int’l
R&R 29%71% New home
N.
America
21%79% Int’l
R&R 17%83% New home
Revenue Breakdown – International vs. North America
Revenue Breakdown – R&R vs. New Home Construction
1. Based on 2014 revenues including TopBuild and company estimates.
2. Based on 2015 revenue and company estimates.
More Global Diversification
Less Cyclicality
Pre-Spin
1
Post-Spin
2
14
T H E “ N E W ” M A S C O
Focus on Operational Excellence
Aligned
on Key
Financial
Metrics
Capitalize on
our Strong
Operating
Leverage
Strong
Management
Team
Culture of
Accountability
R E S U L T S :
Stable Revenues, Strong Profitability
15
$6.3
$7.1
2012 2015
Revenues
($B)
$505
$927
2012 2015
$0.38
$1.19
2012 2015
EPS*
($)
Operating Profit*
($M)
4%
CAGR
22%
CAGR
46%
CAGR
*Amounts exclude TopBuild Corp.
*See appendix for GAAP reconciliation. EPS as reported was $0.15 in 2012 and $1.03 in 2015.
Agenda
16
The Company
The Transformation
The Outlook
S T R A T E G Y F O R G R O W T H
Fundamentals Impacting our End Markets are Strong
17
1
Age of US
Housing Stock
2
Home Price
Appreciation
3
Housing
Turnover
4
Household
Formation
5
Housing
Affordability
S T R A T E G Y F O R G R O W T H
Strategies which Capitalize on Masco’s Strengths
Decorative
Architectural
Products
Segment
Cabinets
and
Related
Products
Segment
Other
Specialty
Products
Segment
Plumbing
Products
Segment
1.Extend Milgard’s leadership position in Western U.S.
2.Pursue geographic expansion with Milgard
3.Extend UK Window Group’s leadership position
Sales Growth:
9-11% CAGR
Operating Margins:
~10-13%
1.Extend leadership in N. American plumbing
2.Pursue category expansion
3.Growth in priority international markets, both organically and
inorganically
1.Extend our Consumer leadership position
2.Grow share in the PRO paint segment
3.Leverage the KILZ® and Liberty® family of brands
Sales Growth:
4-6% CAGR
Operating Margins:
~16-17%
3 Year GoalsStrategic Priorities
Sales Growth:
6-9% CAGR
Operating Margins:
~18%
1.Profitably recover KraftMaid® and Merillat® share
2.Execute Builder Direct turnaround
3.Achieve margin improvement targets
Sales Growth:
4-7% CAGR
Operating Margins:
~8-9%
19Note: 2014 amounts restated to exclude TopBuild. Future performance reflects company estimates.
7%
CAGR
16%
CAGR
27%
CAGR
Revenue*
($B)
Operating Profit*
($B)
EPS*
($)
$6.8
$8.3
2014 2017
$0.88
$1.80
2014 2017
$0.74
$1.15
2014 2017
*2014 revenue and operating profit uses a $1.10 Euro to USD foreign exchange rate . See appendix for GAAP reconciliation.
S T R A T E G Y F O R G R O W T H
Clear Line of Sight to Profitable Growth
F I N A N C I A L F L E X I B I L I T Y
Strong Free Cash Flow Coupled with Disciplined
Capital Deployment
20
Invest in the business
Pay down debt
Bolt on acquisitions
Return Capital to
Shareholders
~$2B
FCF
2015 - 2017
F I N A N C I A L F L E X I B I L I T Y
Future Growth Requires Low Capex
21
$6,286
$6,761
$7,006
$7,142
$8,300
1.7% 1.6% 1.6%
2.1% 2.0%
2012 2013 2014 2015 2017
Sales
Capital Expenditures
% of Sales
$M
*Note: Amounts exclude TopBuild Corp.
F I N A N C I A L F L E X I B I L I T Y
A Strengthening Leverage Profile
1.0
2.0
3.0
4.0
5.0
6.0
7.0
$0
$1
$2
$3
$4
2012 2013 2014 2015 2016 2017
Debt-to-EBITDA*
Debt
Debt-to-EBITDA
$B
22*See appendix for GAAP reconciliation
• Bolt-ons to existing businesses
• Meet financial hurdles
• Participate in attractive end markets*
• Accelerate growth strategies
23
F I N A N C I A L F L E X I B I L I T Y
Disciplined Portfolio Management
*Repair and Remodel, Global Segments, Low Cyclicality, Brand and Innovation Drive Value
Driving
Value
Creation
Strategic Acquisitions
F I N A N C I A L F L E X I B I L I T Y
Powerful Cash Flow Funds Growth and Return
to Shareholders Through 2017
12/31/2014
Liquidity
Cash Flow
from
Business
TopBuild
Cash
Distribution
Capital
Expenditures
Dividends Share
Repurchases
Acquisitions /
Divestitures
Debt
Paydown
12/31/2017
Liquidity
$1.7
$2.2
$0.2 $(0.6)
$(0.4)
$(1.2)
$(0.5)
$(0.4)
$1.0
$B
24
+
+
New Masco. Positioned to Outperform
Leveraging a portfolio of industry leading
global brands with compelling growth
strategies
Aligned management team with a clear
strategic focus
Strong free cash flow generation and capital
management driving value to shareholders
+
Transformative actions have delivered
strengthened results and redefined Masco
25
Positioned to
Outperform
Q&A
26
Appendix
($ in Millions) 2016 Estimate 2015 Actual1
Rationalization Charges2 ~ $8 $18
Tax Rate3 ~ 36% 43%
Interest Expense ~ $225 $225
General Corp. Expense4 ~ $100 $105
Capital Expenditures ~ $190 $152
Depreciation & Amortization ~ $140 $127
Shares Repurchased5 $400-500 $456
Shares Outstanding6 335 million 335 million
1. 2015 results exclude TopBuild Corp.
2. Based on 2016 business plans.
3. 2015 tax rate is impacted by a $21 million valuation allowance resulting from our decision to spin off TopBuild, and a $19 million charge to recognize the
required taxes on substantially all undistributed foreign earnings except those that are legally restricted.
4. Excludes rationalization expenses of $4 million for the year ended December 31, 2015.
5. 2015 share repurchases include approximately 741,000 shares that were repurchased to offset grants of long-term stock awards.
6. Reflects weighted average diluted shares outstanding for the fourth quarter 2015 and assumes no share repurchases in 2016.
28
2016 Guidance Estimates
2015 Segment Mix*
R&R = % of sales to repair and remodel channels
NC = % of sales to new construction channels
NA = % of sales within North America
Int’l = % of sales outside North America
* Based on Company estimates; excludes TopBuild Corp.
Business Segment
Plumbing
Products
Decorative
Architectural
Products
$3.3B
$2.0B
Revenue 2015 % of Total
47%
28%
$ 7.1B 100%Total Company
Other Specialty
Products
$0.8B 11%
R&R% vs. NC NA% vs. Int’l
83% 63%
99% 100%
70% 76%
83% 79%
Cabinets and
Related Products
$1.0B 14% 57% 92%
29
2015 International Revenue Split*
*Based on Company estimates; excludes TopBuild Corp.
International Sales Accounted for ~21%
of Total 2015 Masco Sales
29%
5%
8%
26%
5%
17%
10%
UK
Northern Europe
Southern Europe
Central Europe
Eastern Europe
Emerging markets
Other
30
Appendix – Net Sales and Profit Reconciliations
Year Ended December 31,
($ in Millions) 2015 2014 2013 2012
Operating Profit, as reported $ 914 $ 721 $ 612 $ 384
Rationalization charges 18 64 47 74
(Income) charge for litigation settlements - (9) - 1
(Gain) from sales of fixed assets, net (5) - - (8)
Impairment of goodwill and other intangible assets - - - 42
Other Specialty Products - warranty - - - 12
Operating Profit, as adjusted 927 776 659 505
Depreciation and amortization 127 141 157 173
EBITDA, as adjusted $ 1,054 $ 917 $ 816 $ 678
($ in Millions) 2014
Net Sales
Net sales, as reported $ 7,006
Currency adjustment (204)
Net sales, as reported and FX modified $ 6,802
Operating Profit
Operating Profit, as reported $ 776
Currency adjustment (36)
Operating Profit, as adjusted and FX modified $ 740
Appendix – EPS Reconciliation
(in millions, except per common share data)
Year Ended December 31,
($ in Millions) 2015 2014 2012
Earnings Per Common Share
Income from continuing operations
before income taxes, as reported $ 689 $ 507 $ 155
Rationalization charges 18 64 74
Impairment of goodwill and other intangible assets - - 42
(Income) charge for litigation settlements - (9) 1
(Gain) from sale of fixed assets, net (5) - (8)
(Gain) from financial investments, net (6) (4) (22)
(Earnings) losses from equity investments, net (2) 2 -
Other Specialty Products – warranty - - 12
Interest carry costs - - 7
Income from continuing operations
before income taxes, as adjusted 694 560 261
Tax at 36% rate (250) (202) (94)
Less: Net income attributable to noncontrolling interest 39 47 35
Income from continuing operations, as adjusted $ 405 $ 311 $ 132
Income per common share, as adjusted $ 1.19 $ 0.88 $ 0.38
Average diluted common shares outstanding 341 352 349

Mas 2016 raymond james final 1

  • 1.
    Raymond James 37th AnnualInstitutional Investors Conference John Sznewajs Chief Financial Officer March 7, 2016
  • 2.
    Safe Harbor Statement Statementscontained in this presentation that reflect our views about our future performance and constitute “forward-looking statements” under the Private Securities Litigation Reform Act of 1995. Forward-looking statements can be identified by words such as “believe,” “anticipate,” “appear,” “may,” “will,” “should,” “intend,” “plan,” “estimate,” “expect,” “assume,” “seek,” “forecast,” and similar references to future periods. Our views about future performance involve risks and uncertainties that are difficult to predict and, accordingly, our actual results may differ materially from the results discussed in our forward-looking statements. We caution you against relying on any of these forward-looking statements. Our future performance may be affected by the levels of home improvement activity and new home construction, our ability to maintain our strong brands and to develop and introduce new and improved products, our ability to maintain our competitive position in our industries, our reliance on key customers, our ability to achieve the anticipated benefits of our strategic initiatives, our ability to sustain the performance of our cabinetry businesses, the cost and availability of raw materials, our dependence on third party suppliers, and risks associated with international operations and global strategies. These and other factors are discussed in detail in Item 1A, “Risk Factors” in our most recent Annual Report on Form 10-K, as well as in our Quarterly Reports on Form 10-Q and in other filings we make with the Securities and Exchange Commission. The forward-looking statements in this press release speak only as of the date of this press release. Factors or events that could cause our actual results to differ may emerge from time to time, and it is not possible for us to predict all of them. Unless required by law, we undertake no obligation to update publicly any forward-looking statements as a result of new information, future events or otherwise. 2
  • 3.
  • 4.
    Revenue1 $7.1B Market cap >$9.5B Dividendyield ~1.3% Free Cash Flow2 ~$500M Focused on Repair & Remodel3 (Breakdown of 2015 Revenue) New Construction Repair & Remodel83% 17% 4 Liquidity $1.7B M A S C O A T A G L A N C E Global Leader in Branded Home Improvement and Building Products 1. Revenue reflects 2015 Net Sales excluding the results of our Installation and Other Services segment which was spun off as TopBuild on 6/30/2015. 2. Free Cash Flow reflects the year ended 12/31/2015. 3. Based on company estimates; excludes TopBuild.
  • 5.
    M A SC O A T A G L A N C E Strong Brands with Industry Leading Positions 5 BUSINESS SEGMENT Cabinets and Related Products Plumbing Products Decorative Architectural Products $1.0B $3.3B $2.0B REVENUE 2015 $7.1BTotal Company Other Specialty Products $0.8B LEADING POSITIONS  Leading U.S. kitchen and bath cabinetry brands  #1 worldwide in faucets, fittings, showerheads  #1 in spas  Leading DIY paint and stain provider  #1 in vinyl windows in the western U.S.
  • 6.
    M A SC O A T A G L A N C E Key Strengths 6 1 Unparalleled brand strength 2 Customer focused innovation 3 Broad market coverage 4 Strong financial position
  • 7.
    M A SC O A T A G L A N C E Unparalleled Brand Strength 7 Masco Cabinetry (cabinet manufacturer in U.S.) Delta® (faucet brand in North America) Behr® (DIY architectural coatings in North America) Milgard® (vinyl window brand in Western U.S.) Hansgrohe® (global faucet and mixer brand) Arrow®, Liberty®, BrassCraft® and Watkins® (in their respective categories) #2 #1 #1 #1 #1 #2
  • 8.
    M A SC O A T A G L A N C E Leaders in Innovation 8 25%* Examples of New Products / Technologies Existing Products 201420132012 75% Hansgrohe SelectTM Collection KraftMaid® New Design Launch 2015 Revenues Delta® Toilets Paint & Primer in One KraftMaid® Vanities Behr DeckOver® Coating KraftMaid® VantageTM Cabinetry Behr Marquee® Coating Delta Temp2OTM Showerhead 2015 Delta EssaTM Collection Behr Textured DeckOver™ Coating Axor® Starck V Collection *Based on company estimates
  • 9.
    M A SC O A T A G L A N C E Broad Coverage Across Attractive Segments, Price Points and Channels 9 Segments Price Points Channels New construction 17% Repair / remodel 83% International 21% N. America 79% • Low ticket value ~$20 • High ticket luxury ~$20K • Direct-to-Builder • Big box retail • Wholesale / dealer trade
  • 10.
    M A SC O A T A G L A N C E Strong Balance Sheet with Significant Financial Flexibility 10 Strong Liquidity (as of 12/31/2015) ● Plan to reduce debt $300M–$500M in the next several quarters Debt to EBITDA* 2015 Year End Future Target Balance Sheet Liquidity Cash and cash investments $1.5B Short-term bank deposits $0.2B Total $1.7B ~3X ~2.5X *Restated to exclude spinoff of TopBuild. See Appendix for GAAP reconciliation.
  • 11.
  • 12.
    Organization Operational Excellence Portfolio andCapital Allocation T H E “ N E W ” M A S C O Transformational Initiatives  Formed a new management team  Instituted a center led business model  Restructured HQ  Made key business unit management changes  Completed spin off of TopBuild  Authorized share buy back of 50 million shares  Increased dividend  Reduced costs and increased efficiencies  Standardized planning processes  Prioritized capability building  Drove cost improvement culture 12
  • 13.
    T H E“ N E W ” M A S C O Created a Less Cyclical Business 13 N. America 19%81% Int’l R&R 29%71% New home N. America 21%79% Int’l R&R 17%83% New home Revenue Breakdown – International vs. North America Revenue Breakdown – R&R vs. New Home Construction 1. Based on 2014 revenues including TopBuild and company estimates. 2. Based on 2015 revenue and company estimates. More Global Diversification Less Cyclicality Pre-Spin 1 Post-Spin 2
  • 14.
    14 T H E“ N E W ” M A S C O Focus on Operational Excellence Aligned on Key Financial Metrics Capitalize on our Strong Operating Leverage Strong Management Team Culture of Accountability
  • 15.
    R E SU L T S : Stable Revenues, Strong Profitability 15 $6.3 $7.1 2012 2015 Revenues ($B) $505 $927 2012 2015 $0.38 $1.19 2012 2015 EPS* ($) Operating Profit* ($M) 4% CAGR 22% CAGR 46% CAGR *Amounts exclude TopBuild Corp. *See appendix for GAAP reconciliation. EPS as reported was $0.15 in 2012 and $1.03 in 2015.
  • 16.
  • 17.
    S T RA T E G Y F O R G R O W T H Fundamentals Impacting our End Markets are Strong 17 1 Age of US Housing Stock 2 Home Price Appreciation 3 Housing Turnover 4 Household Formation 5 Housing Affordability
  • 18.
    S T RA T E G Y F O R G R O W T H Strategies which Capitalize on Masco’s Strengths Decorative Architectural Products Segment Cabinets and Related Products Segment Other Specialty Products Segment Plumbing Products Segment 1.Extend Milgard’s leadership position in Western U.S. 2.Pursue geographic expansion with Milgard 3.Extend UK Window Group’s leadership position Sales Growth: 9-11% CAGR Operating Margins: ~10-13% 1.Extend leadership in N. American plumbing 2.Pursue category expansion 3.Growth in priority international markets, both organically and inorganically 1.Extend our Consumer leadership position 2.Grow share in the PRO paint segment 3.Leverage the KILZ® and Liberty® family of brands Sales Growth: 4-6% CAGR Operating Margins: ~16-17% 3 Year GoalsStrategic Priorities Sales Growth: 6-9% CAGR Operating Margins: ~18% 1.Profitably recover KraftMaid® and Merillat® share 2.Execute Builder Direct turnaround 3.Achieve margin improvement targets Sales Growth: 4-7% CAGR Operating Margins: ~8-9%
  • 19.
    19Note: 2014 amountsrestated to exclude TopBuild. Future performance reflects company estimates. 7% CAGR 16% CAGR 27% CAGR Revenue* ($B) Operating Profit* ($B) EPS* ($) $6.8 $8.3 2014 2017 $0.88 $1.80 2014 2017 $0.74 $1.15 2014 2017 *2014 revenue and operating profit uses a $1.10 Euro to USD foreign exchange rate . See appendix for GAAP reconciliation. S T R A T E G Y F O R G R O W T H Clear Line of Sight to Profitable Growth
  • 20.
    F I NA N C I A L F L E X I B I L I T Y Strong Free Cash Flow Coupled with Disciplined Capital Deployment 20 Invest in the business Pay down debt Bolt on acquisitions Return Capital to Shareholders ~$2B FCF 2015 - 2017
  • 21.
    F I NA N C I A L F L E X I B I L I T Y Future Growth Requires Low Capex 21 $6,286 $6,761 $7,006 $7,142 $8,300 1.7% 1.6% 1.6% 2.1% 2.0% 2012 2013 2014 2015 2017 Sales Capital Expenditures % of Sales $M *Note: Amounts exclude TopBuild Corp.
  • 22.
    F I NA N C I A L F L E X I B I L I T Y A Strengthening Leverage Profile 1.0 2.0 3.0 4.0 5.0 6.0 7.0 $0 $1 $2 $3 $4 2012 2013 2014 2015 2016 2017 Debt-to-EBITDA* Debt Debt-to-EBITDA $B 22*See appendix for GAAP reconciliation
  • 23.
    • Bolt-ons toexisting businesses • Meet financial hurdles • Participate in attractive end markets* • Accelerate growth strategies 23 F I N A N C I A L F L E X I B I L I T Y Disciplined Portfolio Management *Repair and Remodel, Global Segments, Low Cyclicality, Brand and Innovation Drive Value Driving Value Creation Strategic Acquisitions
  • 24.
    F I NA N C I A L F L E X I B I L I T Y Powerful Cash Flow Funds Growth and Return to Shareholders Through 2017 12/31/2014 Liquidity Cash Flow from Business TopBuild Cash Distribution Capital Expenditures Dividends Share Repurchases Acquisitions / Divestitures Debt Paydown 12/31/2017 Liquidity $1.7 $2.2 $0.2 $(0.6) $(0.4) $(1.2) $(0.5) $(0.4) $1.0 $B 24
  • 25.
    + + New Masco. Positionedto Outperform Leveraging a portfolio of industry leading global brands with compelling growth strategies Aligned management team with a clear strategic focus Strong free cash flow generation and capital management driving value to shareholders + Transformative actions have delivered strengthened results and redefined Masco 25 Positioned to Outperform
  • 26.
  • 27.
  • 28.
    ($ in Millions)2016 Estimate 2015 Actual1 Rationalization Charges2 ~ $8 $18 Tax Rate3 ~ 36% 43% Interest Expense ~ $225 $225 General Corp. Expense4 ~ $100 $105 Capital Expenditures ~ $190 $152 Depreciation & Amortization ~ $140 $127 Shares Repurchased5 $400-500 $456 Shares Outstanding6 335 million 335 million 1. 2015 results exclude TopBuild Corp. 2. Based on 2016 business plans. 3. 2015 tax rate is impacted by a $21 million valuation allowance resulting from our decision to spin off TopBuild, and a $19 million charge to recognize the required taxes on substantially all undistributed foreign earnings except those that are legally restricted. 4. Excludes rationalization expenses of $4 million for the year ended December 31, 2015. 5. 2015 share repurchases include approximately 741,000 shares that were repurchased to offset grants of long-term stock awards. 6. Reflects weighted average diluted shares outstanding for the fourth quarter 2015 and assumes no share repurchases in 2016. 28 2016 Guidance Estimates
  • 29.
    2015 Segment Mix* R&R= % of sales to repair and remodel channels NC = % of sales to new construction channels NA = % of sales within North America Int’l = % of sales outside North America * Based on Company estimates; excludes TopBuild Corp. Business Segment Plumbing Products Decorative Architectural Products $3.3B $2.0B Revenue 2015 % of Total 47% 28% $ 7.1B 100%Total Company Other Specialty Products $0.8B 11% R&R% vs. NC NA% vs. Int’l 83% 63% 99% 100% 70% 76% 83% 79% Cabinets and Related Products $1.0B 14% 57% 92% 29
  • 30.
    2015 International RevenueSplit* *Based on Company estimates; excludes TopBuild Corp. International Sales Accounted for ~21% of Total 2015 Masco Sales 29% 5% 8% 26% 5% 17% 10% UK Northern Europe Southern Europe Central Europe Eastern Europe Emerging markets Other 30
  • 31.
    Appendix – NetSales and Profit Reconciliations Year Ended December 31, ($ in Millions) 2015 2014 2013 2012 Operating Profit, as reported $ 914 $ 721 $ 612 $ 384 Rationalization charges 18 64 47 74 (Income) charge for litigation settlements - (9) - 1 (Gain) from sales of fixed assets, net (5) - - (8) Impairment of goodwill and other intangible assets - - - 42 Other Specialty Products - warranty - - - 12 Operating Profit, as adjusted 927 776 659 505 Depreciation and amortization 127 141 157 173 EBITDA, as adjusted $ 1,054 $ 917 $ 816 $ 678 ($ in Millions) 2014 Net Sales Net sales, as reported $ 7,006 Currency adjustment (204) Net sales, as reported and FX modified $ 6,802 Operating Profit Operating Profit, as reported $ 776 Currency adjustment (36) Operating Profit, as adjusted and FX modified $ 740
  • 32.
    Appendix – EPSReconciliation (in millions, except per common share data) Year Ended December 31, ($ in Millions) 2015 2014 2012 Earnings Per Common Share Income from continuing operations before income taxes, as reported $ 689 $ 507 $ 155 Rationalization charges 18 64 74 Impairment of goodwill and other intangible assets - - 42 (Income) charge for litigation settlements - (9) 1 (Gain) from sale of fixed assets, net (5) - (8) (Gain) from financial investments, net (6) (4) (22) (Earnings) losses from equity investments, net (2) 2 - Other Specialty Products – warranty - - 12 Interest carry costs - - 7 Income from continuing operations before income taxes, as adjusted 694 560 261 Tax at 36% rate (250) (202) (94) Less: Net income attributable to noncontrolling interest 39 47 35 Income from continuing operations, as adjusted $ 405 $ 311 $ 132 Income per common share, as adjusted $ 1.19 $ 0.88 $ 0.38 Average diluted common shares outstanding 341 352 349