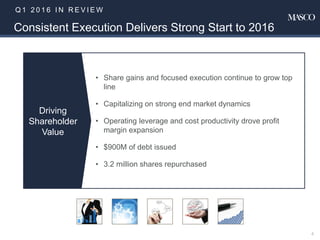
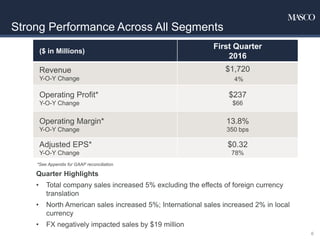
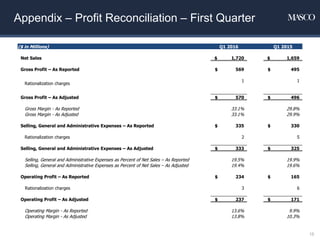
- Masco reported strong results for the first quarter of 2016, with total sales increasing 4% year-over-year to $1.72 billion.
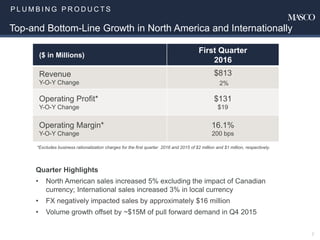
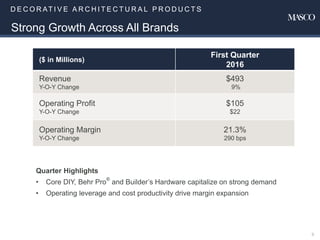
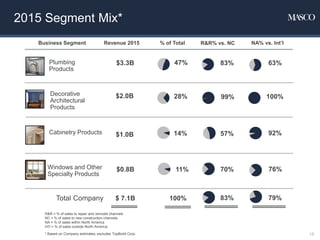
- All of Masco's business segments experienced sales growth in the quarter, with Plumbing Products sales up 2% and Decorative Architectural Products sales increasing 9%.
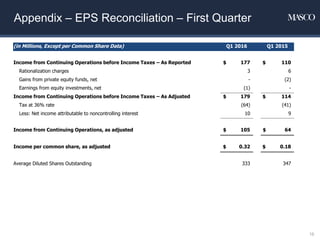
- Increased operating leverage and cost productivity led to a significant expansion in operating margins across most business segments compared to the prior year. Adjusted earnings per share increased 78% to $0.32.


![[ls머트리얼즈]LS Materials 417200 Algorithm Investment Report](https://cdn.slidesharecdn.com/ss_thumbnails/lsmaterials417200algorithminvestmentreport-260202182715-66072c7b-thumbnail.jpg?width=640&height=640&fit=bounds)


