By
Nithin Kumar
Prof - Juris Ozols
Contents
1. About the Company
2. A Brief Description of the Current Business of Unilever
3. Characterization of the process
4. Characterization of the theory of the forecasting process
5. Justification of the choice of forecasting method
6. Analysis of HUL on different methods as follows.
-Time Series analyzing & Forecasting
- Linear & Polynomial Methods
- Exponential Data
- Data Smoothing Method
- Seasonal Data Analysis
-Histogram Method
- Correlation Method
- PivotTable
Group Selection
Slicer
- Profit & Revenue Data Analysis
OVERVIEW OF THE COMPANY
 INCORPORATED: 1933
 INDUSTRY: CONSUMER GOODS.
 HEADQUARTERS: MUMBAI ,MAHARASHTRA.
 KEY PEOPLE: HARISH MANWANI(CHARIMAN)
NITIN PARANJE(MD & CEO)
 TURNOVER: 25,206 CRS.
 PEOPLE: 16000 EMPLOYEES INCLUDING 1500
MANAGERS.
 PARENTAGE: PART OF 44.3 BILLION EUROS OF
UNILEVER GROUP.
 REACH: 6.4 MILLION RETAIL OUTLETS.
 R&D CENTRES: MUMBAI & BANGALORE, INDIA.
INTRODUCTION
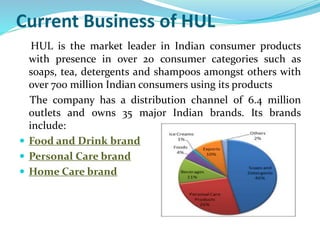
 Hindustan Unilever Limited (HUL) is the largest FMCG
company in India.
 It is owned by the British-Dutch company “Unilever” and
has about 52% majority stake in Hindustan Unilever
Limited .
 Its products include foods, beverages, cleaning agents and
personal care products.
 It is headquartered in Mumbai, Maharashtra, India.
 Hindustan Unilever Limited has over 35 brands spanning
20 distinct categories.
 As per Nielsen market research data, two out of three
Indians use HUL products.
Current Business of HUL
HUL is the market leader in Indian consumer products
with presence in over 20 consumer categories such as
soaps, tea, detergents and shampoos amongst others with
over 700 million Indian consumers using its products
The company has a distribution channel of 6.4 million
outlets and owns 35 major Indian brands. Its brands
include:
 Food and Drink brand
 Personal Care brand
 Home Care brand
How the process go
I have collected a series of data from the Company’s
website from their Annual Reports. Which could be
used for detailed analysis of Revenues, Profit/Loss,
Share price etc. I have taken theTotal revenues figure
to forecast about it in future.
Hindustan Unilever Limited – Balance Sheets
Hindustan Unilever Limited – Profit and Loss Accounts
Justification of the choice of forecasting method
 I have choosen various types of forecasting methods to
analyse the company data & products sales.
 The above mentioned data is collected from various news
papers websites.
 The data shows increase & decrease in profit & loss
statements.
 I have used some of the forecasting methods to analyse
the data with regard to sales of various products to know
the feature sales of that product.
Analysis of Revenues & Forecast of HUL
Table showing past 12 years financial
data
Month
Total Net Revenue
$Billion
2004 7.2
2005 14.8
2006 15.9
2007 24.6
2008 36.5
2009 43.8
2010 88.9
2011 110.5
2012 100.8
2013 180.2
2014 199.9
2015 298.5
Interpretation : The graph clearly explains that in 2004 it is around 7.2 billions in
2005 it is increased to 14.8 billions. From 2006 to 2015 it keep on increasing. In
2011 it is showing 110.5 billions in 2012 it is 100.8 billions there was decrease in
between these years.
0
50
100
150
200
250
300
350
2002 2004 2006 2008 2010 2012 2014 2016
TOTAL NET REVENUE, USD
Analysis of Time Series Data of HUL
Table showing past 12 years financial data
Month
Total Net Revenue
$Billion
2004 7.2
2005 14.8
2006 15.9
2007 24.6
2008 36.5
2009 43.8
2010 88.9
2011 110.5
2012 165.5
2013 180.2
2014 199.9
2015 298.5
0
50
100
150
200
250
300
350
2002 2004 2006 2008 2010 2012 2014 2016
TOTAL NET REVENUE, USD
0.00
50.00
100.00
150.00
200.00
250.00
300.00
350.00
2004 2005 2006 2007 2008 2009 2010 2011 2012 2013 2014 2015
Profit Increase, USD
0.0
0.0
0.0
0.0
0.0
0.0
2002 2004 2006 2008 2010 2012 2014 2016 2018 2020 2022
x100000
Linear & Exponential Growth
Total Net Revenue, $Billion Model 1 (Linear) Model 2 (Expon) Expon. (Total Net Revenue, $Billion)
Linear & Exponential Model forecasting on HUL Total Revenues
Data Smoothing Method on HUL
Period Year Quarter Sales
Third -Quarter Sales Average Fifth -Quarter Sales Average
1 1 1 8.0
2 1 2 12.0 12.0
3 1 3 16.0 17.7 18.0
4 1 4 25.0 23.3 26.0
5 2 1 29.0 34.0 32.4
6 2 2 48.0 40.3 38.2
7 2 3 44.0 45.7 44.2
8 2 4 45.0 48.0 53.4
9 3 1 55.0 58.3 61.6
10 3 2 75.0 73.0 63.0
11 3 3 89.0 71.7 65.0
12 3 4 51.0 65.0 71.8
13 4 1 55.0 65.0 71.2
14 4 2 89.0 72.0 73.2
15 4 3 72.0 86.7 78.8
16 4 4 99.0 85.5
0.0
20.0
40.0
60.0
80.0
100.0
120.0
0 2 4 6 8 10 12 14 16 18
Sales
0.0
20.0
40.0
60.0
80.0
100.0
120.0
0 2 4 6 8 10 12 14 16 18
Sales Average in Third & Fifth Quarter (Smoothing)
Sales Three -Quarter Sales Average Five -Quarter Sales Average
Exponential Method
Days
Lux
INR
Lifebuoy
INR
5 437.00 536
15 687.00 655
13 763.44 1084
12 789.00 1054
2 205.00 1222
10 905.00 1189
14 855.00 781.64
15 900.66 876
11 819.81 1108
30 999.00 991
17 1 010.00 1000
26 1 038.00 830.96
18 1 055.00 815.31
22 1 422.00 902.24
20 1 117.53 922.65
21 1 201.00 788.21
1 1 354.00 943.21
8 1 458.00 1891
25 1 584.00 1013.49
24 1 455.00 963.45
19 1 245.00 1111
3 1 894.00 1323
28 1 639.30 1134.26
9 1 891.00 991.47
5 16 661.00 981.38
4 1 555.00 948.68
23 1 402.36 1197.22
6 1 336.00 1756
27 1 550.47 1889
29 1 807.47 1991
Row Labels
Count of Lux
USD
205-605 2
605-1005 8
1005-1405 9
1405-1805 7
1805-2205 3
>2205 1
Grand Total 30
Row Labels
Count of
Lifebuoy USD
636-841 5
841-1046 13
1046-1251 7
1251-1456 1
1661-1866 1
1866-2071 3
Grand Total 30
0
1
2
3
4
5
6
7
8
9
10
205-605 605-1005 1005-1405 1405-1805 1805-2205 >2205
Total
Total
0
2
4
6
8
10
12
14
636-841 841-1046 1046-1251 1251-1456 1661-1866 1866-2071
Total
Total
Histogram Method on HUL
Row Labels 2006 2008 2009 2010 2011 2012 2013 2014 2015 Grand Total
BHOPAL 224.29 374.22 76.83 84.23 269.21 463.8 38.53 79.68 1610.79
OOTY 153 153
KOLKATA 67.9 202.08 401.49 23.52 694.99
JHARKHAND 517.69 528.63 49.48 58.28 392.87 822.12 2369.07
PONDICHERR
Y 961.66 191.04 566.77 423.82 666.96 2810.25
ORISSA 39.77 444.5 84.8 93.88 178.4 841.35
LUCKNOW 360.74 244.35 35.96 94.16 97.51 139.67 24.98 997.37
CHENNAI 22.76 245.51 333.46 81.91 683.64
Mumbai 123.17 24.65 105.47 253.29
HARYANA 41.42 78.76 536.15 431.61 1087.94
HYDERABAD 44.08 200.01 1253.59 202.53 376.02 81.61 482.45 2640.29
JAMMU &
KASHMIR 81.62 119.95 373.25 274.67 849.49
SHIMLA 65.49 400.91 83.75 304.71 513.82 1368.68
VIJAYAWADA 28.2 127.52 267.92 320.17 313.86 32.35 233.82 1323.84
Delhi 51.82 817.6 92.44 120.39 269.59 441.73 174.59 1968.16
ANDAMAN &
NICOBAR 296.29 121.5 171.97 42.37 140.06 50.83 267.91 1090.93
VIZAG 598.06 466.13 99.09 198.15 180.48 465 38.89 265.09 2310.89
GOA 203.72 246.86 88.05 119.82 220.77 254.6 1133.82
KOCHI 237.34 158.4 40.02 213.82 29.46 223.81 902.85
JAIPUR 22.24 165.48 74 78.66 44.56 155.31 540.25
Bangalore 402.59 62.45 145.09 253.63 149.59 20.88 178.8 1213.03
Grand Total 2895.86 3833.55 3643.81 2946.39 2207.08 3390.09 2398.75 676.79 4851.6 26843.92
0
200
400
600
800
1000
1200
1400
2006
2008
2009
2010
2011
2012
2013
2014
2015
PIVOT TABLE (Payment of Diff Products of HUL
Date Price Date
Surf Excel
INR Surf Excel, 7
Surf Excel,
15
21.10.2014 5.43 21.10.2005 7
22.10.2014 8.92 28.10.2005 8
23.10.2014 8.75 16.11.2005 10
24.10.2014 10.1 30.11.2005 15 16.000
25.10.2014 14.59 14.12.2005 20 19.286
26.10.2014 14.44 27.12.2005 25 23.143
27.10.2014 1.89 03.01.2006 27 27.571
28.10.2014 3.16 13.01.2006 30 31.429 31.200
29.10.2014 2.56 29.01.2006 35 35.000 34.667
30.10.2014 2.27 13.02.2006 41 38.857 38.133
31.10.2014 4.61 23.02.2006 42 42.857 41.733
01.11.2014 3.63 06.03.2006 45 46.571 45.333
02.11.2014 3.12 17.03.2006 52 50.000 49.067
03.11.2014 3.08 18.03.2006 55 52.714 52.667
04.11.2014 5.15 19.03.2006 56 55.857 56.533
05.11.2014 8.43 26.03.2006 59 59.286 60.467
06.11.2014 7.71 02.04.2006 60 62.714 64.400
07.11.2014 8.8 06.04.2006 64 66.143 68.267
08.11.2014 12.64 14.04.2006 69 70.286 72.133
09.11.2014 12.49 21.04.2006 76 74.571 76.133
10.11.2014 1.61 04.05.2006 79 79.429 80.000
11.11.2014 2.82 09.05.2006 85 84.429 84.000
12.11.2014 2.26 20.05.2006 89 88.857 88.600
0
200
400
600
800
1000
1200
1400
1600
1800
2000
9/5/2005 3/24/2006 10/10/2006 4/28/2007 11/14/2007 6/1/2008 12/18/2008
Surf Excel INR
0
200
400
600
800
1000
1200
1400
1600
1800
2000
9/5/2005 3/24/2006 10/10/2006 4/28/2007 11/14/2007 6/1/2008 12/18/2008
15 Periods
Surf Excel INR Surf Excel, 7 Surf Excel, 15
SALES OF SURF EXCEL
-$200,000.00
$0.00
$200,000.00
$400,000.00
$600,000.00
$800,000.00
$1,000,000.00
0 10 20 30 40 50 60
REVENUE COST OF ADVERTISING PROFIT
T G N REVENUE
COST OF
ADVERTISING
PROFIT
0 0% 0 $0.00 $30 000.00 -$30 000.00
1 10% 66614 $86 597.95 $31 000.00 $55 597.95
2 18% 126888 $164 955.01 $32 000.00 $132 955.01
3 26% 181427 $235 855.42 $33 000.00 $202 855.42
4 33% 230776 $300 008.76 $34 000.00 $266 008.76
5 39% 275429 $358 057.10 $35 000.00 $323 057.10
6 45% 315832 $410 581.41 $36 000.00 $374 581.41
7 50% 352390 $458 107.37 $37 000.00 $421 107.37
8 55% 385470 $501 110.64 $38 000.00 $463 110.64
9 59% 415401 $540 021.61 $39 000.00 $501 021.61
10 63% 442484 $575 229.71 $40 000.00 $535 229.71
11 67% 466990 $607 087.31 $41 000.00 $566 087.31
12 70% 489164 $635 913.27 $42 000.00 $593 913.27
13 73% 509228 $661 996.07 $43 000.00 $618 996.07
14 75% 527382 $685 596.76 $44 000.00 $641 596.76
15 78% 543809 $706 951.55 $45 000.00 $661 951.55
HUL PROFIT DATA
Forecasting enterprenuership 2311

Forecasting enterprenuership 2311

  • 1.
  • 2.
    Contents 1. About theCompany 2. A Brief Description of the Current Business of Unilever 3. Characterization of the process 4. Characterization of the theory of the forecasting process 5. Justification of the choice of forecasting method 6. Analysis of HUL on different methods as follows. -Time Series analyzing & Forecasting - Linear & Polynomial Methods - Exponential Data - Data Smoothing Method - Seasonal Data Analysis -Histogram Method - Correlation Method - PivotTable Group Selection Slicer - Profit & Revenue Data Analysis
  • 3.
    OVERVIEW OF THECOMPANY  INCORPORATED: 1933  INDUSTRY: CONSUMER GOODS.  HEADQUARTERS: MUMBAI ,MAHARASHTRA.  KEY PEOPLE: HARISH MANWANI(CHARIMAN) NITIN PARANJE(MD & CEO)  TURNOVER: 25,206 CRS.  PEOPLE: 16000 EMPLOYEES INCLUDING 1500 MANAGERS.  PARENTAGE: PART OF 44.3 BILLION EUROS OF UNILEVER GROUP.  REACH: 6.4 MILLION RETAIL OUTLETS.  R&D CENTRES: MUMBAI & BANGALORE, INDIA.
  • 4.
    INTRODUCTION  Hindustan UnileverLimited (HUL) is the largest FMCG company in India.  It is owned by the British-Dutch company “Unilever” and has about 52% majority stake in Hindustan Unilever Limited .  Its products include foods, beverages, cleaning agents and personal care products.  It is headquartered in Mumbai, Maharashtra, India.  Hindustan Unilever Limited has over 35 brands spanning 20 distinct categories.  As per Nielsen market research data, two out of three Indians use HUL products.
  • 5.
    Current Business ofHUL HUL is the market leader in Indian consumer products with presence in over 20 consumer categories such as soaps, tea, detergents and shampoos amongst others with over 700 million Indian consumers using its products The company has a distribution channel of 6.4 million outlets and owns 35 major Indian brands. Its brands include:  Food and Drink brand  Personal Care brand  Home Care brand
  • 6.
    How the processgo I have collected a series of data from the Company’s website from their Annual Reports. Which could be used for detailed analysis of Revenues, Profit/Loss, Share price etc. I have taken theTotal revenues figure to forecast about it in future.
  • 7.
    Hindustan Unilever Limited– Balance Sheets
  • 8.
    Hindustan Unilever Limited– Profit and Loss Accounts
  • 9.
    Justification of thechoice of forecasting method  I have choosen various types of forecasting methods to analyse the company data & products sales.  The above mentioned data is collected from various news papers websites.  The data shows increase & decrease in profit & loss statements.  I have used some of the forecasting methods to analyse the data with regard to sales of various products to know the feature sales of that product.
  • 10.
    Analysis of Revenues& Forecast of HUL Table showing past 12 years financial data Month Total Net Revenue $Billion 2004 7.2 2005 14.8 2006 15.9 2007 24.6 2008 36.5 2009 43.8 2010 88.9 2011 110.5 2012 100.8 2013 180.2 2014 199.9 2015 298.5 Interpretation : The graph clearly explains that in 2004 it is around 7.2 billions in 2005 it is increased to 14.8 billions. From 2006 to 2015 it keep on increasing. In 2011 it is showing 110.5 billions in 2012 it is 100.8 billions there was decrease in between these years. 0 50 100 150 200 250 300 350 2002 2004 2006 2008 2010 2012 2014 2016 TOTAL NET REVENUE, USD
  • 11.
    Analysis of TimeSeries Data of HUL Table showing past 12 years financial data Month Total Net Revenue $Billion 2004 7.2 2005 14.8 2006 15.9 2007 24.6 2008 36.5 2009 43.8 2010 88.9 2011 110.5 2012 165.5 2013 180.2 2014 199.9 2015 298.5 0 50 100 150 200 250 300 350 2002 2004 2006 2008 2010 2012 2014 2016 TOTAL NET REVENUE, USD 0.00 50.00 100.00 150.00 200.00 250.00 300.00 350.00 2004 2005 2006 2007 2008 2009 2010 2011 2012 2013 2014 2015 Profit Increase, USD
  • 12.
    0.0 0.0 0.0 0.0 0.0 0.0 2002 2004 20062008 2010 2012 2014 2016 2018 2020 2022 x100000 Linear & Exponential Growth Total Net Revenue, $Billion Model 1 (Linear) Model 2 (Expon) Expon. (Total Net Revenue, $Billion) Linear & Exponential Model forecasting on HUL Total Revenues
  • 13.
    Data Smoothing Methodon HUL Period Year Quarter Sales Third -Quarter Sales Average Fifth -Quarter Sales Average 1 1 1 8.0 2 1 2 12.0 12.0 3 1 3 16.0 17.7 18.0 4 1 4 25.0 23.3 26.0 5 2 1 29.0 34.0 32.4 6 2 2 48.0 40.3 38.2 7 2 3 44.0 45.7 44.2 8 2 4 45.0 48.0 53.4 9 3 1 55.0 58.3 61.6 10 3 2 75.0 73.0 63.0 11 3 3 89.0 71.7 65.0 12 3 4 51.0 65.0 71.8 13 4 1 55.0 65.0 71.2 14 4 2 89.0 72.0 73.2 15 4 3 72.0 86.7 78.8 16 4 4 99.0 85.5
  • 14.
    0.0 20.0 40.0 60.0 80.0 100.0 120.0 0 2 46 8 10 12 14 16 18 Sales 0.0 20.0 40.0 60.0 80.0 100.0 120.0 0 2 4 6 8 10 12 14 16 18 Sales Average in Third & Fifth Quarter (Smoothing) Sales Three -Quarter Sales Average Five -Quarter Sales Average Exponential Method
  • 15.
    Days Lux INR Lifebuoy INR 5 437.00 536 15687.00 655 13 763.44 1084 12 789.00 1054 2 205.00 1222 10 905.00 1189 14 855.00 781.64 15 900.66 876 11 819.81 1108 30 999.00 991 17 1 010.00 1000 26 1 038.00 830.96 18 1 055.00 815.31 22 1 422.00 902.24 20 1 117.53 922.65 21 1 201.00 788.21 1 1 354.00 943.21 8 1 458.00 1891 25 1 584.00 1013.49 24 1 455.00 963.45 19 1 245.00 1111 3 1 894.00 1323 28 1 639.30 1134.26 9 1 891.00 991.47 5 16 661.00 981.38 4 1 555.00 948.68 23 1 402.36 1197.22 6 1 336.00 1756 27 1 550.47 1889 29 1 807.47 1991 Row Labels Count of Lux USD 205-605 2 605-1005 8 1005-1405 9 1405-1805 7 1805-2205 3 >2205 1 Grand Total 30 Row Labels Count of Lifebuoy USD 636-841 5 841-1046 13 1046-1251 7 1251-1456 1 1661-1866 1 1866-2071 3 Grand Total 30 0 1 2 3 4 5 6 7 8 9 10 205-605 605-1005 1005-1405 1405-1805 1805-2205 >2205 Total Total 0 2 4 6 8 10 12 14 636-841 841-1046 1046-1251 1251-1456 1661-1866 1866-2071 Total Total Histogram Method on HUL
  • 16.
    Row Labels 20062008 2009 2010 2011 2012 2013 2014 2015 Grand Total BHOPAL 224.29 374.22 76.83 84.23 269.21 463.8 38.53 79.68 1610.79 OOTY 153 153 KOLKATA 67.9 202.08 401.49 23.52 694.99 JHARKHAND 517.69 528.63 49.48 58.28 392.87 822.12 2369.07 PONDICHERR Y 961.66 191.04 566.77 423.82 666.96 2810.25 ORISSA 39.77 444.5 84.8 93.88 178.4 841.35 LUCKNOW 360.74 244.35 35.96 94.16 97.51 139.67 24.98 997.37 CHENNAI 22.76 245.51 333.46 81.91 683.64 Mumbai 123.17 24.65 105.47 253.29 HARYANA 41.42 78.76 536.15 431.61 1087.94 HYDERABAD 44.08 200.01 1253.59 202.53 376.02 81.61 482.45 2640.29 JAMMU & KASHMIR 81.62 119.95 373.25 274.67 849.49 SHIMLA 65.49 400.91 83.75 304.71 513.82 1368.68 VIJAYAWADA 28.2 127.52 267.92 320.17 313.86 32.35 233.82 1323.84 Delhi 51.82 817.6 92.44 120.39 269.59 441.73 174.59 1968.16 ANDAMAN & NICOBAR 296.29 121.5 171.97 42.37 140.06 50.83 267.91 1090.93 VIZAG 598.06 466.13 99.09 198.15 180.48 465 38.89 265.09 2310.89 GOA 203.72 246.86 88.05 119.82 220.77 254.6 1133.82 KOCHI 237.34 158.4 40.02 213.82 29.46 223.81 902.85 JAIPUR 22.24 165.48 74 78.66 44.56 155.31 540.25 Bangalore 402.59 62.45 145.09 253.63 149.59 20.88 178.8 1213.03 Grand Total 2895.86 3833.55 3643.81 2946.39 2207.08 3390.09 2398.75 676.79 4851.6 26843.92 0 200 400 600 800 1000 1200 1400 2006 2008 2009 2010 2011 2012 2013 2014 2015 PIVOT TABLE (Payment of Diff Products of HUL
  • 17.
    Date Price Date SurfExcel INR Surf Excel, 7 Surf Excel, 15 21.10.2014 5.43 21.10.2005 7 22.10.2014 8.92 28.10.2005 8 23.10.2014 8.75 16.11.2005 10 24.10.2014 10.1 30.11.2005 15 16.000 25.10.2014 14.59 14.12.2005 20 19.286 26.10.2014 14.44 27.12.2005 25 23.143 27.10.2014 1.89 03.01.2006 27 27.571 28.10.2014 3.16 13.01.2006 30 31.429 31.200 29.10.2014 2.56 29.01.2006 35 35.000 34.667 30.10.2014 2.27 13.02.2006 41 38.857 38.133 31.10.2014 4.61 23.02.2006 42 42.857 41.733 01.11.2014 3.63 06.03.2006 45 46.571 45.333 02.11.2014 3.12 17.03.2006 52 50.000 49.067 03.11.2014 3.08 18.03.2006 55 52.714 52.667 04.11.2014 5.15 19.03.2006 56 55.857 56.533 05.11.2014 8.43 26.03.2006 59 59.286 60.467 06.11.2014 7.71 02.04.2006 60 62.714 64.400 07.11.2014 8.8 06.04.2006 64 66.143 68.267 08.11.2014 12.64 14.04.2006 69 70.286 72.133 09.11.2014 12.49 21.04.2006 76 74.571 76.133 10.11.2014 1.61 04.05.2006 79 79.429 80.000 11.11.2014 2.82 09.05.2006 85 84.429 84.000 12.11.2014 2.26 20.05.2006 89 88.857 88.600 0 200 400 600 800 1000 1200 1400 1600 1800 2000 9/5/2005 3/24/2006 10/10/2006 4/28/2007 11/14/2007 6/1/2008 12/18/2008 Surf Excel INR 0 200 400 600 800 1000 1200 1400 1600 1800 2000 9/5/2005 3/24/2006 10/10/2006 4/28/2007 11/14/2007 6/1/2008 12/18/2008 15 Periods Surf Excel INR Surf Excel, 7 Surf Excel, 15 SALES OF SURF EXCEL
  • 18.
    -$200,000.00 $0.00 $200,000.00 $400,000.00 $600,000.00 $800,000.00 $1,000,000.00 0 10 2030 40 50 60 REVENUE COST OF ADVERTISING PROFIT T G N REVENUE COST OF ADVERTISING PROFIT 0 0% 0 $0.00 $30 000.00 -$30 000.00 1 10% 66614 $86 597.95 $31 000.00 $55 597.95 2 18% 126888 $164 955.01 $32 000.00 $132 955.01 3 26% 181427 $235 855.42 $33 000.00 $202 855.42 4 33% 230776 $300 008.76 $34 000.00 $266 008.76 5 39% 275429 $358 057.10 $35 000.00 $323 057.10 6 45% 315832 $410 581.41 $36 000.00 $374 581.41 7 50% 352390 $458 107.37 $37 000.00 $421 107.37 8 55% 385470 $501 110.64 $38 000.00 $463 110.64 9 59% 415401 $540 021.61 $39 000.00 $501 021.61 10 63% 442484 $575 229.71 $40 000.00 $535 229.71 11 67% 466990 $607 087.31 $41 000.00 $566 087.31 12 70% 489164 $635 913.27 $42 000.00 $593 913.27 13 73% 509228 $661 996.07 $43 000.00 $618 996.07 14 75% 527382 $685 596.76 $44 000.00 $641 596.76 15 78% 543809 $706 951.55 $45 000.00 $661 951.55 HUL PROFIT DATA