Downloaded 31 times
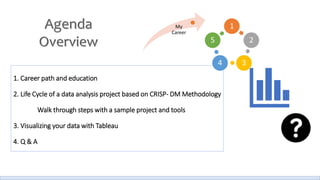
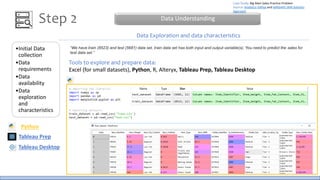
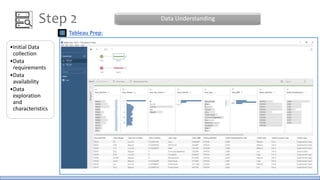
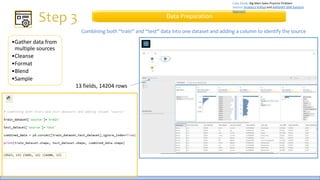
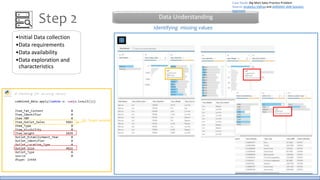
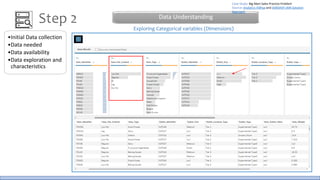
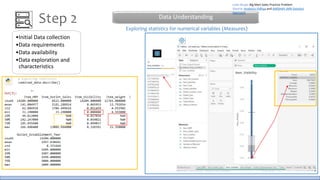
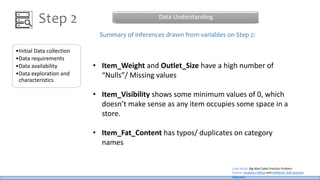
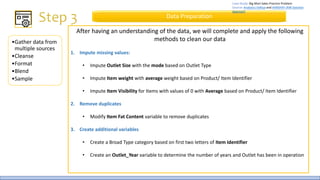
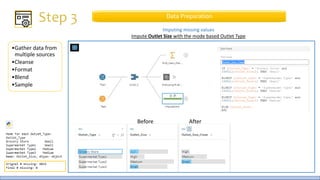
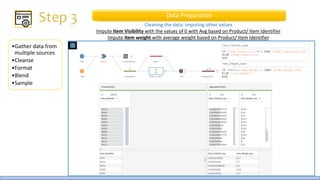
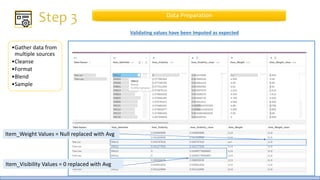
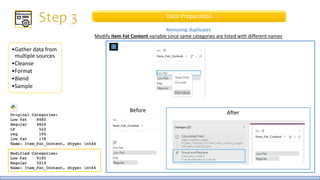
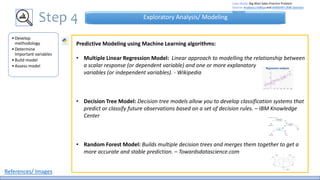
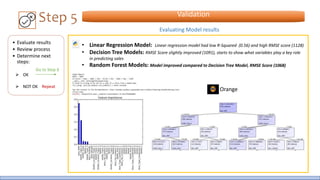
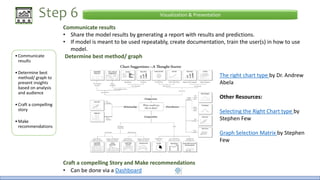
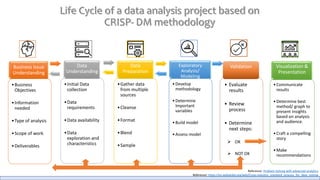


The document discusses the life cycle of a data analysis project using the CRISP-DM methodology and visualizing data with Tableau. It walks through a sample project on predicting BigMart sales. The stages include business understanding, data understanding, data preparation, modeling, evaluation, and presentation. For the case study, the document cleans the data, builds linear regression, decision tree and random forest models, and evaluates the models to identify the best for predicting sales. It concludes with tips for learning Tableau and data visualization.