This document summarizes several studies on birth defects in children conceived through assisted reproductive technologies like IVF and ICSI:
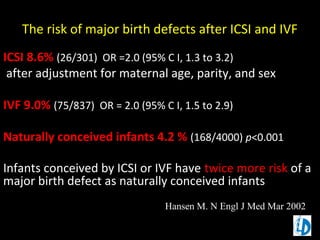
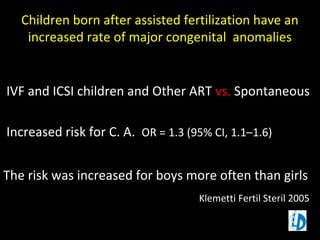
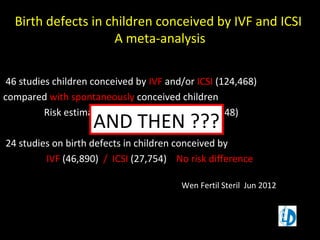
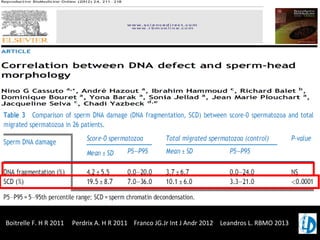
- Meta-analyses found that ICSI and IVF are associated with a 40-70% increased risk of major birth defects compared to spontaneously conceived children. The risk was higher for singleton births and boys.
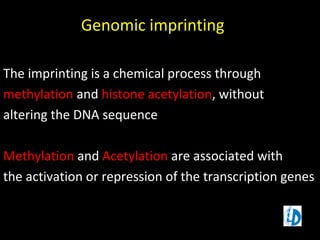
- A Danish study found infertility itself may be an independent risk factor for birth defects, as children conceived naturally after infertility also had a higher risk than spontaneously conceived controls.
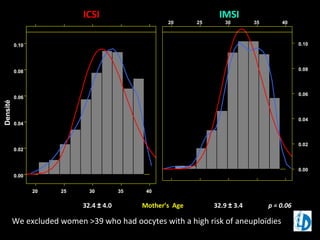
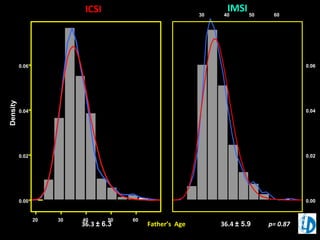
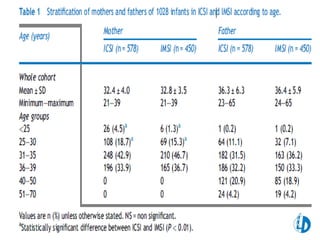
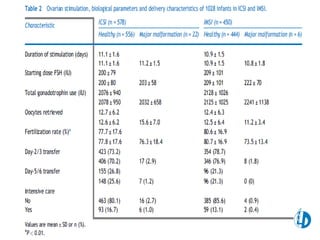
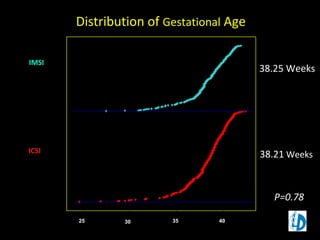
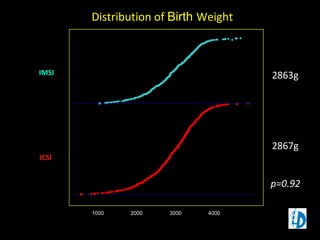
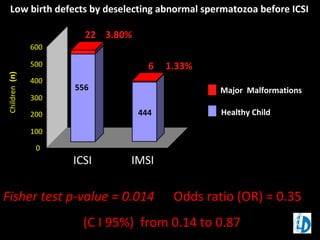
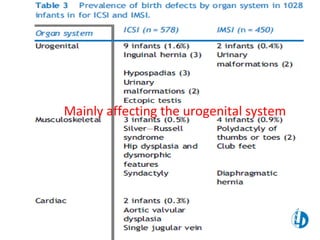
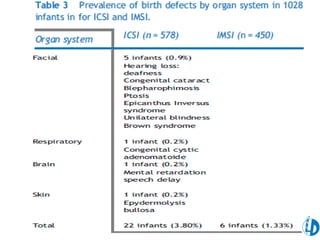
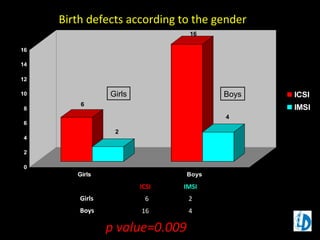
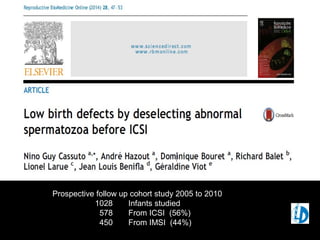
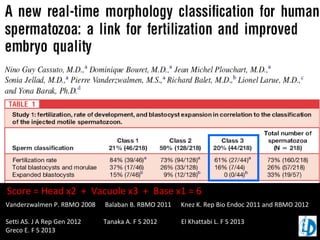
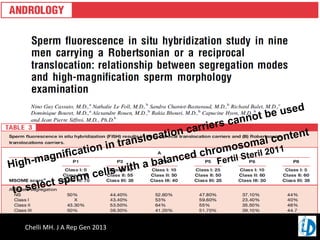
- A prospective study of over 1,000 ICSI and IMSI births found IMSI was associated with a significantly lower rate of major malformations, especially in male children. IMSI may help select sperm with normal

![Hansen et al.
METHODS Meta-analysis ;
25 studies
7 selected
RESULTS Combined group of IVF
and ICSI children
both singleton and
multiples
OR 1.40 [1.28-1.53]
Singleton
OR 1.35 [1.20-1.51]
2.27
2.04
1.64
1.53
1.39
1.36
1.4095%ci 1.28-1.53
Human Reprod 2005; 21;328-338](https://image.slidesharecdn.com/kiev-140627060306-phpapp02/85/Follow-up-Children-after-Sperm-Injection-4-320.jpg)
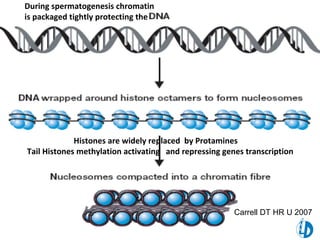
![Rimm et al.
J Assisted Reprod Gent 2005; 21:437-443
OR 1.29 [1.01-1.67]
V: IVF Study X: ICSI Study C: Combined study
METHODS Meta-analysis ;
44 studies
19 selected
RESULTS Combined group of IVF and
ICSI children
both singleton and multiples
versus
Spontaneous
OR 1.29 [1.01-1.67]](https://image.slidesharecdn.com/kiev-140627060306-phpapp02/85/Follow-up-Children-after-Sperm-Injection-6-320.jpg)
![Zhu et al.
Methods Danish national birth cohort; 1997-2003
Congenital malformation at singletons birth (register(
tried to untangle difference in risk associated with the technology and
the risk that may be associated with infertility per se
By choosing a group of infertility problems (time to pregnancy >12 months(
Population
A 50,897 without infertility problem - conceived spontaneously
B 5,764 with infertility problem - conceived spontaneously
C 4,588 with infertility problem - after infertility treatment
Results A 5.0% 1.0
B vs. A 6.0% 1.20 [1.07-1.35]
C vs. A 6.7% 1.39 [1.23-1.57]
Adjusted for Maternal age, pre-pregnancy BMI, smoking, alcohol intake, occupational status
Conclusion A significant risk for CM was evident in the group with infertility problems that
conceived spontaneously as compared to SC and even higher in the group that
received infertility treatments
suggesting that infertility by itself could be an in-depended risk factor
BMJ. 2006;333:679](https://image.slidesharecdn.com/kiev-140627060306-phpapp02/85/Follow-up-Children-after-Sperm-Injection-8-320.jpg)


![ONFH[AVN HIP] -TRIPLE REGIME -A NOVAL SURGICAL CONCEPT .pptx](https://cdn.slidesharecdn.com/ss_thumbnails/onfhavnhip2026koaconcalicutdrgokuldevdrmashraf-260210064517-213ec005-thumbnail.jpg?width=640&height=640&fit=bounds)


![PERI-PROSTHETIC FRACTURE NAIL-PLATE CONSTRUCT [NPC].pptx](https://cdn.slidesharecdn.com/ss_thumbnails/drarunkumardrmohamedashrafperiprostheticfrasturenail-plateconstructnpc-260209164459-7e9d15a1-thumbnail.jpg?width=640&height=640&fit=bounds)


