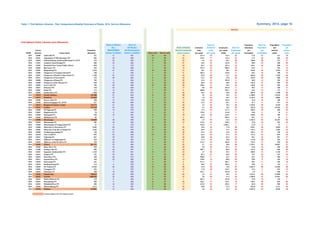
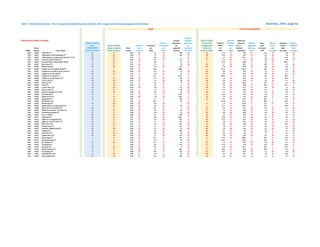
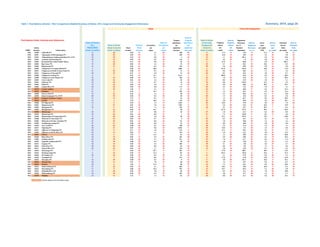
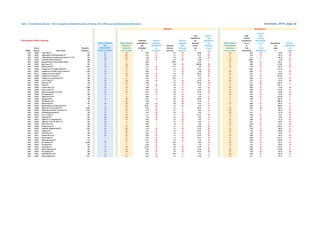
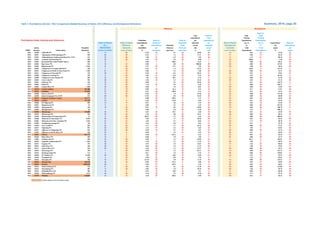
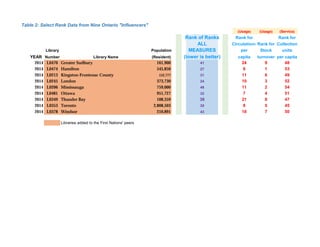
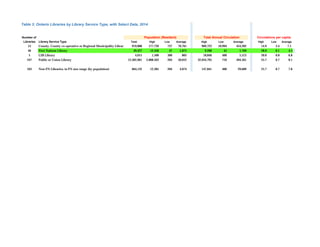
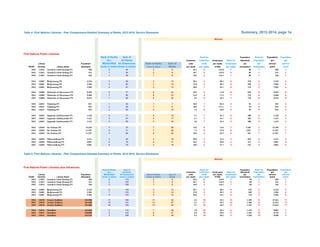
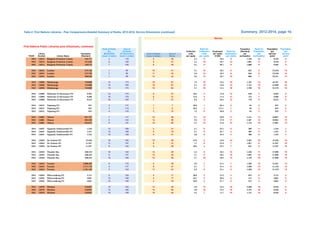
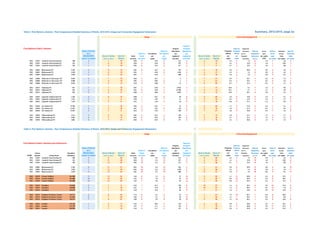
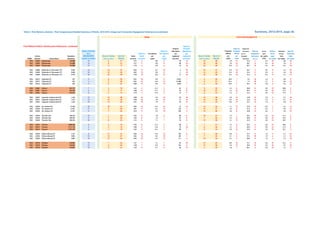
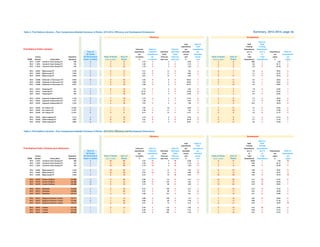
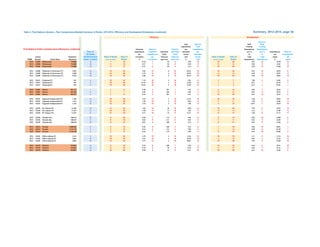
This document provides detailed data and rankings for 46 First Nations libraries in Ontario from 2014, as well as comparisons including 9 major Ontario public libraries, in order to analyze how the First Nations libraries compare to their peers. The data is broken down into tables across multiple pages, with rankings and data for each library for various metrics organized within 5 dimensions: Service, Usage, Efficiency, Development, and an overall ranking. The document discusses the methodology and limitations of the analysis, and how the results can help identify individual library strengths and weaknesses compared to similar libraries.
Presentation given at: "FP7 Information Day on Research PPPs'", 11-12 July 2011, Brussels (Charlemagne) - http://ec.europa.eu/research/industrial_technologies/events-fp7-programme-2011_en.html .
The document provides information about conducting research using the resources available at Beaman Library. It outlines the various information resources like books, articles, databases, and electronic resources that are available. It also describes the research process and how to evaluate different sources. The library staff is available to help students with their research needs.
Lecture presented by Marian Ramos Eclevia at PAARL's Summer Conference on the theme "Library Analytics: Data-driven Library Management", held at Pearl Hotel, Manila on 20-22 April 2016
The document provides information about conducting research using the resources available at Beaman Library. It outlines the library's collection of books, articles, and electronic databases that can be accessed on or off campus. It also describes the research process, including how to evaluate sources and the interlibrary loan service for obtaining resources not available in the library.
LibQUAL is a standardised survey instrument developed by the Association of Research Libraries (ARL) that measures user perceptions of library services. Libraries implement LibQUAL periodically to better understand user priorities and to monitor library performance relative to student and faculty expectations.
UBC Library ran LibQUAL in 2007, 2010, 2013, and 2016. While survey questions are broad and results do not prescribe specific actions, the survey helps libraries understand their longitudinal performance in four areas:
Library collections
Access to collections
Library spaces
Customer service
As in past years, UBC Library ran LibQUAL separately at the Okanagan and Vancouver locations. At both locations the survey opened Monday, January 18 and ran for 3 weeks, closing Friday February 5. This report is limited to results of the Vancouver survey.
The document summarizes and compares the visual design and content of several state library websites. It notes key design elements like margins, images, menus and links on each site. Features like news feeds, logos and search boxes are also mentioned. The sites are evaluated on their use of space, organization of information and presence of dynamic content.
The Road from Millennium to Alma: Two Tracks, One DestinationNASIG
This document summarizes the experiences of two universities, Colorado State University and Central Connecticut State University, in migrating from their previous library management systems (Millennium and an unnamed system) to Ex Libris's Alma system. It describes the projects' timelines, training approaches, data cleaning and migration processes, configuration of various Alma modules, testing in the new production environment, lessons learned, and post-migration workflows. The universities took different approaches to the migration based on their sizes and organizational structures but both projects were completed successfully.
The document discusses several topics related to libraries including staff manuals, library surveys, library statistics, and library standards. It provides information on the purpose and types of staff manuals. It also describes the categories and qualifications of library staff as well as the importance and techniques of conducting library surveys and collecting library statistics. Finally, it defines library standards and discusses their need.
Longitudinal Journal Usage Analysis and the Development of Institutional Spec...Charleston Conference
This document summarizes a longitudinal analysis of journal usage at a university over three years (2012-2014). Key findings include: (1) Approximately 20-25% of available journals accounted for nearly all usage, conforming to Pareto's Law. (2) Nearly 6,000 journal titles saw some usage in all three years. (3) Over 3,300 titles were used in 2013-2014, and hundreds were used across other two-year periods. Core journal lists were proposed based on consistently high-usage titles within subjects.
This presentation was delivered as part of the Digital Humanities at Oxford Summer School in July 2016. It provides a general introduction to relational databases, including an overview of the benefits of this method of storing and structuring data, and a guide to designing a database structure.
Some slides include further explanation in the notes pane: download a copy of the presentation to see these.
The document provides an overview of resources and services available at Beaman Library to support graduate student research. It discusses locating and evaluating information in different formats, including books, articles from print and online databases, and websites. Services like interlibrary loan are also mentioned for accessing materials not held in the local collection.
JUSP webinar: Reporting with COUNTER R4 and R5 dataJUSPSTATS
The webinar covered reporting with COUNTER R4 and R5 usage data. It discussed the transition to R5, data available in JUSP, deciding what to report, comparing real R4 and R5 data, and demonstrated useful JUSP reports and functionality. Temporary access to content during COVID-19 was also addressed, as it impacts usage counts. Attendees participated in polls about their library's reporting position and preferred R5 metrics and had the opportunity to ask questions.
Don't stop the presses! Study of Short-Term Return on Investment on Print Boo...Maria Savova
How long are we willing to wait for a book to demonstrate value? How many circulations are enough? Today, there is more pressure to show return on investment (ROI) than there used to be thirty, twenty, or even ten years ago. In the era of increasingly electronic, demand-driven, and evidence-based collection development, the once reigning print book is ceding its central place within library collections. While faculty and students are showing renewed interest in print materials, flat or declining library budgets, along with inevitable increases in electronic subscription rates, put downward pressure on print monograph funding. Libraries continue to develop their print book collections, however, we need to develop a data-driven approach to guide selection and acquisition of the most relevant print books. The Claremont Colleges Library conducted a short-term ROI study comparing recent print books acquired under three different acquisition modes: approval autoship, demand-driven purchase, and librarian selection. We looked at short-term ROI averages for each acquisition mode, including how long it takes for a book to circulate for the first time and how many times books circulate within the first year after acquisition. We also reviewed the number of books, overall expenditure per acquisition mode, and disciplinary distribution of print book acquisitions from a historical perspective, exploring how the proportions of expenditure between print approval and firm ordering changed at the advent of demand-driven purchasing and the proliferation of e-books. The audience will learn how this study’s findings are informing our budgeting strategies and future collection development.
Relationships between tables are critical in a relational database because they link data separated across tables and impact how queries retrieve answers. There are three main relationship types: one-to-many, which is most common; many-to-many, used in transaction and student databases; and one-to-one, which is rare. A primary key uniquely identifies records in a table and cannot be duplicated or contain null values. Foreign keys in one table reference the primary key of another table to represent relationships. Relationships are defined by matching keys between tables which must have the same data type and field size.
Ontarians continue to hold largely positive views of public libraries and recognize their value to communities. While library usage patterns have changed with new technologies, the number of users has remained steady. Younger people may have different expectations of libraries than older generations. The library will need to regularly review and adapt its strategies and services to remain relevant. Effective communication will be critical to promote new offerings and build awareness among key audience segments. The future role and impact of libraries remains uncertain and must be shaped according to the evolving needs of users.
FrankenLibraries or Librarytopia? discusses potential futures for libraries. It notes that libraries' core skill is improving users' questions, not just delivering information. It asks if libraries are prepared to support unlimited content across formats and high consumer expectations. The document suggests libraries embrace change, control their attitude towards it, and accept change is constant to ensure relevance in the future.
This document discusses tools for social media engagement and strategies for building staff capacity. It provides an overview of the social media ecosystem and popular platforms like blogs, wikis, YouTube and Twitter. It emphasizes the importance of understanding audience demographics and listening to what people say about an organization online. The document also describes the "23 Things" model for training staff on social media through bite-sized self-guided modules covering different tools and tasks. The goal is to help organizations effectively engage their audiences and build staff skills for using social media.
This document summarizes provincial priorities for public libraries in Ontario from 2008 to 2017. It identifies 4 key strategies that emerged from stakeholder responses: communities of practice, competencies for library staff, qualitative and quantitative analysis for libraries, and collaborative tools to promote libraries. It provides updates on initiatives relating to each of these strategies, such as training surveys. It also discusses the Ontario Culture Strategy, current ministry initiatives like a First Nation study and library program review, and strategic plans from library organizations. The document concludes by asking participants to discuss if current efforts are still on track and identify new priorities.
The document summarizes the results of a 2015 survey of Ontario residents about their use, opinions, and perceptions of public libraries. Key findings include that 31% of residents had not used a public library in the past year, with the most common reasons being that they get information from other sources or lack of interest. While in-person library visits have remained steady, online access via libraries' websites has increased. Residents see the public library as conveniently located and a welcoming place, but engagement in activities at libraries has declined slightly compared to 2010.
Portsmouth public library evening presentationStephen Abram
The document discusses the future role and services of public libraries. It argues that libraries will expand beyond traditional collections to take on new roles like providing maker spaces, virtual reality studios, gaming areas, and equipment for circulating items like drones, robots and internet of things devices. Libraries will also archive more community information and serve as innovation hubs where people can learn new skills. Complex search capabilities will let people search in new ways using attributes like smell, taste and touch. Overall, the document envisions libraries becoming vibrant community centers that foster creativity, learning and collaboration.
Targeting and tracking audiences on social mediaStephen Abram
This document discusses Toronto Public Library's use of social media platforms like Instagram, LinkedIn, Tumblr, and others to engage audiences and deliver services. It provides statistics on TPL's social media following compared to other libraries and organizations. It also outlines TPL's social media teams and processes, tools for monitoring and reporting on social media, and examples of successful social media campaigns.
Crosby social media the strategic contextStephen Abram
This document discusses social media strategy frameworks for libraries. It outlines the key elements of developing an effective social media strategy including learning about current trends, defining objectives, establishing governance policies, identifying activities, developing staff capabilities, measuring engagement, and listening to audiences. An important part of the strategy involves determining how social media supports existing organizational goals like marketing, outreach, and recruitment. The framework also stresses the importance of understanding risks, setting policies, and organizing teams through various governance models.
Hpl october 3 social media presentation finalStephen Abram
The document discusses the Hamilton Public Library's use of social media. It provides an overview of their social media policy and platforms including Facebook, Flickr, Instagram, Pinterest, Twitter, and YouTube. It discusses their social media campaigns and successes, as well as the analytics tools they use to track engagement and determine the best times to post. The document also covers their social media strategy of promoting programs from their quarterly guide across various channels and sharing data-driven stories.
The document discusses modernizing provincial funding for public libraries in Ontario in the context of the new Ontario Culture Strategy. It provides background on current provincial funding levels and models. Key recommendations include:
1) Leveraging provincial investments in public libraries to maximize their impact through initiatives like expanding library service organizations, collaborative licensing, and modernizing data collection.
2) Investing in public library infrastructure to support priorities in the culture strategy like cultural programming, digital resources, and employment initiatives.
3) Investing in strategies that support community development through public libraries, including cultural programming, youth initiatives, and ensuring digital access for Indigenous communities.
The document advocates that increasing and modernizing provincial funding is needed to better support the
Culture strategy presentation ola feb 2017Stephen Abram
The document provides an overview of Ontario's Culture Strategy, which was developed through province-wide consultations to understand what culture means to Ontarians and identify actions to strengthen culture. The strategy has a vision of inclusive cultural opportunities and celebration of diversity. It includes goals in cultural engagement, strengthening communities, fueling the creative economy, and promoting arts across government. Implementation over five years includes 40 actions addressing areas like Indigenous culture, arts in schools, and supporting public libraries, with progress reporting annually.
This document discusses storytelling as a way to understand and engage communities. It describes an OpenMediaDesk tool that libraries can use to create and test stories from their communities in order to better promote the libraries' services and programs. The OpenMediaDesk process involves collaborating with community members to generate and share stories about the library through social media. This helps libraries understand their communities and demonstrates the library's impact in a way that engages more people.
This document discusses the importance of user experience (UX) research in developing richer websites for public libraries. It provides examples of how UX research methods like usability testing, surveys, and contextual inquiry can provide insights that lead to improved designs. The key benefits of UX research highlighted include removing clutter, optimizing for user needs, allowing the site to teach users, and nudging users towards beneficial behaviors.
Ontarians visit their public libraries more than any other cultural, recreational, or commercial activity. Public libraries in Ontario average 198,630 visits per day - more daily visits than all major sports teams combined and more than foreign tourists visiting all of Canada. With over 1,157 branches serving 99.34% of Ontario's population, public libraries are truly the most widely used and accessible community hubs across the province.
A customer journey map is a diagram that charts the various steps a customer takes to accomplish a goal by detailing their attitudes, needs and touchpoints across channels at each stage. It is created by following individual users through their process and noting opportunities for improvement. Journey mapping is useful because it provides a holistic view of the customer experience that involves multiple departments and touchpoints. It also shifts company culture towards a more user-centered mindset by focusing on customers rather than internal processes, and allows for collaboration through an easy to share visual format that can lead to better customer experiences.
The FOPL Statistics Project aims to help Ontario's public libraries better define their value and impact. It has led to improved data collection and reporting on key library metrics and studies on topics like early literacy, economic impact, and public opinion. This work has helped libraries strengthen their advocacy and positioning by providing evidence of their contributions in areas like education, employment, and community support. The project also identified gaps in libraries' skills and relationships that it has worked to address through initiatives developing staff capacity, building new partnerships, and modernizing marketing.
I school 2017_design_thinking_challengeStephen Abram
This document outlines a design thinking challenge workshop where participants will go through the design thinking process to design something useful for their partner based on learning about their needs. The workshop involves empathizing through interviews, defining the problem, ideating potential solutions, building a prototype, and testing it with their partner. Participants will work through sections in a workbook to guide each stage. The goal is for them to experience human-centered design, prototyping, iteration and other core design thinking values to ultimately create something meaningful that addresses their partner's needs.
OpenMediaDesk is a proprietary branded content newsroom and methodology for Ontario's libraries to create, test, and publish multimedia experiences to improve marketing communications and promote libraries as essential community services. It enhances community collaboration by optimizing the user experience and outreach via real-time community data to design relevant programming. OpenMediaDesk acts as an actionable intelligence tool and data-driven story engine to share library-centric stories from community members back to the greater community through social media and websites. The goal is to engage the community and drive engagement with the library and its services through high-relevance storytelling.
This document discusses new performance measures and rankings for public libraries in Ontario. It begins by outlining common uses of library data like budget justification and comparing libraries. The document then reviews the history of library data collection and issues with comparisons. It describes the Ontario public library data that is now available in standardized CSV files from 1999-2014. This will allow analysis of trends over time. The document presents some initial exploratory analysis including rankings of libraries by expenditures and circulations per capita. It proposes developing an experimental index to measure library performance across multiple dimensions. Feedback on the analysis and index is sought as the work continues with new data.
This document summarizes a presentation given by Dr. Robert Molyneux and Stephen Abram on FOPL's Ontario Public Library Statistics and Measurements Report. It provides an overview of the report, which analyzes trends in Ontario public library statistics from 2001-2013 using data collected by the Ministry of Tourism, Culture and Sport. Key findings include that circulation and visits have remained steady while digital transactions are growing. The presentation examines the data through ratios, band comparisons based on library size, and rank order tables. It cautions that library statistics are complex and recommends qualitative surveys to better understand changing user needs.
The document summarizes an overview webinar about the Ontario Public Library Statistics and Measurements Report published by the Federation of Ontario Public Libraries (FOPL). The webinar provided an overview of the report which analyzes statistics collected annually from Ontario public libraries from 2001-2013. It discussed how the data can be used, limitations of library statistics, and examples of analysis and comparisons in the report including trends in circulation and expenditures. The webinar aimed to demonstrate how the data set could be explored and help inform library decision making.
1) Dr. Lesley Farmer researched school library standards in California to determine which variables best support student academic achievement.
2) The research questions examined which school library media program standards significantly impact student success, and whether programs meeting baseline standards differed from those not meeting standards.
3) The methodology included a literature review and analysis of California and national school library data to establish baseline standards in areas like staffing, technology access, and collections. Programs meeting all standards were compared to those not meeting standards.
presentation on an analysis of datasets for California developed standards for the library program factors that provide conditions for students to meet library standard outcomes.
The document discusses strategies for analyzing and presenting library data, including taking the user's point of view, examining trends and projections, comparing libraries, and putting libraries in social context. Specific strategies mentioned include using per capita statistics, the market basket approach, competitive comparisons, examining taxpayer perspectives, tracking trends over time, adjusting for inflation, projecting future needs, identifying peer libraries, and rankings. Examples are provided for many of these strategies.
A Model for Assessing Relative Interest in E-books Compared to Printsknwlton
This document summarizes a library scientist's research into developing a model for comparing usage of e-books to print books. The researcher found that simply comparing whether a title was used at all, rather than number of uses, allows for an effective comparison. Combining this binary usage test with analyzing usage by subject area as a percentage of holdings in that area provides insights into patron preferences and areas for collection development. The results showed preferences varying by subject, with some subjects showing much higher usage of e-books and others much higher usage of print.
In February 2013 UBC Library implemented the LibQUAL+® survey for the fourth time, asking a random sample of students and faculty about their experience and expectations of the Library. The LibQUAL 2013: UBC Vancouver survey results report is available now.
This document summarizes a student's research on fall reduction in hospitals using both website and library database searches. The student searched Google and Yahoo and evaluated websites using the Kent and Cornell evaluation tools. They also searched the library databases CINAHL and ProQuest. Two relevant sources were found, one from each database. A full-text article from CINAHL discussed a study that used low-low beds to help reduce falls and injuries in hospitals. A second source from ProQuest discussed fall reduction but did not have full text. The student provided a table summarizing their search results and citations for the sources.
Reference philosophy in a rural library districtMary Chance
The document analyzes the reference philosophy of a rural library district (RLD) through interviews and observation. It finds that the RLD's conservative philosophy, driven by budget cuts, leaves patrons without adequate assistance. Staff are unsure of policies and focus on empowering patrons through self-service with little help. A clear district policy and expanded definition of reference could better serve patron needs and inform leadership decisions.
This document discusses databases and their components. It defines what a database is and different types of databases like structured, free-form, operational, and analytical databases. It also explains database models like hierarchical, network, relational, entity-relationship, object-relational, and dimensional models. Key components of databases are discussed including tables, records, fields, keys, and relationships. The roles and uses of databases and best practices for database design are also summarized.
Awash in eJournal Data: What It Is, Where It Is, and What Can Be Done With It.Charleston Conference
This document discusses usage data from eJournal subscriptions. It begins by introducing the authors and their affiliations. It then outlines the inspiration and work of an Elsevier evaluation team tasked with analyzing usage of Elsevier products. This included gathering usage, cost-per-use, interlibrary loan, publishing and citation data. The techniques learned were then extended to analyze other publishers. The document discusses the universe of usage data available and how it can be used for collection decisions and demonstrating library value despite limitations and issues with interpretation. It provides examples analyzing Elsevier usage data and impact factors to influence collections.
Using the unbundling power of Unsub responsibly: unveiling its assumptions an...Jason Price, PhD
Here are the key points about configurable ILL parameters in Unsub:
- Unsub allows libraries to adjust the percentage of "delayed access" articles that actually result in ILL requests, as this percentage varies widely across institutions.
- The default is 5%, but libraries can increase this percentage to better reflect their local ILL fulfillment rates for articles not available via subscriptions, perpetual access, or open access.
- Increasing the ILL percentage reduces the amount of "delayed access" and more accurately portrays how many articles are truly unavailable or "turnaways".
- Adjusting the ILL parameter is important for libraries to customize Unsub's predictions to align with their local ILL fulfillment realities.
It’S Been Geometric! Genco Ppt For Montreal Sessionbgenco
The document summarizes the results of a survey on the growth and acceptance of eBooks in US public libraries. Some key findings include:
- The majority of libraries surveyed offered eBooks and other downloadable formats, with collections growing significantly over the past 3 years.
- OverDrive was the most commonly used vendor, and libraries valued a wide selection of titles and flexible circulation models.
- While eBook usage is still lower than print, it is growing rapidly and supplementing - not replacing - other formats in most libraries. Ebooks are popular among all age groups.
This document discusses four separate tools: PubMed, My NCBI, eRA Commons, and PubMed Central. PubMed is a database of biomedical citations. My NCBI allows customizing information from NCBI databases. eRA Commons manages and shares grant administration information. PubMed Central is an archive of freely accessible full-text biomedical journal articles, particularly those required by NIH public access policy. The tools work together, with information flowing between PubMed, My NCBI, eRA Commons, and publications in PubMed Central.
Discovery or Displacement? A Large Scale Longitudinal Study of the Effect of ...Jason Price, PhD
This document summarizes a large scale longitudinal study examining the effect of discovery systems on online journal usage. The study analyzed journal usage data from 24 academic libraries before and after implementing a discovery service. It found that while some publishers saw an increase in usage and some saw a decrease, the change in usage varied significantly depending on both the discovery service and the individual library. The study utilized ANOVA models to determine that discovery service, library, and the interaction between discovery service and publisher were significant predictors of changes in journal usage. The results indicate the effect of discovery systems on usage is complex and depends on multiple factors.
Whenever you make a list of anything – list of groceries to buy, books to borrow from the library, list of classmates, list of relatives or friends, list of phone numbers and so o – you are actually creating a database.
An example of a business manual database may consist of written records on a paper and stored in a filing cabinet. The documents usually organized in chronological order, alphabetical order and so on, for easier access, retrieval and use.
Computer database are those data or information stored in the computer. To arrange and organize records, computer databases rely on database software
Microsoft Access is an example of database software.
This document provides an overview of databases, including:
- Databases are collections of organized data that are used to store information for personal, business, social, and religious purposes.
- There are different types of databases including structured, free-form, operational, and analytical databases.
- Key database concepts are introduced like tables, records, fields, primary keys, and relationships between tables.
- Different database models are described such as hierarchical, network, relational, dimensional, and object-relational models.
This document provides an overview of databases, including:
- Databases are collections of organized data that are used to store information for personal, business, social, and religious purposes.
- There are different types of databases including structured, free-form, operational, and analytical databases.
- Key database concepts are introduced like tables, records, fields, primary keys, and relationships between tables.
- Different database models are described, from hierarchical and network to relational and object-oriented models. Relational databases are now the most common.
This document summarizes a presentation by the State Advisory Council on Libraries (SACL) about how libraries in Nebraska are handling "the new normal" brought about by tough economic times. It discusses results from SACL surveys in 2010 and 2011 that found many libraries had to reduce services, materials budgets, and hours in response to lower budgets. However, it notes that Nebraska has fared better than many other states. The presentation discusses strategies discussed by SACL for guiding libraries through these challenges, such as focusing on essential services, increased technology use, collaboration, and advocacy. It provides several resources for further reading on this topic.
Passive Interactive Programming and Surveys 2.pptxStephen Abram
Passive interactive community experiences aim to foster connection and engagement among participants without requiring direct interaction. The document discusses creating a sense of shared experience and connection through ambient or peripheral means that do not demand participants' active involvement or direct interaction with others.
Hub Design Inspiration Graphics for inspirationStephen Abram
This document provides images and ideas to spark discussion about designing community spaces in a new hub. It includes sections with inspirations and examples for areas like kids' zones, outdoor seating, gardening, reading areas, collaboration spaces, and more. The goal is to organize visual ideas around functions and uses to help envision what the space could offer users over time. It also references an external article about 10 essential library spaces as additional guidance.
Hub Design Inspiration Graphics for Community HubsStephen Abram
This document provides images and ideas to spark discussion about designing a community space. It includes sections with inspirations for areas like kids zones, outdoor seating, gardening, reading areas, collaboration spaces, and more. The goal is to think creatively about how the space can be used by people of all ages through flexible, multi-purpose design.
Passive Interactive Programming and Surveys 2.pptxStephen Abram
Passive interactive community experiences aim to foster connection and engagement among participants without requiring direct interaction. These experiences allow people to feel involved within a community through observing and reacting to shared content, while not necessitating back-and-forth communication between individuals. The goal is to give people a sense of participation and belonging even if they choose to interact on a more passive level.
Hub Design Inspiration Graphics for Brockville HubStephen Abram
This document provides images and ideas to spark discussion about designing a community space. It includes sections with inspirations and examples for areas like kids zones, seating, gardening, reading areas, co-working spaces, maker spaces, cultural spaces, and more. The goal is to think about how the space can be used and evolve over time to meet community needs.
Hub Design Inspiration Graphics second draftStephen Abram
This document provides images and ideas to spark discussion about designing a community space. It includes sections with inspirations and examples for areas like kids zones, seating, gardening, reading areas, cafes, co-working spaces, maker spaces, cultural spaces, and more. The goal is to think about how the space can be used and evolve over time to meet community needs.
This document is a draft active transportation plan for the City of Brockville. It recommends initiatives to encourage walking and cycling through new infrastructure like bike routes. The plan was developed with public input, which identified a lack of connected cycling routes as a key barrier. It proposes a cycling network with 42 km of "spine routes" and 39 km of "connector routes" along with pedestrian improvements. The plan also provides policy, funding, maintenance and programming recommendations to promote active transportation long-term.
This document provides images and ideas to spark discussion about designing a community space. It includes sections with inspirations and examples for areas like kids zones, outdoor spaces, seating, gardening, reading areas, cafes, meeting spaces, maker spaces, cultural spaces, and more. The goal is to think about how the space can be used and evolve over time to meet community needs.
Caregiver Presentation and Product Inspirations Sep 2023 PDF.pdfStephen Abram
This document provides information about products and tools to help caregivers of those with dementia. It discusses goals of increasing quality of life, independence, and reducing stress for both patients and caregivers. It then summarizes various products available at two websites, including tools for wandering prevention, safety, communication, bathing assistance, dining assistance, and home medical equipment. Website links are provided throughout for caregivers to explore different options. The document aims to raise awareness of available aids and help caregivers and patients on their journey.
Caregiver Presentation and Product Inspirations Sep 2023 PPT.pptxStephen Abram
This presentation provides information about tools and aids to support caregivers of those with dementia. It discusses goals such as building awareness of products that can increase safety, quality of life, and independence for dementia patients. It also aims to help caregivers reduce stress and guides them on their caregiving journey. The presentation directs caregivers to two websites that provide a wide range of helpful products.
The document discusses ensuring ethical AI and evaluating new technologies like ChatGPT. It makes four main points:
1. We often judge innovative technologies through the lens of the past instead of what they aim to be.
2. We should consider ethical implications but not make premature judgments based on speculation.
3. ChatGPT is not like search engines and should be viewed as a potential guide or co-pilot rather than just for retrieval.
4. New technologies should be explored to understand their capabilities and limitations before making judgments in order to help shape development in an ethical manner.
This document discusses ensuring ethical AI and summarizes a presentation about ChatGPT. It makes the following key points:
1. When innovative technologies emerge, we often try to understand them through outdated lenses rather than considering what they are attempting to be.
2. New AI tools like ChatGPT should be evaluated based on their own merits as conversational assistants rather than compared to previous technologies like search engines.
3. While considering ethical implications, judgment should not be made too soon based on speculation alone. We should attempt to be part of shaping new technologies responsibly.
CEED Mindfulness in a time of Turbulence.pdfStephen Abram
Stephen Abram introduced himself as the CEO of Lighthouse Consulting, Inc. and presented a webinar on mindfulness in turbulent times. He argued that society should stop glorifying overwork and burning out, and instead encourage more balance. To find balance, one should start with reflecting on themselves and their own well-being, then consider the perspective of their community. By putting positive energy into the world through welcoming behavior, people can receive positive energy in return.
The document provides information about an upcoming webinar hosted by the Centre for Excellence on Empathy, Equity & Diversity (CEEED). It introduces CEEED's mission and strategy of inclusion, as well as its webinar series focusing on topics like interfaith spaces, well-being, and mindfulness. The webinar on June 22nd will feature speeches by Dr. Ellen Choi and Stephen Abram on cultural mindfulness, with questions moderated by CEEED board members. Details are provided on CEEED's board and their publications, with the goal of networking organizations and disseminating resources on social justice issues.
This document discusses strategies for gaining community support through statistics, measurements, and stories to demonstrate impact. It introduces Stephen Abram and Kim Silk who will discuss using data and stories together, with data providing facts and measurements, and stories making data more human and memorable. The document emphasizes that both data and stories are needed to be effective and gain support. It also discusses some challenges with library data and how to address them.
Combined Illegal, Unregulated and Unreported (IUU) Vessel List.Christina Parmionova
The best available, up-to-date information on all fishing and related vessels that appear on the illegal, unregulated, and unreported (IUU) fishing vessel lists published by Regional Fisheries Management Organisations (RFMOs) and related organisations. The aim of the site is to improve the effectiveness of the original IUU lists as a tool for a wide variety of stakeholders to better understand and combat illegal fishing and broader fisheries crime.
To date, the following regional organisations maintain or share lists of vessels that have been found to carry out or support IUU fishing within their own or adjacent convention areas and/or species of competence:
Commission for the Conservation of Antarctic Marine Living Resources (CCAMLR)
Commission for the Conservation of Southern Bluefin Tuna (CCSBT)
General Fisheries Commission for the Mediterranean (GFCM)
Inter-American Tropical Tuna Commission (IATTC)
International Commission for the Conservation of Atlantic Tunas (ICCAT)
Indian Ocean Tuna Commission (IOTC)
Northwest Atlantic Fisheries Organisation (NAFO)
North East Atlantic Fisheries Commission (NEAFC)
North Pacific Fisheries Commission (NPFC)
South East Atlantic Fisheries Organisation (SEAFO)
South Pacific Regional Fisheries Management Organisation (SPRFMO)
Southern Indian Ocean Fisheries Agreement (SIOFA)
Western and Central Pacific Fisheries Commission (WCPFC)
The Combined IUU Fishing Vessel List merges all these sources into one list that provides a single reference point to identify whether a vessel is currently IUU listed. Vessels that have been IUU listed in the past and subsequently delisted (for example because of a change in ownership, or because the vessel is no longer in service) are also retained on the site, so that the site contains a full historic record of IUU listed fishing vessels.
Unlike the IUU lists published on individual RFMO websites, which may update vessel details infrequently or not at all, the Combined IUU Fishing Vessel List is kept up to date with the best available information regarding changes to vessel identity, flag state, ownership, location, and operations.
United Nations World Oceans Day 2024; June 8th " Awaken new dephts".Christina Parmionova
The program will expand our perspectives and appreciation for our blue planet, build new foundations for our relationship to the ocean, and ignite a wave of action toward necessary change.
UN WOD 2024 will take us on a journey of discovery through the ocean's vastness, tapping into the wisdom and expertise of global policy-makers, scientists, managers, thought leaders, and artists to awaken new depths of understanding, compassion, collaboration and commitment for the ocean and all it sustains. The program will expand our perspectives and appreciation for our blue planet, build new foundations for our relationship to the ocean, and ignite a wave of action toward necessary change.
The Antyodaya Saral Haryana Portal is a pioneering initiative by the Government of Haryana aimed at providing citizens with seamless access to a wide range of government services
RFP for Reno's Community Assistance CenterThis Is Reno
Property appraisals completed in May for downtown Reno’s Community Assistance and Triage Centers (CAC) reveal that repairing the buildings to bring them back into service would cost an estimated $10.1 million—nearly four times the amount previously reported by city staff.
A Guide to AI for Smarter Nonprofits - Dr. Cori Faklaris, UNC CharlotteCori Faklaris
Working with data is a challenge for many organizations. Nonprofits in particular may need to collect and analyze sensitive, incomplete, and/or biased historical data about people. In this talk, Dr. Cori Faklaris of UNC Charlotte provides an overview of current AI capabilities and weaknesses to consider when integrating current AI technologies into the data workflow. The talk is organized around three takeaways: (1) For better or sometimes worse, AI provides you with “infinite interns.” (2) Give people permission & guardrails to learn what works with these “interns” and what doesn’t. (3) Create a roadmap for adding in more AI to assist nonprofit work, along with strategies for bias mitigation.
Jennifer Schaus and Associates hosts a complimentary webinar series on The FAR in 2024. Join the webinars on Wednesdays and Fridays at noon, eastern.
Recordings are on YouTube and the company website.
https://www.youtube.com/@jenniferschaus/videos
Indira awas yojana housing scheme renamed as PMAYnarinav14
Indira Awas Yojana (IAY) played a significant role in addressing rural housing needs in India. It emerged as a comprehensive program for affordable housing solutions in rural areas, predating the government’s broader focus on mass housing initiatives.
1. First Nations Public Libraries: A Peer Study, 2012-2014
This analysis of Ontario’s First Nations public libraries compares the data from
46 libraries for 2014 along with nine major Ontario public libraries. We also do a
few summary comparisons of these libraries with a set of smaller Ontario
libraries for reasons discussed below. Data from a smaller set of libraries are
compared from 2012-2014 to examine trends.
The data were drawn from the raw data on Ontario’s public libraries compiled
and published by the Ministry of Tourism, Culture and Sport from 1999-2014.
This collection comprises a large and rich dataset.
Historically, public library data have been used largely for comparisons of peers
and usually those peer comparisons are based on peers based on size of the
library but other means of organizing peer groups have been used. In this report,
the comparisons are based on the Ministry’s “Library Service Type” of “First
Nations Libraries.”
Given that libraries vary so much in budgets, collections, staff, and resident
population--the distributions are commonly highly skewed--the common
practice is to use ratios of variables for analysis and comparison. For instance, in
the 2014 data, Toronto Public Library reported that its resident population of 2.8
million circulated 32 million items. That year Chippewas of Georgina Island First
Nation Public Library’s 198 population reported 5,549 circulations.
How can we compare those two figures in a useful way? The practice in this case
is to calculate the per capitas: how many items, on average, did each member of
the library’s resident population take out in a year? For Toronto Public Library
the circulations per capita were 11.4 while Georgina Island library’s figure was
13.3. Generally, for circulations per capita, higher seen as better so we have a bit
of evidence that Georgina Island library’s residents are more active users of their
library than those in Toronto. This particular ratio has been calculated for some
time and has value in comparing disparate libraries. There is no question that the
Toronto Public Library is bigger and circulates more but the users of the
Georgina library, on average, check out more items per person.
2. First Nations Public Libraries, 2012-2014
Page 2
What we have done in this report is to use both traditional and newer ratios to
delve beyond basic ratios to assess how a set library is doing compared to a set of
peer libraries.
A longer discussion of the method we are using here is found in the Appendix at
the end of this report. This method was developed after analysis of similar
ranking schemes and updated to include the data reported about the newer
means of making information available through libraries.
Briefly, there are 16 ratios in five “dimensions” or major aspects of libraries. The
libraries are ranked by these ratios and the by Dimension. Library ranking
schemes generally use similar types of analysis; that is, ranking by explicit
criteria and then combining the various ranks by some method. The idea behind
such a broad-based method is to provide a balanced, systematic view of the
comparative performance of a set of libraries. This kind of analysis compresses a
large amount of data and allows the staff at a library to assess their library
against peers. Given the compression of data, one will be drawn to various
numbers and led to greater detail. Those data details must be assessed against
what is known, against occasional difficult-to-believe numbers, and including
qualitative aspects of libraries that are difficult to count. We weigh such evidence
to come up with a more comprehensive assessment of a library’s strengths and
weaknesses. Data are a form of evidence and rarely in our field do such data give
us a definitive answer but they do give indications upon which to base decisions.
Libraries have different tasks and we group these tasks in the Dimensions.
However, these variables do not always work in parallel because running a
library is a complex process involving judgments about choosing to set priorities
among competing programs and initiatives.
This study of the First Nations’ libraries looks at three groups of libraries. We
first have this general discussion of the results. Table 1, which follows this
3. First Nations Public Libraries, 2012-2014
Page 3
introduction has summary data. The results in Table 1 lead to a short discussion
of how the data from these libraries compare to other Ontario public libraries
and these preliminary results are summarized in Tables 2 and 3. Table 4 has data
from 2012-2014 for the seven First Nations libraries for which all necessary data
are available. We discuss this matter in more detail there.
This kind of analysis in the end leads to focusing questions about where a
library’s strengths and weaknesses are but in comparison with its peers not in
theoretical mathematical isolation. The result, then, is to see what your library
does and compare it with other similar libraries. In this case, similarities are by
size and locality and should spark conversations with local librarians about
differences shown by the data.
Table 1 follows with 2014 data from the 46 First Nations Libraries and data from
those libraries mixed with data from 9 large Ontario public library “Influencers.”
4. First Nations Public Libraries and their peers, 2012-2014
Detailed tables
Table 1: First Nations Libraries - Peer Comparisons-Detailed Summary of Ranks, 2014, 6
pages: Pages 1a and 1b, 2a and 2b, 3a and 3b.
Table 2: Select Rank Data from Nine Ontario "Influencers"
Table 3: Ontario Libraries by Library Service Type, with Select Data, 2014
Table 4: First Nations Libraries - Peer Comparisons-Detailed Summary of Ranks, 2012-
2014. Also on 6 pages
The Peer Comparison Notes—an explanation of the methodology used—is the
Appendix after the tables.
5. First Nations Public Libraries, 2012-2014
Table 1
Page 1
Table 1: Peer Comparisons, Detailed Summary of Ranks, 2014
Table 1 is a bit complex because it comes from a spreadsheet too large to print
legibly and it is hoped we have a reasonable compromise here.
Table 1 is comprised of six pages in three Parts. Part 1 is pages 1a and 1b which
have the four variables in the Service Dimension and related ranks. Page 1a has
this Dimension for the 46 First Nations libraries while Page 1b has this
Dimension for these libraries plus the 9 large Ontario libraries regarded as
“Influencers.” Parts 2 and 3 follow a similar pattern with their pages. Part 2 has
the Service and Usage Dimension and Part 3 has the Efficiency and Development
Dimensions.
In the original spreadsheet, what prints out here as the top sheet (Pages 1a, 2a,
and 3a) is one logical spreadsheet. Similarly, Pages 1b, 2b, and 3b are one logical
spreadsheet.
We start with a tour beginning with Part 1 (1a and 1b) from the left. The Library
Number is the Ministry’s key number. It is designed to remain the same even
with changes in a library‘s name. The Resident Population is the number that is
commonly used in grouping libraries by size.
The blue section has the summary rank of all ranks for all 16 variables. It is made
by the sum of the ranks of all 16 variables with lower numbers (rank 1 is better
than 46) being better. For the spreadsheet for the 46 libraries (1a, 2a, and 3a) the
sums are calculated from the ranks of each variable in the five Dimensions for
those libraries. Pages 1b, 2b, and 3b are the printed version of the larger
spreadsheet with the 55 libraries and organized similarly.
The sums are based on unweighted ranks. The sum of all ranks is sorted and the
rank of all ranks assigned. There are ties and the libraries with the same scores
get the same rank and the library with the next highest score gets the rank it
would have if there were no ties. The sum of all ranks only appears in Part 1 but
the Rank of Ranks is repeated in Parts 2 and 3.
6. First Nations Public Libraries, 2012-2014
Table 1
Page 2
Note that the sums of ranks in 1a and 1b for the same library may be different.
Remember the first table has 46 libraries while the second has 55 so the sums of their
ranks will tend to be higher in the larger table.
This blue section is critical because it presents the results of this analysis but we
move on to the right to two columns in green which give us the best and worst
ranks for each library across the 16 variables. While the total rank is informative, the
differences between the high and low scores suggest the areas where a library might
improve its overall rank or look where it does particularly well or poorly when
compared to its peers. Note also that there is a great deal of variation: there are
libraries which have variables where they rank high and others where they rank
low.
Now to the data! Moving right, we have the first of our Dimensions, the Service
Dimension. The rank of ranks for this Dimension is highlighted in gold. This pattern
is followed with the four other dimensions: summary ranks for that Dimension,
with details of the variables and each library’s rank for that variable.
As mentioned, the Appendix has a more detailed explanation of the method used
here. It is an adaption of similar analytical tools for comparing libraries. Shorn of the
complexity, what we have is a means to assess how a library is doing by comparing
its data with similar libraries. As a tool, its value will vary with the quality of data.
Data are a form of evidence and, sadly, rarely give us precise answers to our
questions; we must weigh the evidence and use our experience to make sense of
what the data tell us.
Given the structure of this method, the Dimensions give us a means of grouping
functions and the 16 variables give us a good bit of precision in narrowing down a
library’s strength and weaknesses, compared to its peers. Another little-discussed
aspect of these kinds of assessments is the fact that they allow librarians to focus on
libraries like theirs in other ways and that information likely will improve library
services. In effect, this kind of analysis forms an index to libraries with similar
situations and which invite informal discussions.
7. First Nations Public Libraries, 2012-2014
Table 1
Page 3
Table 1 provides a good bit of data and information about the First Nations
libraries and a few interesting items in the table with the 55 libraries is worthy of
a more detailed look.
The six pages of Table 1 follow. After Table 1, we turn to Tables 2 and 3 for a
brief look at First Nations libraries and how their data compare with other
Ontario libraries.
14. First Nations Public Libraries, 2012-2014
Tables 2 and 3
Page 1
Tables 2 and 3: Peer Comparisons with Other Ontario Libraries
The pages in Table 1 (1a, 2a, and 3a) with the 46 First Nations libraries provide a
means for staff at those libraries to examine how they compare with others.
Looking at the parts of Table 1 with the 9 “Influencers,” the reader will note that
these larger libraries summary ranks are generally in the lower half with the best
rank being Hamilton Public Library’s 27th Rank of Ranks. This fact suggests that
in aggregate, the First Nations libraries are doing well in comparison with these
very large libraries.
However, since we have a variety of data to look at, we can look a bit deeper.
Table 2 focusses on the ranks of all ranks of these Influencers by including just
these libraries, their ranks in the larger table, along with three sets of ranks from
other variables that we discuss shortly.
These data lead us to examine the broader tapestry of Ontario’s Public Libraries.
This examination is a bit out of scope for this project but it might prove useful to
probe a deeper context to the First Nations’ libraries environment.
The next three ranks in Table 2 are for the rank of these 9 libraries in the larger
table for circulations per capita, stock turnover, and collection units per capita.
The Dimensions they come from are in parentheses. This question arose in
looking at the circulations per capita figures in the First Nations libraries some of
which are quite low. This table is where this question led.
What might we conclude from these data? The rank of circulations per capita for
these libraries are all in the upper half of the 55 libraries but note the stock
turnover. Stock turnover is another very old measure that attempts to gauge how
active the collection is: how many times will any item in the collection circulate?
The 9 libraries are the top 9 of the 55. How could this astonishing finding be true
given the circulations per capita ranks?
15. First Nations Public Libraries, 2012-2014
Tables 2 and 3
Page 2
Look at the last column: collection units per capita—how many items are there in
the collection for each member of the resident population? These large libraries,
relative to the First Nations libraries, have small collections but the collections
are quite active. Therefore, it seems that the First Nations libraries have relatively
larger but less used collections than the 9 large libraries. Without further
analysis, we can only speculate about what the differences are. Are the First
Nations libraries’ collections older? In which case, we might look at the collection
budgets. What about staff? Are library users less likely to get help at the First
Nations libraries? No, one of the variables in the Service Dimension ranks
employees per capita and the larger libraries and the best ratio is Hamilton’s and
it is 35th. The rest are in the 40s and 50s so help is probably more easily obtained
at the First Nations libraries.
Of course, libraries are different in many other ways. Suppose we wanted to
examine libraries by another way? Look at Table 3 for a design of a spreadsheet
that would probe different ways to group libraries. Here we have divided the
libraries in Ontario two ways. First is the four Library Service Types and we
include some summary data for a preliminary look.
As we have noted, size of the library is often used for grouping libraries. We
include 163 Ontario libraries that are not First Nations libraries but which are of
the same size range to see what we can see. The First Nations Libraries range in
size from a resident population of 47 to 12,436. This approach seems at first blush
to be of more use than the Library Service Types to examine comparative
circulation data but one never knows what surprises lurk in data. However, note
the differences in circulations and circulations per capita between the First
Nations libraries and the Ontario libraries of the same size. The total annual
circulation figures for the First Nations Libraries have a high of 9,200 and a low
of 45, with an average while the same-sized library group has a maximum of
16. First Nations Public Libraries, 2012-2014
Tables 2 and 3
Page 3
almost 148,000, a low of 400, and an average of nearly 30,000. Those data suggest
another approach than size might be more useful but time will tell.
This topic is certainly worth exploring but it is off topic for this report.
Tables 2 and 3 follow and Table 4 comes after them. Table 4 is where we attempt
to analyze trends in these rank data but fall short because of missing data.
17. Table 2: Select Rank Data from Nine Ontario "Influencers"
(Usage) (Usage) (Service)
Rank of Ranks Rank for Rank for
ALL Circulations Rank for Collection
Library Population MEASURES per Stock units
YEAR Number Library Name (Resident) (lower is better) capita turnover per capita
2014 L0470 Greater Sudbury 161,900 41 24 9 48
2014 L0474 Hamilton 545,850 27 6 1 53
2014 L0213 Kingston-Frontenac County 152,777 31 11 6 49
2014 L0245 London 373,730 24 10 3 52
2014 L0206 Mississauga 759,000 46 11 2 54
2014 L0481 Ottawa 951,727 32 7 4 51
2014 L0349 Thunder Bay 108,359 38 21 8 47
2014 L0353 Toronto 2,808,503 30 8 5 45
2014 L0378 Windsor 210,891 43 18 7 50
Libraries added to the First Nations' peers
18. Table 3: Ontario Libraries by Library Service Type, with Select Data, 2014
Number of Population (Resident)
Libraries Library Service Type Total High Low Average High Low Average High Low Average
13 County, County co-operative or Regional Municipality Library 919,888 177,720 737 70,761 969,722 10,994 454,282 14.9 3.4 7.1
46 First Nations Library 49,427 12,436 47 1,075 9,200 45 1,769 28.0 0.1 4.5
5 LSB Library 4,015 1,500 300 803 18,846 400 5,513 20.0 0.8 6.8
247 Public or Union Library 12,362,961 2,808,503 204 50,052 32,034,795 710 494,561 25.7 0.7 8.1
163 Non-FN Libraries, in FN size range (by population) 664,132 12,385 204 4,074 147,841 400 29,689 25.7 0.7 7.8
Total Annual Circulation Circulations per capita
19. First Nations Public Libraries, 2012-2014
Table 4
Page 1
Table 4: Peer Comparisons, 2012-2014
The data for 2014 yield a great deal to report and a good bit to speculate about.
But trend data give us a look at how libraries are doing over time.
To examine trends in these rankings for the three years we sought, we need data
for those years. Unfortunately, of the 46 libraries reporting in 2014 and reported
on above, only seven have enough data to construct a complete series for the 16
variables over those years.
There are many causes for missing data about which we could speculate and we
will indulge in a bit of speculation now before returning to the data in Table 4.
In order to include a library in this analysis, it must provide data for all variables
used in the calculation. These variables are ratios, so at least two variables must
be reported for each. However, several of them are per capitas—a ratio divided
by the resident population served by the library—so population appears several
times. On the other hand, calculating the staff working at the library requires
fourteen variables. If one is missing, the calculations involved will yield
uncertain results. Also, the number of First Nations libraries varies each year.
They may well exist but do not report data but, in any case, the number
reporting varies.
Another speculation. Even though the ratio of staff to user at these libraries is
relatively high as we mentioned, the staffs are small. Reporting data is complex
enough that libraries have had a persistent problem for years in reporting data
because few librarians are comfortable working with data. This aspect of data
data compilation seems to be universal in the library world. In addition, the
Ontario public library data collection effort is apparently the largest such
ongoing collection which would exacerbate the problem of a small staff having
the expertise and time to fill out such complex forms. The term of art to describe
this kind of situation is “responder burden.” Faced with large and complex
20. First Nations Public Libraries, 2012-2014
Table 4
Page 2
surveys, and a shortage of time, the person filling out the form often will answer
data questions that can be answered easily.
The problems with all data—including library data—are daunting enough
without tempting fate by ignoring missing data or making data up. We have
seven First Nations libraries so we press on. This year we have 46 maybe we do
as well next year.
Table 4, like Table 1, has three parts and each is in two pages as before. The
reader will note that the formatting is a bit different. The top half has the seven
libraries for three years. You can see the ranks there as before. However, the
ranks are only for those seven libraries and they take up only part of the first
page and the ranks for the second group—the seven plus the “Influencers” take
up about a page and a half so this part of the table is split.
The stories would be more telling if we had more libraries but the reader will
note several patterns. Some libraries are consistent over the years—either
ranking high or low—and others change. In the seven in the First Nations
libraries, Aundeck-Omni-Kaning FN and Nipissing FN trade first and second
spot. Six Nations FN falls from 5th in 2012 and 2013 to 7th in 2014. At the same
time, Mohawks of Akwesasne FN moves from 7th to 5th. The larger table with the
Influencers shows similar patterns. To see how and why these changes took
place, one would examine the detailed data to see the effect of different variables
rising or falling. This kind of analysis is more useful with more libraries to
compare so we will hope for more data in the future.
The Appendix: “The Peer Comparison Notes—an explanation of the methodology
used” follows Table 4. We hope those looking for more information about the
construction of this analysis will find this discussion useful.
21. Table 4: First Nations Libraries - Peer Comparisons-Detailed Summary of Ranks, 2012-2014, Service Dimension Summary, 2012-2014, page 1a
First Nations Public Libraries
Rank of Ranks Sum of Rank for Population Rank for Population Population
ALL All Ranks Collection Collection Employees Rank for (Resident) Population per per
Library Population MEASURES All Dimensions Rank of Ranks Sum of units units per capita Employees per per service service
YEAR Number Library Name (Resident) (lower is better)(lower is better) (lower is better) Ranks per capita per capita X1000 per capita workstation workstation point point
2014 L1035 Aundeck-Omni-Kaning FN 360 2 50 2 9 10.5 6 152.8 1 90 1 360 1
2013 L1035 Aundeck-Omni-Kaning FN 355 1 44 2 9 10.7 5 154.9 2 89 1 355 1
2012 L1035 Aundeck-Omni-Kaning FN 356 1 46 1 6 10.6 3 154.5 1 89 1 356 1
2014 L0462 Bkejwanong FN 2,310 3 56 3 13 29.1 2 38.5 4 210 3 2,310 4
2013 L0462 Bkejwanong FN 2,304 3 62 3 14 27.0 2 39.5 5 209 3 2,304 4
2012 L0462 Bkejwanong FN 2,284 4 61 3 13 26.0 1 24.1 5 176 3 2,284 4
2014 L0408 Mohawks of Akwesasne FN 9,493 5 77 6 22 18.4 4 17.8 6 678 6 9,493 6
2013 L0408 Mohawks of Akwesasne FN 9,400 7 80 6 23 15.6 4 17.4 7 723 6 9,400 6
2012 L0408 Mohawks of Akwesasne FN 9,233 7 85 6 24 9.4 5 18.3 7 710 6 9,233 6
2014 L0412 Nipissing FN 947 1 45 1 7 59.8 1 63.4 2 95 2 947 2
2013 L0412 Nipissing FN 935 2 49 1 6 59.9 1 171.1 1 94 2 935 2
2012 L0412 Nipissing FN 932 2 55 2 12 7.2 6 59.0 2 93 2 932 2
2014 L0432 Sagamok Anishnawbek FN 1,556 5 77 5 19 3.7 7 22.5 5 389 4 1,556 3
2013 L0432 Sagamok Anishnawbek FN 1,531 4 67 4 17 3.7 7 45.7 3 383 4 1,531 3
2012 L0432 Sagamok Anishnawbek FN 1,543 3 58 5 18 3.8 7 45.4 3 386 5 1,543 3
2014 L0420 Six Nations FN 12,436 7 78 7 26 12.6 5 14.6 7 2,487 7 12,436 7
2013 L0420 Six Nations FN 11,297 5 71 7 26 7.1 6 21.9 6 1,027 7 11,297 7
2012 L0420 Six Nations FN 11,297 5 68 6 24 10.6 4 23.2 6 941 7 11,297 7
2014 L0426 Wikwemikong FN 3,115 4 65 4 16 20.8 3 51.4 3 623 5 3,115 5
2013 L0426 Wikwemikong FN 3,091 6 75 4 17 18.5 3 39.6 4 515 5 3,091 5
2012 L0426 Wikwemikong FN 3,065 6 75 4 15 18.0 2 27.7 4 255 4 3,065 5
Table 4: First Nations Libraries - Peer Comparisons-Detailed Summary of Ranks, 2012-2014, Service Dimension
First Nations Public Libraries plus Influencers
Rank of Ranks Sum of Rank for Population Rank for Population Population
ALL All Ranks Collection Collection Employees Rank for (Resident) Population per per
Library Population MEASURES All Dimensions Rank of Ranks Sum of units units per capita Employees per per service service
YEAR Number Library Name (Resident) (lower is better) (lower is better) (lower is better) Ranks per capita per capita X1000 per capita workstation workstation point point
2014 L1035 Aundeck-Omni-Kaning FN 360 5 113 2 9 10.5 6 152.8 1 90 1 360 1
2013 L1035 Aundeck-Omni-Kaning FN 355 2 102 2 9 10.7 5 154.9 2 89 1 355 1
2012 L1035 Aundeck-Omni-Kaning FN 356 2 108 1 6 10.6 3 154.5 1 89 1 356 1
2014 L0462 Bkejwanong FN 2,310 8 126 3 14 29.1 2 38.5 5 210 3 2,310 4
2013 L0462 Bkejwanong FN 2,304 7 133 3 14 27.0 2 39.5 5 209 3 2,304 4
2012 L0462 Bkejwanong FN 2,284 5 123 3 14 26.0 1 24.1 6 176 3 2,284 4
2014 L0470 Greater Sudbury 161,900 11 150 11 42 3.4 10 16.3 13 1,109 8 12,454 11
2013 L0470 Greater Sudbury 161,900 10 141 13 47 3.1 11 16.3 14 1,109 11 12,454 11
2012 L0470 Greater Sudbury 161,900 10 148 13 45 2.7 12 18.3 11 1,132 11 12,454 11
2014 L0474 Hamilton 545,850 2 110 7 35 1.9 15 44.3 4 1,144 9 8,804 7
2013 L0474 Hamilton 540,000 5 122 8 41 2.0 16 29.6 6 1,164 12 8,710 7
2012 L0474 Hamilton 535,234 2 108 8 38 2.4 15 50.5 3 1,236 13 8,496 7
Service
Service
27. Appendix:
Peer Comparison Notes
The peer comparisons presented here are based on data from the Ontario
Ministry of Culture, Tourism and Sport’s published 2014 Ontario library data.
The comparisons take these data and sort them into 16 separate variables and
organizes them in five “dimensions:” Service, Usage, Community Engagement,
Efficiency, and Development. This design is discussed in some detail elsewhere
but, simply, it is based on a study of four well-known public library assessment
efforts: the BIX, HAPLR, the IMLS US state ranking tables, and the LJ Index.
These all use ratios of different reported variables—rather than the raw data—
and then assign ranks to the calculated ratios. Those ranks are in order by which
numbers are “better.” Lower number ranks are better because 1 is the top rank.
The Ministry’s data series are very rich and offer more opportunities for
exploring variables within this design. We have largely followed the example of
the current literature for now.
The most common use of these data is to use them to analyze “peer” libraries.
What is a “peer” library? It is a library you wish to compare to yours. The
comparisons will be based on data.
Data do many things well but not everything. They give you a measure and it is
up to you to weigh the evidence from the data in order to learn how your library
compares with others. They do not measure everything, however, and are weak
in analyzing qualitative aspects of a library.
Which libraries to pick for your peers depends on your interests and library’s
objectives. You may wish to compare to libraries in your area, or to libraries with
similar users, or to libraries you wish to emulate. These data will not give you
one big number but 16 and those must be considered and weighed in light of
your library and its peers. Efficiency is something we all want but it can work at
28. Peer Comparison Notes
Page 2
cross purposes to Service. Weigh the evidence and it will often be one step in a
process of arriving at a balanced understanding of what these data will tell you.
As mentioned, the data are calculated and then ranked. The comparisons are
simple unweighted ranks. Ranks like these are often weighted but these first
presentations are unweighted. Weighting recognizes that some variables are
more important than others and handles that reality. There are ties in the ranks
when libraries have the same raw scores. In those cases, the ties get the same
rank while the next library is ranked where it would be if there were no tie. That
is, if two libraries had the best rank, they would be 1 and 1 and the third library
would have a rank of 3.
The data presented here are in several forms and with varying levels of detail
depending on the detail needed for different views.
Now we will outline the variables and dimensions. This discussion of variables is
brief and the reader is cautioned to realize that in each case where the variable is
described as a higher ratio or lower ratio is ranked better that what is left unsaid
is: “all other things being equal.” They are not and that is why we have more
than one variable to give you the context to understand your library and its peers
as the data describe them.
The first dimension is SERVICE and it has four variables:
Collection units per capita. “Units” is defined broadly. This is a measure of how
big the collections are for the size of the libraries’ resident populations. Higher is
better.
Employees per capita times 1,000. This measure tells us how big the staff is to
service the population. Higher is better. The calculation gives a small number
and to make it easier to understand, we multiplied by 1,000. It can be thought of
as so many people for each 1,000 in the resident population.
Population per workstation. This measure tells us how many workstations the
library has. By dividing the population by the count of workstations, we have a
29. Peer Comparison Notes
Page 3
number which indicates, how likely a library user is to find an empty
workstation. Here, a lower ratio is better. Consider: is it better to have 10,000
people per workstation or 100?
Population per service point. Service points are broadly defined to include
places where people will have physical access to the library. They can include
bookmobiles, branches, and deposit stations. Again, a lower is better. Is it better
to have 10,000 users per service point or 100?
USAGE
This dimension has three variables related to the actual use of the library.
Stock turnover is a traditional measure: how many times is each item (on
average) checked out? Here total annual circulations are divided by a count of
circulating items held. Higher is generally better.
Circulations per capita is another well-known calculation. Annual circulations
divided by resident population. Higher is better.
Program attendance per registered borrower. How many of the libraries’
cardholders attend the libraries’ programs. The reported number in the detailed
tables is 100 times the raw calculation. Total annual program attendance divided
by the reported number of library cardholders. Higher is better.
COMMUNITY ENGAGEMENT
This dimension is new to the world of library assessment and it was created to
get a handle on an important set of changes occurring in the library world: the
modern library is not a passive organization waiting patiently for people to
appear but one increasingly looking for opportunities to meet its public
wherever they are and wherever they have information needs. The four
measures in this dimension are an attempt to measure how libraries are
adapting.
30. Peer Comparison Notes
Page 4
Programs offered per capita. The higher ratio is better.
Registered borrowers per capita. What percentage of the libraries’ resident
populations have library cards? Higher is better but we have documented how
this percentage has been declining in Ontario’s libraries.
Hours open per capita times 100. Hours open includes not just buildings but
bookmobile and deposit station hours. More hours open per person although as
we know, a library’s electronic presence is open for business at all hours. Higher
is better.
Estimated Annual Visits per capita. This ratio is the result of a complex
calculation. Visits are tracked as “Typical Week” data so the data presumably re
for one week. The population is an annual figure so the visits were summed and
then multiplied by 52 and that product divided by the resident population. Visits
are of three types: In person, electronic (to the libraries’ Websites,) and electronic
(to the libraries’ social media sites.)
EFFICIENCY
This dimension occasionally works against the others. Service is better with more
staff, money, and service points but more economical if these are balanced by
care in allocating resources. It is always a matter of balance and by looking at
your peer libraries, you can see how they made the same kinds of balancing
decisions your library must.
Collection expenditures per circulation. Lower is better. That is, more
circulations per dollar spent is better than spending many dollars per circulation.
Estimated Visits per open hour. Visits, again, come from “Typical Week” data
and given that these figures and the open hour figure are both weekly figures,
there is no need to do more than sum the number of visits and divide by the
number of open hours. Higher is better: more people visiting is better than fewer
31. Peer Comparison Notes
Page 5
people. Note that electronic visits are included and that these can occur when the
library’s buildings are not open.
Total Expenditures per estimated annual visit. Total operating expenditures of
the libraries divided by the annualized visit figure to give an imputed cost per
visit. Lower is better. It is better to have more visits per dollar spent.
DEVELOPMENT
The attempt here is future oriented.
Staff Training as a % of Total Operating Expenditures. This number is times
100 so these are the percentage figures. Staff training in this day and time is
important but with library budgets being stretched, helping staff keep up with
new developments by training or conference attendance is a difficult thing. But:
higher is better.
Total Operating Expenditures per capita. This is an important number and one
that affects the whole operation of the library including what it does and can do
to prepare for the future. Higher is better.